Cows and Crops, September 2016
In This Issue
- Benchmarking Your Dairy’s Performance
- Free Disposal of Banned, Unusable Pesticides Available to Maine Residents
- Do You Know Your Costs to Grow Feed?
- Making the transition to no-till corn/cover crop system
- Deadlines Near for Forage Risk Management Programs in Maine
- Corn Chopping Time!
Benchmarking Your Dairy’s Performance
Dave Marcinkowski, Dairy Specialist
Benchmarking is defined as comparing the performance of your individual farm to the average of a group of farms. Good managers are always comparing their farm to others, measuring progress to see if they are keeping up. Information from DHIA gives us an opportunity to compare various measures of production, reproduction, genetics and health.
Benchmarking is also useful in setting goals for your farm. Comparing your farm to the Maine average is useful, but who wants to be average? Many of the herd averages below are in some way correlated with milk production and farm profitability. Use these benchmarks to set goals for your farm. If you are below average, then average may be worth striving for. If you are at or above average, pick a number that is attainable in the next 5 years and work toward that goal. Pick just a couple of these measures that appear to be the biggest bottleneck on your operation a set a goal to improve them.
Let’s look at some of the 2015 Maine DHIA averages. One hundred and ten Maine herds make up these averages, but keep in mind these averages include all types of farms, large and small, organic and conventional, purebred and grade of all breeds. Although these numbers are from DHIA herds, with a few records and a little digging, many of the measures can be calculated in herds that are not on DHIA as well
| Measure | Average | Range |
|---|---|---|
| Herd Size | 141 Cows | 20 – 1013 |
| Milk per Cow (Milking Cows) | 60.7 lbs. | 32 – 87.7 |
| Rolling Herd Average | 19,179 lbs. | 9,222 – 29,652 |
| Butterfat % | 4.1% | 3.2 – 5.7 |
| Protein % | 3.2 % | 2.7 – 3.9 |
| Peak Milk First Lactation Cows | 68.2 lbs. | 37 – 102 |
| Peak Milk Second Lactation Cows | 86.6 lbs. | 39 – 121 |
| Peak Milk 3+ Lactation Cows | 93.8 Lbs. | 56 – 134 |
| Somatic Cell Count | 206,000 | 75,000 – 806,000 |
| Percent of Herd Low Somatic Cell Count | 74.5% | 34 – 94 |
| Days in Milk at First Breeding | 93.9 | 54 – 244 |
| Heat Detection Rate | 38.5% | 10 – 79 |
| Conception Rate | 44.5% | 19 – 96 |
| Calving Interval (Months) | 13.7 | 11.6 – 19.9 |
| Annual Culling Rate | 33.2% | 15 – 96 |
| Percent of Herd Died | 4.4% | 0 – 19 |
| Average Age at First Calving (Months) | 27.8 | 22 – 36 |
Milk Production
Milk per cow and rolling herd average are two measures of milk production critical to the overall profitability of the farm. They are also a good indicators of the general management on the farm. For a conventional herd we typically think that 70-75 lbs. per day is required for a farm to be profitable most of the time. This translates into a rolling herd average of about 21,350 – 22,875 lbs. per cow annually. For organic herds this number is a bit less, or about 55 – 60 lbs. per cow per day.
Milk Components
Butterfat and protein percentages are best evaluated by breed. The table below is a summary of milk production, fat and protein percentages for each breed of dairy cattle in the state of Maine.
| Breed | Milk Production (lbs.) | Fat % | Protein % |
|---|---|---|---|
| Ayrshire | 17,703 | 3.84 | 3.07 |
| Brown Swiss | 15,055 | 3.81 | 3.18 |
| Guernsey | 16,094 | 4.42 | 3.27 |
| Holstein | 25,853 | 3.87 | 2.99 |
| Jersey | 20,052 | 4.83 | 3.54 |
| Milking Shorthorn | 17,272 | 3.66 | 3.05 |
Council on Dairy Cattle Breeding, 2014 Maine Lactation Averages
The level of butterfat and protein in a herd is tricky to evaluate. There are a number of factors that affect milk components including stage of lactation, nutrition, genetics, mastitis and season. Higher components are desirable because the milk brings a higher price. Higher producing cows however, generally have lower fat and protein percentages in their milk. This is probably due to a dilution effect that occurs when more milk is produced. However, when the overall fat percentage of the herd is higher than the table values, the herd may not be producing milk at its full potential.
Somatic Cell Count (SCC)
The somatic cell count is an overall measure of udder health, mastitis and milk quality. It is also highly correlated with milk production. Lower somatic cell counts mean higher milk production. Reducing SCC’s is an opportunity for most Maine farms to increase milk production without milking more cows. Research shows a relationship between the herd SCC and the percent quarters infected in the herd. At a level of 200,000 cell/ml it is estimated that 6.2 % of the quarters are infected and at 400,000, cells/ml it is 12.8 %. Savings from reduced SCC’s can be substantial, considering each case of mastitis costs the farm about $200.
Reproduction
Reproduction is another key area. Good reproductive performance requires fewer days in milk at first breeding coupled with good heat detection and conception rates. Each day a cow is open over 90 days, costs the farm about $2.00. With an average calving interval of 13.7 months there is an opportunity on many farms to improve reproduction. A one-month reduction in the calving interval could return the farm an additional $60 for every cow in the herd.
Culling Rates
Culling rates can be difficult to evaluate. Since older animals have paid for their rearing costs and produce more milk, a lower culling rate is usually desirable. But a lot depends on whether the herd is maintaining a constant herd size, or increasing in size. Herds that are not growing in size typically have a culling rate equal to the rate of incoming replacement heifers, but growing herds need every milk cow they can keep in the herd. Culling also depends on the reasons why cows leave a particular herd. It is better if they leave for voluntary reasons because this gives the owner more options. However, when cows died or have to leave because they are not productive they have to be replaced. For most herds, the average culling rate of 33%, is probably about right.
Age at First Calving
Normally we would like to have heifers calve for the first time at 22-24 months of age. With an average age at first calving of 27.8 months there is considerable room for improvement on a number of Maine farms. The question for each herd is: Are the heifers just getting bred too late or are the growth rates not producing a heifer of adequate size to calve easily at 22 – 24 months? Regardless of the reason, maintaining heifers that are not producing milk is costly to the farm. Research indicates that each additional day a heifer remains uncalved in the herd, costs about $3. An additional month costs $90 per heifer.
These are just a few of the important benchmarks extracted from Maine DHIA herds. Compare your farm to these benchmarks and identify some areas for improvement.
Free Disposal of Banned, Unusable Pesticides Available to Maine Residents
This October, the Maine Department of Agriculture, Conservation and Forestry’s (DACF) Board of Pesticides Control (BPC) and the Maine Department of Environmental Protection (DEP) will help Mainers dispose of banned or unusable pesticides. The Maine Obsolete Pesticides Collection Program is a free annual program for homeowners, family-owned farms and greenhouses. The program has collected almost 100 tons of pesticides since its inception.
Collections will occur at sites in Presque Isle, Bangor, Augusta and Portland. Participants must register by September 23, 2016.
Governor Paul R. LePage is urging Mainers to take advantage of this opportunity to protect the environment and save money by participating in this annual collection event. “This is an efficient, effective way to protect the environment and assist Mainers with the proper disposal of unusable pesticides at no expense to them. By combining the in-house resources of two state agencies, disposal costs are reduced to about $2 per pound, helping to minimize the cost to Maine taxpayers.”
“Homeowners and farmers inadvertently store banned pesticides or pesticides that have become unusable,” said Whitcomb. “They can be found in basements, garages, barns, and recently purchased homes. The Maine Obsolete Pesticides Collection Program helps prevent unwanted pesticides from being thrown in the trash or poured down the drain, potentially contaminating the land or drinking water.”
“Proper disposal of pesticides gives everyone the opportunity to make a positive impact on our environment and public health at no cost to Maine residents,” said Maine DEP Commissioner Paul Mercer. “The collection events are held at several locations across the State, and registering is free and easy.”
The collected chemicals go to out-of-state disposal facilities licensed by the federal Environmental Protection Agency where they are incinerated or reprocessed.
Registration by September 23, 2016, is mandatory—drop-ins are not permitted. To register, get details, and learn important information about the temporary storage and transportation of obsolete pesticides, go to the BPC website , or call 207.287.2731.
The Maine Obsolete Pesticides Collection Program, jointly sponsored by the BPC and DEP, and paid for entirely through pesticide product registration fees, has kept more than 97 tons of pesticides out of the waste stream since its start in 1982.
To print a poster with information about the collection program, visit www.maine.gov/tools/whatsnew/attach.php?id=702884&an=1. If possible, display this poster wherever appropriate.
For more information on the Maine Board of Pesticides Control, go to www.thinkfirstspraylast.org.
For more information on the Maine Department of Environmental Protection, go to www.maine.gov/dep.
Do You Know Your Costs to Grow Feed?
Feed costs tend to be the largest expense on a dairy operation and managing those costs contributes to a dairy’s ability to be profitable.
These costs include purchased feed, but also the true costs to produce crops raised on the farm. Home-raised feeds vary in type, quality, and quantity, but more importantly the cost to produce a given feedstuff is unique to each individual operation. Planning and tracking the costs associated with home-raised feeds is an often overlooked aspect of the farm business that is integral to profitability.
Variations in soil fertility, available acreage, equipment, storage, and labor are some of the larger factors contributing to how much and of what quality feed is produced on the farm. Such diversity means each farm should create and evaluate cropping strategies to strike the right balance of quality and quantity. Knowing the costs associated with those feeds is an integral part of that cropping strategy. Specific steps in determining home-raised feed costs were outlined in a previous article, The Crop Costs Conversion (Beck, 2014). The article addressed determining crop inventories, estimating direct and overhead costs, and comparing to market values. It recommended that crop expenses such as seed, fertilizer, and chemical be identified with a specific crop. Keeping track of the crop acres each expense applies to will increase the accuracy of calculating the direct costs and planning future costs based on the previous year.
The following tables illustrate the planned costs by harvest yield group for three major commodities: corn silage, corn grain, and soybeans. This represents 104 farms that participated in the 2016 Penn State Extension “Know Your Numbers” program. This program is designed to assist producers with calculating their crop costs and estimating their annual breakeven costs for the dairy enterprise and whole farm. For 2016, the 100 farms producing corn silage had average estimates of $23.04/ton. According to the monthly Penn State Feed Price List authored by Virginia Ishler, Penn State Extension Dairy Specialist, the average market value for corn silage in the first half of 2016 was $48.48. It is important to note that this average is a statewide average, and values fluctuate between regions. Regardless of region, average home-raised costs tend to be lower than the market value.
| Harvested Yield per Acre < 18 T/A | Harvested Yield per Acre 18-22 T/A | Harvested Yield per Acre > 22 T/A | Harvested Yield per Acre Average | |
|---|---|---|---|---|
| Farms in category, % | 15% | 32% | 53% | 100% |
| Yield per Acre | 15.0 | 19.7 | 25.8 | 22.2 |
| Total Acres | 227 | 74 | 64 | 92 |
| Direct Costs | ||||
| Seed/Acre | $ 72 | $ 73 | $ 91 | $ 82 |
| Fertilizer/Acre | $ 75 | $ 69 | $ 67 | $ 69 |
| Chemical/Acre | $ 57 | $ 28 | $ 40 | $ 39 |
| Custom Hire/Acre | $ 69 | $ 85 | $ 80 | $ 80 |
| Total Direct Costs | ||||
| Per Acre | $ 273 | $ 255 | $ 278 | $ 270 |
| Per Ton | $ 18.02 | $ 12.90 | $ 10.89 | $ 12.60 |
| Overhead Costs | ||||
| Per Acre | $ 139 | $ 166 | $ 168 | $ 163 |
| Per Ton | $ 9.37 | $ 8.55 | $ 6.55 | $ 7.61 |
| Total Costs | ||||
| Per Acre | $ 472 | $ 502 | $ 530 | $ 513 |
| Per Ton | $ 31.50 | $ 25.46 | $ 20.53 | $ 23.04 |
For each of the planned costs there is an interesting trend. Farms with lower yields averaged lower per acre costs but higher costs per unit of feed. Conversely, farms with higher yields had greater costs per acre but realized lower costs per unit of feed. Given that yields are subject to a variety of factors, it is vital that tracking costs goes beyond the calculation per acre. Examining the home-raised feeds’ unit costs helps determine if inputs are in line with outputs.
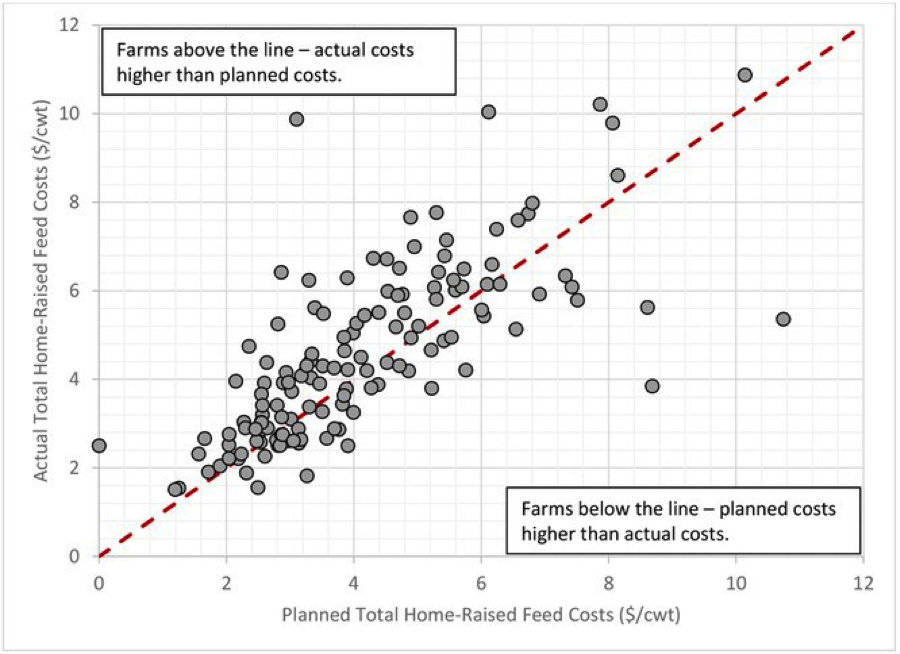
Given the influence of yield on home-raised crop costs, it’s important to estimate what the costs are and follow up by evaluating actual costs once yield estimates are finalized. A subset of 45 “Know Your Numbers” farm participants provided annual actual costs that were compared back to their planned costs. Figure 1 presents planned total home-raised feed costs per cwt versus the year-end actual total home-raised feed costs per cwt. The planned estimates were adjusted to account for cow number and milk production differences as compared to the year-end actual. There were a few farms where the plan was nearly identical to the year-end actual. On average, most planned costs were lower than the actual home-raised feed costs the farm reported. Having detailed expense records by crop combined with acres harvested and yields by crop will improve the accuracy of both planned and actual crop costs and the home-raised feed costs.
Dairy farms have a unique combination of resources and limitations to ensure their farm is profitable. To buffer market volatility, controlling home-raised feed costs by estimating expenses, determining actual costs, and monitoring both feed quality and quantity are needed. Penn State Extension has tools and programs available to help producers and their advisors get started. The “Know Your Numbers“ cash flow program is one method, and there is the newly revised CropCents mobile app. This application (available regardless of mobile or computer platform) allows producers to enter their direct crop expenses as well as partition operating expenses to all the crops produced on the farm, resulting in estimates of yields and costs per unit. Producers can determine the yields based on common units for each commodity.
References
- Beck, T. 2014. The Crop Costs Conversation: Get the most out of your cropping plan, Dairy Digest, February, 2014. Accessed 8/15/2016.
- Ishler, V. 2016. Penn State Feed Price List. vishler@psu.edu. Accessed 8/15/2016.
Contact Information
Robert C. Goodling, Extension Associate, Penn State Extension, Department of Animal Science, rcg133@psu.edu, 814.863.3663.
Penn State College of Agricultural Sciences research and extension programs are funded in part by Pennsylvania counties, the Commonwealth of Pennsylvania, and the U.S. Department of Agriculture.
Where trade names appear, no discrimination is intended, and no endorsement by Penn State Extension is implied.
This publication is available in alternative media on request.
Penn State is an equal opportunity, affirmative action employer, and is committed to providing employment opportunities to all qualified applicants without regard to race, color, religion, age, sex, sexual orientation, gender identity, national origin, disability or protected veteran status.
© The Pennsylvania State University 2016
Making the transition to no-till corn/cover crop system
Masoud Hashemi (UMass)
Richard Kersbergen (UMaine)
Kate Parson (NRCS-Amherst)
Samantha Glaze-Corcoran (UMass, PhD Candidate)
In New England, farmers generally rely on tillage to create a warm, dry, and weed-free seedbed. However, tillage makes the soil susceptible to erosion, and contributes to soil compaction, especially when the soil is wet and not well dried. Intensive tillage, lack of surface cover, and insufficient crop residue has played a significant role in soil degradation. In recent years, research by Extension and universities, as well as soil health campaigns by NRCS, have raised awareness and expanded farmer demand for more information pertaining to cover cropping and no-till systems.
Benefits of no-till with cover crop systems include:
- Minimized soil degradation, including erosion, crusting, and
- Water conservation from reduced soil evaporation due to residue on the soil surface, elimination of tillage practices that dry the soil, and more water stored in the soil due to increased organic matter levels, culminating in improved crop tolerance to
- Increased soil organic matter as well as improved soil structure that will improve water
- Reduced cost of operation – reports average $50 per acre savings in fuel and labor
- Earlier plantings of corn following winter grain cover crop, which increases the likelihood of harvesting first cut hay, haylage, or baleage at peak nutritional
- Improved opportunity to graze or harvest cover crops as emergency feed without significant delays in planting
- Enhanced natural soil fertility due to improvements in soil
- Less rocks to pick and more opportunity for efficient crop
- Protected soil from high summer temperatures and heavy
Farmers are increasingly adopting no-till management in their cropping systems, and the number of those considering a transition to no-till is fast growing. However, the transition from conventional to no-till may present some challenges. There are several concerns that farmers need addressed before making their final decision:
Q: Is there a crop yield penalty in either the short or long term?
A: UVM Research has shown a slight yield drag when transitioning continuous corn fields to no-till while the soil improves from the cover crop and the reduced soil disturbance. Some dairy farmers in the North- east however have not seen a reduction in yield. UVM research, along with countless farmer experiences, does not show a yield drag when starting no-till corn into hay fields that are terminated in the previous fall with a herbicide. This technique is also a great way to start a crop rotation in fields that have not traditionally been used for corn silage production.
In fact, with extreme changes in weather conditions, including longer period of no or little rain, it is expected that corn grown in no-till system will perform better than those planted conventionally.
Q: Should changes be made to fertility management?
A: The short answer is yes. The following list includes tips and considerations for fertility management in no-till systems:
- Soil pH can be more difficult to The transition to no-till will be best if the soil pH is already in a desirable range.
- Nutrients applied to the soil surface, including lime, may become concentrated in the top Soil testing of the top two inches of soil, as well as the standard six inch depth, may be useful to identify a build-up. If the nutrient concentration test results from the six- inch deep sample are optimum or high, then nutrient accumulation near the soil surface should not be a concern. If the six inch results indicate low or very low nutrient concentrations and/or the two inch depth indicates high concentrations, then injecting phosphorus and potash with the planter or a separate fertilizer injector is recommended.
- Manure cannot be incorporated into soil; if injection is not an option, ammonia nitrogen (potentially up to 50% of the total nitrogen in liquid manure) may be lost to the atmosphere. However, many researchers and farmers believe the benefits of no-till and the use of nitrogen conserving cover crops outweigh the potential nitrogen loss.
- Cover crops capture nitrogen from manure and residual nitrogen from the previous season, thus helping to reduce nitrogen inputs to subsequently planted Even so, most no- till experts recommend applying 30-50 pounds of N per acre as a starter. This would be especially necessary if rye or other winter grain cover crops were terminated at a more mature stage.
Q: Do no-till systems require changes in corn hybrid selection?
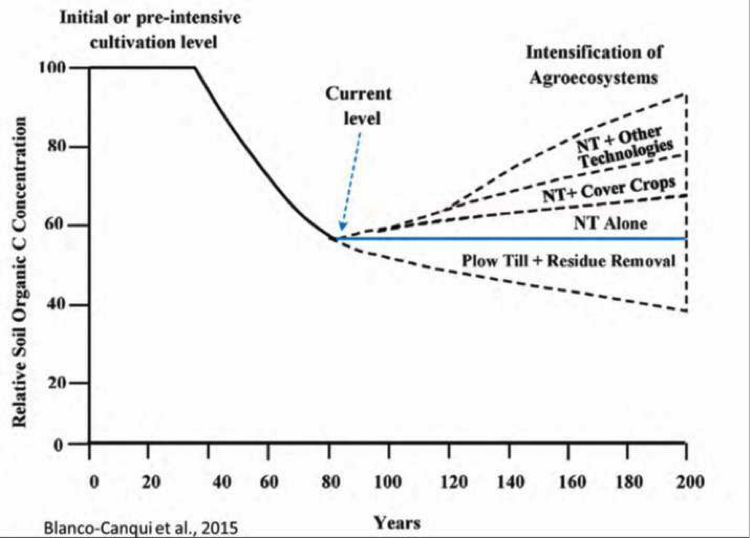
A: No specific corn hybrid has been developed to perform better in no-till system. However, two of the integral parts of no-till corn are weed control and cover crops. Cover crops should be an essential part of no-till corn system. Figure 1 clearly illustrates that no-till systems with cover crops provide much more benefit than adopting no-till management without including cover crops in the rotation. To facilitate cover crop establishment, shorter-season corn hybrids should be selected as they will mature in time to get an effective cover crop established by mid-September.
Earlier maturity hybrids do not necessarily mean lower yields. UMaine, UMass, and UVM corn hybrid trial data has indicated that shorter-season corn does not suffer a significant yield penalty. Proper short-season hybrids can be selected based on their yield and quality performance from annual trials that are published by the above three states.
Q: What is it about cover crops that make them so important for no-till to be successful?
A: Cover crop roots break up compaction and create pores that are used by the following corn crop’s roots. Soil microbes that feed on carbon exuded from the roots, as well as the roots themselves after cover crop termination, produce sticky substances that bind soil particles together into aggregates. Aggregates are the key to allowing your no-till soil to breathe, infiltrate water and withstand heavy equipment. Some farmers have equated cover crops to “driving on geotextile fabric.” The soil microbes are as important as the rumen microbes in a dairy cow.
Q: How different would be weed management compared to conventional corn system?
A: In general, surface-applied pre-plant or pre-emergence herbicides are recommended to control early- emerging weeds, even if glyphosate-tolerant corn hybrids are used. Many no-tillers include the residual herbicide with the cover crop burndown. In general, annual weed pressure is reduced due to the heavy cover crop residue and limited soil disturbance.
Q: Does transitioning to no-till system reduce costs?
A: There are some initial costs to consider when transitioning to a no-till corn system. Some growers have modified their existing planters, while others have purchased new no-till planters. Both can be effective, but the key will still be to get the right seed placement. Some guidelines can be found on some You Tube videos from Vermont: Home-grown No-till Planter and No-Till Planter Clinic.
Some key components are row cleaners, and/or wave coulter in front, proper packing wheels, seed firmer, and closing wheels. Additionally, the double disk openers may need to be replaced more frequently. There are cost savings in reduced plowing and harrowing. Using 2016 Pennsylvania custom rates, producers would save about $35 in acre by simply eliminating plowing and harrowing. In recent studies in Maine and Vermont, producers indicated a cost savings of $50 per acre in fuel and labor.
Adjustments you may want to make for transitioning into no-till:
- The easiest and most successful entry point into no-till corn production is to start with killing a sod crop in the fall and planting into the killed sod crop in the This technique is also a great way to start a crop rotation in fields that have not traditionally been used for corn silage production.
- Get your cover crop planted! Experienced no-tillers recommend cutting small grain rates back to 80-100 per acre, particularly when they can get the cover crop sown early in the fall (Before September 15) and they plan to allow the cover crop to get tall in the spring and do not plan to harvest it. This reduces the volume of material that the planter needs to get through.
- One concern when planting into a cover crop (killed or green) or into a dead sod is seeing your row markers! Some producers use foam markers to make it easier to see where their next pass will Others have purchased GPS monitors.
- Since the potential exists for a more variable seed placement, you may want to increase your seeding rate by about 10% to ensure a projected Keep your corn planter in excellent working condition and adjusted properly and plan to plant slower than you typically do. Make sure to get off the planter and check seed depth, especially when moving to fields with different soil types.
- By choosing shorter- season corn varieties, you are improving your odds of harvesting your crop when weather conditions are favorable, and you will not cause as much compaction or make as many ruts with trucks, tractors and For more Northern states, the earlier harvest will also reduce the risk of running into adverse wet weather conditions at harvest. Think about driving patterns for trucks entering the field to reduce the potential for problems in the future.
- Scout your fields! We have seen the potential for armyworm damage in no-till corn after a winter grain cover Armyworm moths may be attracted to lay their eggs on the cover crop in early spring, and then the larvae will be ready and waiting for the corn! We have also seen the potential for increased slug and snail damage when there is a lot of residual organic matter on the soil surface.
- 7) Don’t rely on a single application of herbicide for weed While many times, the killing of the cover crop may provide you with adequate weed control, we always recommend monitoring fields for weed populations. You may want to spray with some pre-emergence products or come back later with some post emergence products. Just be aware that certain weeds are difficult to control post-emergence (ex. crabgrass) while others are best-controlled post emergence (ex. field bindweed).
Additional resources for reduced tillage and cover crops:
- Soil Health and Nutrient Management, University of Vermont
- Under Cover: Integrating Cover Crops into Silage Corn Systems (PDF), University of Vermont
Deadlines Near for Forage Risk Management Programs in Maine
The sales closing dates for 3 Federal risk management programs is approaching, programs include:
1. Forage Production Crop Insurance.
September 30, 2016 is the final date to purchase Forage Production Crop Insurance for forage seeded in the spring of 2016. Coverage begins on May 22, 2017 on acreage that has an adequate forage stand. To be eligible for this insurance, the stand must be pure alfalfa; alfalfa and perennial grass where 60% or more of the ground cover is alfalfa; or mixed alfalfa and perennial grass where alfalfa makes up more than 25% but less than 60% of the ground cover. Insurance protects against a decline in your Average Production History (APH) yield due to adverse weather conditions including hail, frost, freeze, wind, drought, and excess precipitation; wildlife damage; insect damage and plant disease, except for insufficient or improper application of control measures. Crop insurance premiums are subsidized based on the coverage level selected.
Coverage levels range from 50 to 75% of your APH at 100% of the price election. The price election for the 2017 crop year is $184 per ton. Forage Production Crop Insurance is available in Aroostook and Penobscot counties and is available outside of these counties through a written agreement.
2. Pasture, Rangeland, Forage Pilot Crop Insurance.
November 15, 2016 is the final date to purchase this crop insurance for the 2017 insurance year. This program is a new crop insurance option for Maine producers, providing protection of pasture, hay, and hayland against a single peril, drought. No historical production records are required. Losses are determined by comparing reported precipitation over a 2-month insured period to 50 years of historical rainfall data. Both reported and historical rainfall data are from the National Oceanic and Atmospheric Administration Climate Prediction Center (NOAA CPC).
Crop insurance is sold and delivered solely through private crop insurance agents. A list of crop insurance agents is available online at the RMA Agent Locator. Producers can use the RMA Cost Estimator to get a premium amount estimate of their insurance needs online.
3. Non-insured Crop Disaster Assistance (NAP) for Hay Crops.
September 30, 2016 is the final date to purchase the NAP program for hay. This program protects your APH from natural disasters that results in lower yields or quality. Coverage level options include the catastrophic level and up to 50-65% of your APH at 100% of the average market price. This program is administered and sold by the USDA Farm Service Agency (FSA). Contact your local FSA office to learn more.
The University of Maine Cooperative Extension is in cooperation with the USDA Risk Management Agency to deliver crop insurance education to all Maine farmers. Visit our Risk Management and Crop Insurance Education website. For questions please contact Erin Roche, Crop Insurance Education Program Manager, 495 College Ave., Orono ME, 04473 (949.2490; erin.roche@maine.edu).
Corn Chopping Time!
So how do you decide when to start chopping?
Whole plant dry matter is the key to deciding when to start chopping. With this year’s dry and hot growing season, the corn crop may be ready before you expect! I have seen some pictures of growers who have started on a few fields, especially to start a new pile or bunker so they can feed off of it in a few weeks while the main portion of the crop comes off.
Corn silage harvest should begin when the corn is between 30 and 35% dry matter. This is the optimum dry matter for good fermentation and represents the best quality measurement for decisions around harvest.
One complicating factor has been the drought. If the dry weather continues, it is possible that higher nitrate levels could be an issue. If this occurs, one recommendation is to chop higher as the nitrates accumulate in the bottom stalk. It is hard to make this recommendation as chopping higher, while it improves quality, impacts yield in a year when both the corn yield and the hay yields are down! Before you start feeding, you may want to check the nitrate levels when you do a forage analysis. See Dairy One’s fact sheet: Nitrates and Dairy Cattle (PDF).
There are many ways to check dry matter. Some of the newer choppers have dry matter monitors, making the process very easy! Another is to run some sample plants through your chopper or a chipper and using a microwave to dry the sample and do the calculation. Another option is to use a Koster Tester. I like the Koster tester method because it is quick..but I hate the scale that comes with the unit! I usually use a digital scale to make a better estimate of the moisture content. Remember that 30% dry matter is 70% water!
To determine dry matter:
Weigh an empty container in grams. Weigh the freshly chopped corn in the container and record both weights. Dry the chopped corn down to 0 percent moisture. This can be done one of several ways:
- Overnight in a food dehydrator at 140-150 degrees Fahrenheit.
- In a Koster Moisture Tester, commonly used to test forage moisture (takes about 25-30 minutes)
- In a microwave or oven, being sure to remove the sample every minute or less to prevent scorching. Samples dried in a microwave oven must be watched very closely, every 30-45 seconds, and dried at around 50 percent power to prevent heat buildup in the microwave oven that can damage it.
The Koster tester and microwave methods require constant monitoring, as they will dry the corn relatively quickly. Once the sample has reached a stable weight, the corn is at 0 percent moisture. Weigh the dry corn and container and record the weight in grams.
To calculate the percent dry matter, use the following equation:
Percent dry matter = 100 x (Dry weight – container)/(Green or fresh weight – container)
Maine Hay Directory
Did you know that UMaine Extension manages a hay directory for buyers and sellers of hay and hay products? If you have hay or forage to sell, this listing may help you find buyers! If you are interested in posting your products or looking for feed to buy, check out the directory at the Maine Hay Directory.