Bulletin #2439, Irrigating Potatoes in Maine

Developed by Extension Crops Specialist Peter Sexton, Professor of Agronomy Gregory Porter, and Extension Crops Specialist Steven B. Johnson.
For information about UMaine Extension programs and resources, visit extension.umaine.edu.
Find more of our publications and books at extension.umaine.edu/publications/.
Table of Contents:
- Factors Affecting Soil Water Availability
- Water Use by the Potato Crop
- Understanding drought stress
- Disease Issues
- Irrigation Recommendations
- Monitoring Soil Moisture
- Rotation Issues
- References
- Full Descriptions of Figures
Properly managed irrigation increases yield
Rainfall provides most of the moisture the potato crop in Maine uses through the season. Even so, in most seasons the potato crop in Maine suffers by varying degrees from drought stress. Without supplemental irrigation, yield losses will occur when moisture provided by rainfall and available soil water do not keep pace with crop demand. In trials over many seasons at the Aroostook Research Farm in Presque Isle, plots receiving supplemental irrigation have shown an average yield increase of 49 cwt per acre over non-irrigated plots. Many factors affect both the amount of moisture available in the soil and the rate of water use by the potato crop. Soil water is influenced by soil texture and structure, the percentage of coarse fragments (stones) in the soil, the depth of the soil available for root development, weather patterns, and of course, rainfall. Crop water use is influenced by crop growth stage and by current weather conditions. This bulletin will very briefly review the role of these variables on water use by the potato crop, and provide a set of suggestions for irrigation.
Factors Affecting Soil Water Availability
The amount of water that the soil will hold is largely a function of soil texture. Finely textured soils retain soil moisture better than coarsely textured soils. This is true because as the soil becomes finer, pore size decreases and the increased capillary action of small pores holds more water against drainage. However, in very fine-textured soils (clays), the increased capillary action also increases resistance to water uptake by the plant. This means that although total soil moisture increases as the texture becomes finer, the very fine soils (clays) often do not have any more plant-available water than the silt loams have. Refer to Table 1 below for typical values of available soil moisture for some soils of interest.
Soil structure, or tilth, is another significant factor in soil water availability. Soils with good tilth have better infiltration rates, so there is less water lost as runoff. Soils with good tilth also allow good root development. This means that roots can explore and extract water from greater depths in these soils. In addition, where tilth is good there is better drainage of excess water, so roots and tubers are less likely to suffocate under high moisture conditions. Therefore factors that improve soil tilth, especially high soil organic matter, also tend to improve soil-water relations for crop production.
The percentage of rock or gravel in a given soil also affects soil water retention. For every percent increase in rock or gravel volume, the estimate of soil water availability should be correspondingly decreased. For example, if 20 percent of the soil volume is small rocks, then the estimate of soil water availability should be decreased by 20 percent, as rocks do not retain any significant soil moisture. By way of an example, a typical loam soil which holds 0.17 inches of water per inch of soil with a rooting depth of 18” will hold 3.06 inches of water (0.17 * 18 = 3.06), assuming there are no rocks or stones in the profile. If the soil has a rock fraction of 10 percent, then the available soil moisture would correspondingly be 10 percent less — in this case, 2.75 inches of available moisture (3.06 minus 10 percent).
Water Use by the Potato Crop
The amount of water the crop uses changes over the course of the season. During establishment, when leaf area is small and temperatures are usually cool, water use is relatively low. As the canopy develops and leaf area increases, water use increases accordingly. Water use usually peaks in late July and early August. During this time, days are long with the sun at a relatively high elevation, average temperatures are at their warmest, and the potato crop is fully developed and growing rapidly. Later in the season, as the crop matures and temperatures begin to fall, water use also declines. Table 2 shows estimated average water use by the potato crop in northern Maine over the course of the season. These estimates assume the crop is not stressed and that soil moisture is not limiting water use by the crop.
Understanding drought stress
Temperature, relative humidity, solar radiation (sunlight), and wind speed all significantly affect evaporative demand, and consequently, water use by the potato crop. As air temperature increases, the amount of moisture the air can hold also increases. Between 60ºF and 80ºF, there is about a 3 percent increase in the amount of water the air can hold for every 1ºF increase in air temperature. This means that all else being equal, a 10ºF increase in temperature from 70ºF to 80ºF will increase evaporative demand by 30 percent, while an increase from 60ºF to 90ºF will almost double the rate of crop water use. Therefore, drought stress takes less time to develop, and is more likely to occur, under warm conditions than under cool conditions.
Drought stress develops when the rate of evaporative loss from the crop is greater (or will soon be greater) than the rate of water uptake from the soil. When this occurs, the crop will typically decrease the expansion of new leaves, and then slow down photosynthesis and growth, thus decreasing water usage and conserving water for the future. Essentially the crop begins to shift from a production mode to a survival mode. The decreased photosynthetic rate means less crop growth and lower yield.
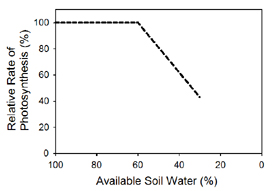
For potatoes, this drought stress threshold is commonly thought to occur at about 60 percent available soil moisture (100 percent being fully charged). Above this level, the crop does not show much response to increased moisture (as long as there is not excess moisture), and below this level growth and water use drop dramatically as soil moisture declines (see Figure 1). From 100 to about 60 percent available moisture represents the optimum range for growth, yield, and quality. A Caribou silt loam soil to a depth of 18 inches, for example, would have 2.95 inches of available water at field capacity — i.e. 100 percent available water, fully charged — (refer to Table 1 above), and 1.77 inches at 60 percent available water. So the crop would have to use up about 1.18 inches of water (2.95 — 1.77) from a fully charged profile before it would begin to go into drought stress.
In August in northern Maine, the average rate of water use by the potato crop is 0.18 inches per day. This means that under average conditions in August, it would take about 6 days for soil to go from a full profile to the beginnings of drought stress. Irrigation of 0.5 inches would provide enough water for about 3 days during this period, and irrigation of 1 inch would provide enough water for about 6 days of growth without stress developing.
The effect of drought stress on yield and quality depends to a large extent on when the stress occurs during the life cycle of the crop. The potato crop is most resistant to drought stress during plant establishment, up to tuber initiation. Irrigation is usually not recommended during this period unless drought stress is severe. Benefits from irrigation during early season growth are limited, while on the other hand, excess water application at this time can favor the development of Rhizoctonia and verticillium, and may decrease root development.
Drought stress during tuber initiation and early tuber development tends to decrease tuber quality in terms of both poorer type and greater sugar concentration. Drought stress at tuber initiation also tends to promote the development of common scab (refer to ”Disease Issues” below). Drought stress during mid-bulking has the greatest effect on total yield. Drought stress during late bulking appears to affect yield less than stress during early or mid bulking.
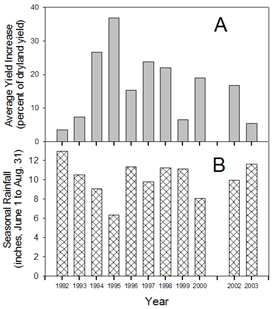
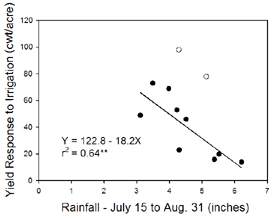
The amount of irrigation water required to avoid drought stress will obviously vary from season to season based on rainfall. In a wet year, no irrigation may be needed, while in a very dry year the crop may take 7 inches of water or more to avoid drought stress. In more typical seasons, irrigators will apply from 2 to 4 inches of water over the course of the season. As shown in Figure 2, response to irrigation at the Aroostook Research Farm, over 10 years varied with rainfall, with some years showing no significant response to irrigation (less than 20 cwt per acre), while strong responses to irrigation (greater than 50 cwt per acre) were evident in years with less rainfall (Figure 3).
Very little research information is available about the way different varieties respond to irrigation in Maine. Earlier-maturing varieties tend to be more sensitive to early and mid-season drought, and less sensitive to late-season drought. Varietal susceptibility to pink rot, leak, hollow heart, and blackheart are also factors to consider in irrigation management.
Irrigation research done at the Aroostook Research Farm shows mixed results from irrigation in terms of tuber quality. Irrigation water applied when it is not needed can decrease marketable yields, and late in the season excess irrigation can lead to the development of disease problems in storage (see Disease Issues below). Also, drought late in the season can increase specific gravity.
On the other hand, second growth, knobs, and growth cracks are often associated with drought stress. It appears that once growth slows or stops due to stress when the stress is relieved, regrowth is often patchy or non-uniform across the tuber resulting in abnormal shapes and poor tuber type. Where it can be managed, a more uniform level of soil moisture provides more even growth which should result in better tuber quality and larger size. However, the larger tuber size associated with irrigation can also be associated with an increased incidence of hollow heart and external defects.
Disease Issues
Soil moisture, and thus irrigation, can strongly affect disease progress in potatoes. Excess moisture early in the season is sometimes associated with Rhizoctonia, as well as powdery scab, and with the occurrence of verticillium later in the season. Also, development of verticillium symptoms is accelerated by drought stress during bulking. Drought stress does not increase infection levels by verticillium, but it decreases the ability of the crop to tolerate the disease. Drought stress during tuber initiation appears to be associated with increased severity of common scab.
Excess soil moisture late in the season makes tubers more prone to infection with pink rot and late blight pathogens (Phytophthora erythroseptica and P. infestans, respectively). Excess moisture makes it easier for mobile spores to move through the soil and find tubers. Excess moisture also causes tuber lenticels to open, which makes it easier for fungi to gain entry to the tuber. These diseases can lead to severe problems in storage. It behooves you to practice extra care, or avoid irrigation entirely, late in the season. This is especially true when late blight is present, and temperatures are cool — these are ideal conditions for late blight to move to tubers with irrigation water. Another factor to consider is the late-season decline in crop water use. This exacerbates the problem of excess moisture because more time is required for the excess water to evaporate.
Thus the potato crop in Maine is less forgiving of excess irrigation late in the season than it is at other periods. Given the potential for rainfall, irrigating potatoes in Maine in September entails significant levels of risk. Give careful consideration to current soil moisture levels, disease pressure, weather forecasts, variety, and potential yield response before undertaking late-season irrigation.
Irrigation Recommendations
The goal of irrigation is to maintain soil moisture level above the point where the crop suffers yield and/or tuber quality loss, without applying excess water. In Maine, rainfall is a factor that also has to be carefully considered. In an ideal system, one would apply just enough water to keep the crop above the stress threshold, while leaving room for the soil to absorb some moisture from unexpected rainfall. This way in the event of a rainstorm, the soil would be less likely to become saturated. However, equipment limitations control how often a given field can be irrigated, and this in turn strongly affects how much water is applied at each irrigation.
If using center pivots, which enable an operator to readily irrigate two or even three times a week, the irrigator only needs to apply enough water for two or three days of crop water use (about 0.5 inches of water) in order to avoid stress. A grower with this equipment can afford to wait longer before irrigating, as a reserve of only a few days moisture use is sufficient to avoid stress in this system. On the other hand, an irrigator using a traveling gun — which may be applying water once every 7 to 10 days in a given field — will want to start irrigating earlier and apply more water per irrigation, because in order to avoid stress this system needs a 7- to a 10-day reserve of moisture. In the traveling gun system, growers typically apply from 0.75 to 1.00 inch (or as much as the soil will accept without having runoff). The downside of this system is two-sided: 1) if there is rainfall after irrigation the soil is more likely to become saturated, and 2) it is more difficult to avoid stress since the irrigator cannot usually get back into the same field more often than once a week. Traveling guns are also more labor-intensive than center pivots, and they tend to pound the soil surface, which can lead to crusting and sealing of fine-textured soils. Users of traveling guns sometimes make the error of waiting too long before starting to irrigate, and then applying too much water.
Suggested irrigation thresholds for center pivot and traveling gun systems are given in Tables 3 and 4, respectively. The units of soil water potential given in the table are a measure of soil dryness. The larger the negative number, the dryer the soil. For example, a value of 0 would be very muddy soil, a value of -10 would be very moist soil, and value of -100 would indicate the soil is relatively dry. The likelihood of significant rainfall is always an issue to consider in deciding when to irrigate in Maine, especially late in the season.
As discussed in the sections above, the potato crop is less sensitive to drought stress during early-season growth, and excess moisture at this time can exacerbate disease problems. During tuber initiation and mid bulking, the crop is most responsive to irrigation. Late in the season, crop water use declines, while the risk of carrying a disease problem into storage greatly increases if excess moisture is present. Therefore, recommended irrigation thresholds are set lower during early-season growth, raised from tuber initiation through mid bulking, and then lowered again during late bulking and maturation.
Monitoring Soil Moisture
There are many ways to monitor soil moisture. The following is a short description of several methods:
- The most common method is the “hand-feel” technique (Table 5). This skill takes experience to develop, but it offers the important advantage of easily sampling multiple areas of a field (the sampling area is not tied to any given spot).
- Another common practice is to use gypsum blocks, or other materials, that vary in electrical resistance as soil moisture varies: resistance increases as the soil, and the sensor in equilibrium with the soil, dries out. These are buried at the desired depth and are read with a meter that estimates soil water potential (another measurement of soil moisture) based on electrical resistance. These types of sensors take a day or two after placement to equilibrate.
- Granular matrix sensors, such as Irrometer Corporation’s Watermark sensor, work on the same principle as gypsum blocks but are more stable over time. There are commercial data loggers available that can be wired to these sensors to record daily soil moisture data automatically over the whole season if desired.
- Time domain reflectometry (TDR) probes offer another way to test soil moisture. These are pushed into the soil and give an immediate readout on soil moisture.
- Tensiometers measure soil water potential based on the tension of water in a ceramic cup in equilibrium with soil water. However, tensiometers will cavitate at about -80 centibars. For this reason, they require more maintenance than other systems.
There are other methods as well. Each method offers its own set of advantages and disadvantages. While the hand-feel method is useful and advantageous for comparing different areas across a field, it is a good idea to use another method as a backup to the hand-feel approach.
Most sensors only measure soil moisture immediately around the sensor, therefore placement is critical for accurate results. Choose a spot that is representative of the largest portion of the field that is being irrigated. Sensors should be placed midway between two evenly spaced hills in the row, to avoid damage during hilling. Take care to follow the manufacturer’s instructions when putting the sensor in the ground. Depth of placement is also important and should reflect rooting depth. For potatoes, effective rooting depth can be assumed to be about 18 to 20 inches. For Watermark sensors, placement at depths of 8 and 16 inches below the hill is recommended. At 8 inches the sensor gives a measure of soil moisture from 4 to 12 inches, and at 16 inches the sensor gives a measure of soil moisture from 12 to 20 inches. Placing two sensors at 8 inches for everyone at 16 inches will weight the average towards the surface soil, which is where the potato crop seems to draw most of its moisture. Having a sensor at 16 inches gives the grower an observation of soil moisture lower in the profile and also helps avoid over-irrigation when subsoil moisture is plentiful.
Variation in soil moisture across the field should be kept in mind when deciding to irrigate. Monitor low or wet areas in the field, as creating saturated conditions in these areas may lead to problems with tuber quality and leave the tubers prone to infection by disease-causing organisms, which can create problems in storage.
Rotation Issues
Oats and barley are the predominant rotation crops for potato production in Maine. Neither crop is economically profitable for irrigation. Therefore, the ability to move your irrigation system so that it will follow your potato crop is an important advantage where it can be gained. Also, given the low value of most rotation crops relative to the large investment in irrigated potatoes, it seems that the rotation crop should be managed to maximize returns on potatoes. In this regard, it may be wise to avoid crops that share soil-borne diseases with potatoes — for instance, soybeans and canola share a white mold with potatoes. It is also a good idea to devote at least a portion of the rotation cycle on the irrigated ground to green manure crops in order to improve soil organic matter and tilth. Increased organic matter will help to lessen problems of excess moisture when there is heavy rainfall following irrigation. Soils with high organic matter have better structure and so also tend to have better internal drainage.
References
Black, R.D., and D.H. Rogers, 1989. Soil water measurements: an aid to irrigation water management, bulletin L-795. Manhattan, KS: Kansas State University Cooperative Extension Service
Ejieji, C.J., and J.W. Gowing. 2000. “A dynamic model for responsive scheduling of potato irrigation based on simulated water-use and yield.” Journal of Agricultural Science 135: 161-171.
Grant, W.J., and E. Epstein. 1962. Physical properties and moisture relationships of some representative Maine soil types, bulletin T2. Orono, ME: Maine Agricultural Experiment Station, University of Maine.
Keller, J., and R.D. Bliesner. 1990. Sprinkle and Trickle Irrigation. Van Nostrand Reinhold, New York.
King, B.A., and J.C. Stark. 1997. Potato irrigation management, bulletin 789. Moscow, ID: University of Idaho College of Agriculture.
Jefferies, R.A., and D.K.L. MacKerron, 1989. “Radiation interception and growth of irrigated and droughted potato (Solanum tuberosum).” Field Crops Res. 22: 101-112.
Porter, G., F. Drummond, E. Groden, D. Lambert, and J. McBurnie. 1995.Soil and water management project final technical report. Orono, ME: Maine Agricultural & Forest Experiment Station, University of Maine.
Rourke, R.V. 1998. Chemical and physical properties of the Mapleton, Monson, Saddleback, and Sisk soil map units. Orono, ME: Maine Agricultural & Forest Experiment Station, University of Maine.
Rourke, R.V., and R. Bangs. 1975. Chemical and physical properties of the Bangor, Dixmont, Caribou, Conant, Perham, and Daigle soil mapping units, technical bulletin 75. Orono, ME: Life Sciences and Agriculture Experiment Station, University of Maine.
Reviewed by Potato Specialist Alvin Mosley of Oregon State University, Associate Professor Thomas Scherer of North Dakota State University, Professional Agronomist Lauchlin Titus, and Agricultural Engineer Keith Roble of the Natural Resources Conservation Service.
Special thanks to Keith LaBrie of LaBrie Farms for many helpful suggestions provided in the development of this fact sheet, and for his cooperation in the on-farm evaluation of soil moisture monitors.
Brand names and trade names are included for educational purposes. No endorsement is implied nor is discrimination intended against similar products or services.
Full Descriptions of Figures
Figure 1: This line graph shows the relative rate of photosynthesis to be 100 percent when available soil water is at 100 percent. The line for photosynthesis rate remains at 100 percent while the available soil water drops down to 60 percent. Below 60 percent available soil water, the line shows the photosynthesis rate dropping roughly to 85 percent at 50 percent soil water, 65 percent at 40 percent soil water, and 45 percent at 30 percent soil water. The line stops at 30 percent available soil water.
Figure 2. A&B: These two stacked bar charts show average yield response to irrigation (as a percent of dryland yield) in chart A, over average seasonal (June 1 through August 31) rainfall in chart B. The following figures are rough, from a visual reading of the chart. In 1992, the seasonal rainfall in inches was 13, and the average yield response to irrigation was 4 percent. In 1993, the seasonal rainfall in inches was 10.5, and the average yield response to irrigation was 8 percent. In 1994, the seasonal rainfall in inches was 9, and the average yield response to irrigation was 26 percent. In 1995, the seasonal rainfall in inches was 6.5, and the average yield response to irrigation was 37 percent. In 1996, the seasonal rainfall in inches was 11.5, and the average yield response to irrigation was 16 percent. In 1997, the seasonal rainfall in inches was 10, and average yield response to irrigation was 23 percent. In 1998, the seasonal rainfall in inches was 11.2, and average yield response to irrigation was 23 percent. In 1999, the seasonal rainfall in inches was 11, and average yield response to irrigation was 7 percent. In 2000, the seasonal rainfall in inches was 8, and average yield response to irrigation was 19 percent. There is no data for 2001. In 2002, the seasonal rainfall in inches was 10, and average yield response to irrigation was 16 percent. In 2003, the seasonal rainfall in inches was 11.8, and average yield response to irrigation was 6 percent.
Figure 3: This is a scatter chart. The x (horizontal) axis shows inches of rainfall from July 15 to August 31 on a scale of 0 to 7. The y (vertical) axis shows yield response to irrigation in cwt/acre on a scale from 0 to 120. Black circles appear at the following x,y coordinates, approximated from a visual reading:
3.1,50
3.4,72
4.0,70
4.2,52
4.3,24
4.5,47
5.4,15
5.5,20
6.2,16
Open circles appear at the following x,y coordinates, approximated from a visual reading:
4.3,100
5.2,80
The following equations appear in the blank area of the chart:
Y = 122.8 – 18.2X
r2 = 0.64**
Information in this publication is provided purely for educational purposes. No responsibility is assumed for any problems associated with the use of products or services mentioned. No endorsement of products or companies is intended, nor is criticism of unnamed products or companies implied.
© 2008
Call 800.287.0274 (in Maine), or 207.581.3188, for information on publications and program offerings from University of Maine Cooperative Extension, or visit extension.umaine.edu.
The University of Maine is an EEO/AA employer, and does not discriminate on the grounds of race, color, religion, sex, sexual orientation, transgender status, gender expression, national origin, citizenship status, age, disability, genetic information or veteran’s status in employment, education, and all other programs and activities. The following person has been designated to handle inquiries regarding non-discrimination policies: Sarah E. Harebo, Director of Equal Opportunity, 101 North Stevens Hall, University of Maine, Orono, ME 04469-5754, 207.581.1226, TTY 711 (Maine Relay System).