Monarch and Milkweed — Looking at the Numbers
Authors: Medea Steinman1, Molly Schauffler2, Esperanza Stancioff1,3, Beth Bisson3
1University of Maine Cooperative Extension
2University of Maine Climate Change Institute and RiSE Center
3Maine Sea Grant
Grade level: 7-12
Themes: Data literacy, monarch-milkweed ecology and conservation
Activity type: Classroom data analysis, species research
Setting: Classroom
Questions
- How can we graph data to compare two groups?
- When did signs of Monarchs and Milkweed first appear in Maine in 2011?
- What would you expect to see first (monarchs or milkweed)?
- Do you think you’d see them first on the coast or inland in Maine?
- How variable is the timing for first sightings of these species?
Overview
Students will work with a small dataset taken from the USA-National Phenology Network database. The data show the timing of observations by Maine volunteers of milkweed plants and monarch butterflies in 2011. The students will learn the proper way to graph data so they can make comparisons between groups: such as monarch vs. milkweed life phases, and coastal vs. inland timing. They will be asked to make predictions based on what they know about the species and about climate conditions. They will also learn to think about and graph variability, an important concept in statistics and data literacy.
Students are encouraged to infer meaning from the graphs, engage in speculation, and learn to articulate and support claims and conclusions. Students’ graphs can be used as a basis for classroom discussion focused on telling stories with data, and exploring new lines of inquiry.
This activity can be used alone or in the context of a larger lesson on the monarch’s connection to milkweed, a well-known insect-plant relationship that has useful applications in ecology and conservation biology.
Education Standards
Next Generation Science Standards
- MS-LS-2. Ecosystems: Interactions, Energy, and Dynamics
- HS-LS-2. Ecosystems: Interactions, Energy, and Dynamics
- HS-LS4. Biological Evolution: Unity and Diversity
Maine Learning Results
Science and Technology
A3 Unifying Themes — Constancy and Change
6-8. Students describe how patterns of change vary in physical, biological, and technological systems.
B1 Skills and Traits of Scientific Inquiry
6-8. Students plan, conduct, analyze data from, and communicate results of investigations, including simple experiments.
E2 The Living Environment — Ecosystems
6-8.Students examine how the characteristics of the physical, non-living (abiotic) environment, the types and behaviors of living (biotic) organisms, and the flow of matter and energy affect organisms and the ecosystem of which they are part.
Mathematics
B. Data Analysis
7. Students use graphs and charts to represent, organize, interpret, and draw inferences from data.
a. Create tables, pictograms, bar graphs, line graphs, pie charts, stem and leaf plots, box and whiskers plots, and histograms using pencil and paper and electronic technologies.
b. Draw conclusions based on graphs and charts including tables, pictograms, bar graphs, line graphs, pie charts, stem and leaf plots, box and whiskers plots, and histograms.
8. Students use the mean, median, mode, range, and quartiles to solve problems involving raw data and information from data displays.
9-Diploma. Students understand and know how to describe distributions and find and use descriptive statistics for a set of data.
a. Find and apply range, quartiles, mean absolute deviation, and standard deviation (using technology) of a set of data.
b. Interpret, give examples of, and describe key differences among different types of distributions: uniform, normal, and skewed.
Learning Objectives
- Students learn how to create graphs showing comparisons between two or more groups
- Students learn to evaluate variability of data
- Students understand that the timing of phenological events can vary
- Students practice making predictions, engaging in inference and speculation, and interpreting information contained in graphs
- Students learn that monarch butterflies are dependent on milkweed for survival because monarch caterpillars feed exclusively on milkweed plants
- Participants learn about climate and ecological principles affecting species, i.e., that the timing of phenological events may vary according to geography, microclimate, or climate change.
Expectations and Misconceptions: It’s important to explain to students that the data they are using in this exercise are limited and only cover one year. It’s a small sample with many gaps and observers began making observations in the field at different times. The data may not accurately reflect the “true” timing of these species’ phenology. This point can be used as a basis for discussing data quality and scientific methods. Students can be invited to talk about how the dataset could be improved to provide a more reliable and accurate picture of monarchs and milkweed in Maine.
Materials
- This lesson plan and dataset
- Pen and paper for drawing graphs
- Optional: laptops with spreadsheet software and internet access
Time Needed
(assumes minimum grade level and experience)
- One or two 40-minute class periods for scaffolding students on the topics of “Julian Days;” monarch and milkweed life stages; and the basic relationship between monarchs and milkweed
[Note: To convert to Julian Days, January 1st = Julian Day 1 and the count goes up from there for a total of 365 Julian Days in a non-Leap Year and 366 days in a Leap Year.]
- One 30-minute class period for discussing how to graph the data and to let students give their predictions and explanations.
- Two 30- to 40-minute class periods for students to hand-draw their graphs and discuss as a group the stories that the graphs tell
Activity Procedure
- See the Resources section below for the scaffolding portions of the curriculum.
- Use the dataset and exercise outlined on the following three pages. (This is the Teacher version. The graphs can be removed to create a student activity sheet.)
When did signs of Monarchs and Milkweeds first appear in Maine in 2011?
Volunteers around Maine have been recording dates for different stages of Monarch butterflies and Milkweed plants. Below are the earliest sightings by observers in a number of different towns in 2011.
| Milkweed leaves | |||
|---|---|---|---|
| Julian Days | City/Town | County | Geography |
| 141 | Bangor | Penobscot | Inland |
| 166 | Eustis | Franklin | Inland |
| 153 | Kingfield | Franklin | Inland |
| 146 | Bristol | Lincoln | Coastal |
| 90 | Camden | Knox | Coastal |
| 141 | Cape Elizabeth | Cumberland | Coastal |
| 260 | Falmouth | Cumberland | Coastal |
| 208 | Portland | Cumberland | Coastal |
| 181 | Waldoboro | Lincoln | Coastal |
| Milkweed flowers | |||
| Julian Days | City/Town | County | Geography |
| 183 | Bangor | Penobscot | Inland |
| 166 | Eustis | Franklin | Inland |
| 196 | Bristol | Lincoln | Coastal |
| 203 | Cape Elizabeth | Cumberland | Coastal |
| 181 | Waldoboro | Lincoln | Coastal |
| Monarch adults | |||
| Julian Days | City/Town | County | Geography |
| 206 | Eustis | Franklin | Inland |
| 221 | Kingfield | Franklin | Inland |
| 164 | Livermore | Androscoggin | Inland |
| 203 | Bristol | Lincoln | Coastal |
| 186 | Cape Elizabeth | Cumberland | Coastal |
| 233 | Cherryfield | Washington | Coastal |
| 216 | Portland | Cumberland | Coastal |
Comparing Groups
The following are suggested lines of inquiry for teachers to explore with their students. We recommend that teachers work with the data first and think about where their students might stumble so that they can be prepared to lead them through the discussion. You may have other questions and activities you would like to add.
We suggest you first broach this as a full class discussion. Then you may wish to break students into small groups to think about this and help each other decide how to go about graphing the data to answer the questions. Remind students to stay focused on the question as they think about the graph.
- If you wanted to compare coastal and inland timing for the different stages of monarchs and milkweed, how would you graph these data?
- What do you think you would see first? Monarch adults, milkweed leaves or milkweed flowers? Why?
- What would you expect to see if you compared coastal and inland Maine? Do you think you would see signs of Monarchs and Milkweed on the coast first or inland first? Why?
Acceptable graphs (by hand or computer):
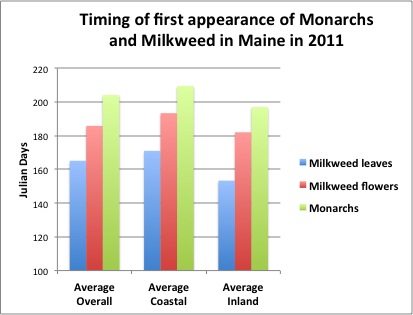
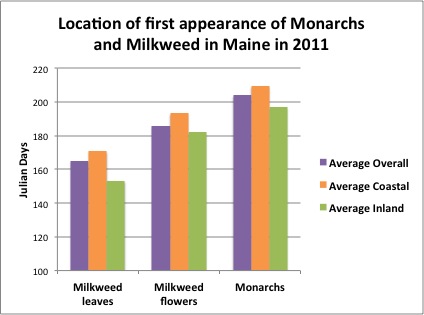
When and where did Monarchs and Milkweed first appear in Maine in 2011?
The graphs can be plotted individually, as follows:
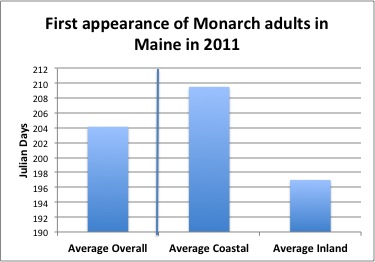
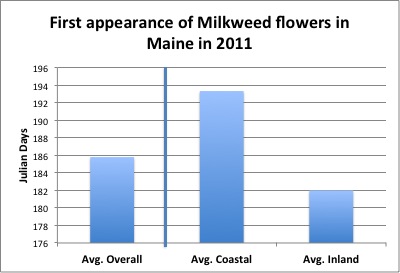
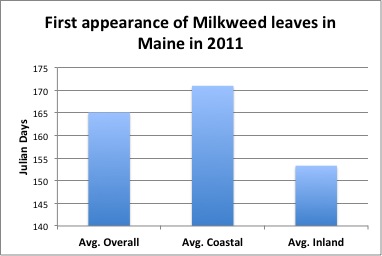
Or combined into one bar graph:
Interpretation of graphs
- How many days, on average, are there between the first coastal and the first inland sightings?
- How different is the timing between the different stages?
- It could be interesting to watch the timing of these stages over the years. Given the evidence for climate change and increasing temperatures in Maine, how would you expect these dates to change over the next 50 years in our state?
Variability
Variability is an important concept in data analysis and in science, yet it is often overlooked or misunderstood by students. For example, one common misconception is that “outliers” should always be disregarded or discarded. Sometimes this is true but not always. This simple data set can be used to help your students think about the inevitable variability that exists among data. Here are two questions about this dataset that can be used to open the discussion and to teach about graphs and plots that can illustrate variability.
- Overall, how variable is the timing for first monarch sightings in Maine in 2011?
- How about for first milkweed leaves or flowers?
The graph illustrating an answer to either of these questions can be accomplished through a frequency plot, such as a box plot or a dot plot. A box or dot plot will display the median value, as well as the high and low values. Excel does not have the capability of plotting these. If you have access to Fathom you can plot as follows (horizontally or vertically).
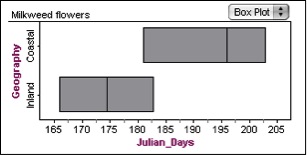
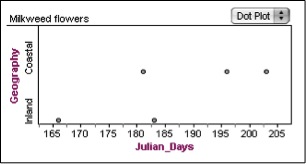
Otherwise they must be graphed by hand (which is fine!). Here are two pictures showing hand drawn examples.


For more information on frequency plots, please visit the Acadia Learning Data Literacy Project website.
Reflection Ideas
Ask students to interpret the graphs and explain what they show. Engage them in speculation about whether the graphs’ assertions might be true or not. Talk about any other questions the graphs raise for you and the students. Point out to them the value of engaging in these kinds of speculations and inquiry and how this process is central to the experience of “doing” science. For any questions that you can’t answer now, how might you find the answers? And if the students agree that the data are not developed enough, ask them how the dataset could be improved. Often, it is essential to come up with recommendations for further research or enquiry.
Extension Ideas
Study the life history and requirements of monarchs and milkweed. Learn about the monarch’s migration and its dependence on milkweed. Visit the library or use the Internet to research the conservation status of monarchs, and of milkweed as monarch habitat. If your school has a garden, consider planting milkweed to create monarch habitat and establish a citizen science monitoring schedule for these two species, based on the Signs of the Seasons observation protocols.
Also visit the USA-National Phenology Website and try out the Phenology Visualization Tool. Here you can download and visualize data, view the map gallery and view historic data sets. We recommend that you complete the Tutorial to learn how to make full use of the visualization features.
Resources
- Signs of the Seasons
- USA National Phenology Network
- Acadia Learning Data Literacy Project
- Monarch Life History and Conservation
- Common Milkweed Life History: USDA NRCS and Missouri Botanical Gardens
For assistance contact:
Esperanza Stancioff, Climate Change Educator
University of Maine Cooperative Extension/Maine Sea Grant
207.832.0343; 1.800.244.2104 (in Maine); esp@maine.edu
Beth Bisson, Assistant Director for Outreach and Education
Maine Sea Grant College Program
207.581.1440; beth.bisson@maine.edu