Winter Wheat Planting Date Trial
Planting Date and Variety Effects on Winter Wheat Performance
Background
Winter grains have many advantages. Planting in the fall frees up time in the spring when wet weather can cause delays, winter grains can take up nitrogen remaining from a prior crop and protect the soil over the winter, and winter grains tend to produce greater yields than their spring counterparts. However, in Northern New England, most crops are not harvested until mid- to late-September and into October, while the ideal seeding window for winter wheat is considered to be mid-September.
This trial was established to investigate whether some winter wheat varieties are more tolerant than others to late planting in the fall.
Research Questions
- Are some winter wheat varieties less sensitive to late fall planting than others?
- Can increasing seeding rates compensate for late planting?
Trial Design and Treatments
Trials were established in Maine and Vermont in 2012 and 2013. The results presented here are for Maine only. Results from Vermont can be found at the UVM Extension Northwest Crops and Soils Program website.
Table 1. Planting date, rate and varieties evaluated in the winter wheat planting date trial, in Maine in 2012 and 2013.
| Winter wheat varieties | Planting dates and seed rates | |
|---|---|---|
| 2012 | 2013 | |
| Arapahoe Maxine AC Morley Redeemer Harvard, 2012 only |
Sept 9 – 32 seeds/sq.ft. Oct 6 – 32 seeds/sq.ft. Oct 18 – 32 and 47 seeds/sq.ft |
Sept 15 – 32 seeds/sq.ft. Sept 24 – 32 seeds/sq.ft. Oct 5 – 32 seeds/sq.ft. Oct 18 – 32 and 47 seeds/sq.ft. Oct 26 – 32 and 47 seeds/sq.ft. |
Table 2. Site and plot management information for the winter wheat planting date trial, in Maine in 2012 and 2013.
| Location | University of Maine Rogers Research Farm, Old Town, ME |
| Soil type | Nicholville very fine sandy loam |
| Previous crop | 2012 trial – clover plowdown; 2013 trial – winter wheat – mustard |
| Tillage operations | Moldboard plow (2012), disc harrow, perfecta harrow |
| Fertility source and rate | Solid dairy manure at 28 tons per acre (available nutrients = 75 lbs N; 130 lbs P2O5; 245 lbs K2O per acre) |
| Row spacing | 6.5 inches |
| Harvest dates | 7/23/2012 |
| Plot size | 6’ x 15’ = 90 ft2 |
Table 3. Monthly precipitation and temperature for Old Town, Maine in 2012 and 2013.
| Month | Total precipitation (in) | 30-year average | Average temperature (°F) | 30-year average | ||
|---|---|---|---|---|---|---|
| 2012 | 2013 | 2012 | 2013 | |||
| Sept of prior year | 1.9 | 8.0 | 3.8 | 61 | 56 | 57 |
| Oct of prior year | 4.3 | 7.0 | 4.0 | 49 | 50 | 46 |
| Nov of prior year | 2.6 | 1.6 | 4.4 | 41 | 33 | 36 |
| March | 2.0 | 2.6 | 4.1 | 36 | 32 | 30 |
| April | 3.7 | 1.9 | 3.8 | 44 | 40 | 42 |
| May | 4.3 | 4.6 | 3.8 | 55 | 53 | 53 |
| June | 6.0 | not avail. | 4.1 | 61 | not avail. | 62 |
| July | 1.0 | not avail. | 3.6 | 68 | not avail. | 68 |
| Total | 25.8 | 31.6 | – | – | ||
Planting Date Results (2012):
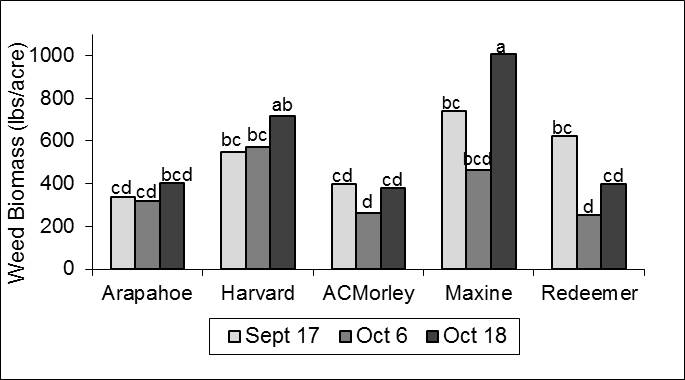
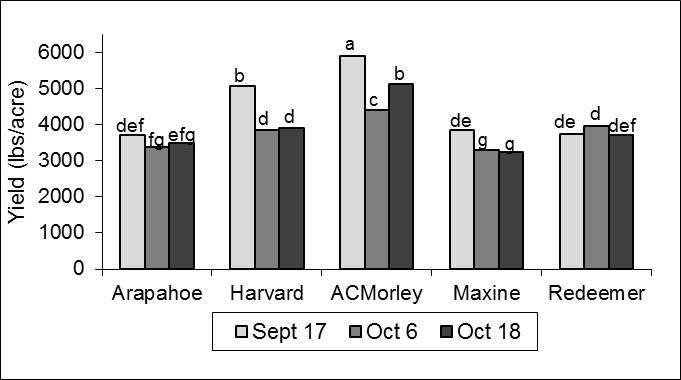
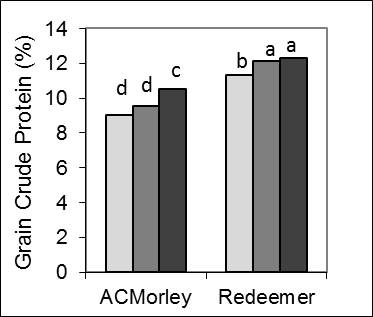
Note: In the graphs, treatments that have a letter in common are not statistically different from each other.
Weed Biomass
- Weed pressure was relatively low in 2012.
- Maxine and Redeemer were the only varieties that showed differences in weed biomass due to planting date.
Grain Yield
- Weather conditions were favorable for winter grains in 2011-2012, which reduced the impact of late planting.
- Arapahoe and Redeemer were unaffected by planting date.
- Grain yields of Harvard, AC Morley, and Maxine were reduced by 24%, 19%, and 14%, respectively, by later planting.
Grain Protein
- Grain protein was measured for ACMorley and Redeemer only
- Grain protein increased with later planting dates but the reason why is unclear. Often protein and yield are negatively related, but that was not the case here.
Other Measures of Winter Wheat Performance
| Variety and date | Plant stand in late fall (#/sq ft) | Plant vigor in early spring (Scored 1-5 with 5=best) |
Flowering date | Plant height (inches) | Spike number | Test weight (lbs/bu) |
|---|---|---|---|---|---|---|
| Arapahoe | ||||||
| Sept 17 | 25 de | 4.6 abc | 7-June b | 37 c | 62 a | 59.3 ab |
| Oct 6 | 29 b | 4.1 de | 9-June c | 34 d | 55 ab | 59.8 ab |
| Oct 16 | 26 cd | 3.4 f | 12-June ef | 34 d | 48 bc | 60.3 ab |
| Harvard | ||||||
| Sept 17 | 20 gh | 4.5 bcd | 5-June a | 38 c | 47 bc | 61.7 a |
| Oct 6 | 15 i | 3.0 fd | 10-June d | 34 d | 35 ef | 61.3 ab |
| Oct 16 | 14 i | 2.1 h | 12-June ef | 33 d | 35 ef | 54.4 c |
| AC Morley | ||||||
| Sept 17 | 21 fg | 4.6 abc | 7-June b | 48 a | 56 ab | 61.2 ab |
| Oct 6 | 23 efg | 3.4 f | 10-June d | 43 b | 48 b | 61.3 ab |
| Oct 16 | 18 h | 2.5 gh | 13-June f | 44 b | 39 cde | 59.0 b |
| Maxine | ||||||
| Sept 17 | 23 ef | 5.0 a | 6-June a | 34 d | 42 bcde | 60.2 ab |
| Oct 6 | 28 bc | 4.3 cde | 10-June d | 32 e | 36 e | 60.7 ab |
| Oct 16 | 28 bc | 3.9 e | 11-June ef | 30 e | 28 f | 60.6 b |
| Redeemer | ||||||
| Sept 17 | 26 cd | 4.6 abc | 7-June b | 38 c | 47 bc | 61.4 ab |
| Oct 6 | 32 a | 4.8 ab | 10-June d | 38 c | 46 bcd | 61.9 a |
| Oct 16 | 31 a | 4.1 de | 11-June ef | 38 c | 38 de | 61.8 a |
Seeding Rate Results (2012):
- Increasing the seeding rate reduced weed biomass for all varieties, by an average of 21%
- BUT increasing seeding rate had no effect on grain yields or protein