Bulletin #2279, Using Wood Ash on Your Farm

Bulletin #2279, Using Wood Ash on Your Farm (PDF)
Developed by Timothy S. Griffin, Sustainable Agriculture Specialist.
For information about UMaine Extension programs and resources, visit extension.umaine.edu.
Find more of our publications and books at extension.umaine.edu/publications/.
Table of Contents:
- Nutrients in Wood Ash
- Wood Ash as a Liming Agent
- Table 1. Calcium carbonate equivalents (CCEs) for six Maine wood ashes
- Potassium and Phosphorus in Wood Ash
- Table 2. Available phosphorus (P) and potassium (K) in Maine wood ashes
- Should You Use Wood Ash?
- References
- Appendix Tables 1 and 2
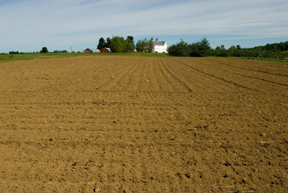
Pulp and paper companies in Maine often burn wood, bark or paper-mill sludge to make electricity. Every year, more than 300,000 tons of wood ash is produced in this way. One way to dispose of this wood ash is to put it in a landfill. However, landfill space is becoming scarce and costly. That’s why other methods of ash disposal have been developed. One method that has become common in Maine is to spread the ash on fields. People have used ash as a low-grade fertilizer and liming agent for a long time.
Up to 70,000 tons of wood ash is spread on farmland every year in Maine. This figure will probably continue to increase. It is important that farmers and communities know the benefits and the problems of using wood ash. This fact sheet covers research on
- nutrients in wood ash,
- the effect of wood ash on soil nutrient levels, and
- the effect of wood ash on plant growth.
Much of the research summarized in this fact sheet was conducted through the Maine Agricultural and Forest Experiment Station.
Nutrients in Wood Ash
You know what wood ash looks like. It’s a fine black material, like the ash left in a wood-burning stove or after a campfire. But what is wood ash made of?
Calcium is the most abundant nutrient, averaging almost 20 percent of the ash. (As we will see later, this means that ash can be used to raise soil pH, just as agricultural lime is used.) If you applied five tons of ash per acre, you would be applying about one ton of calcium. Compared to calcium, other nutrients are present in much smaller amounts. Wood ash is about four percent potassium, and less than two percent phosphorus, magnesium, aluminum, and sodium. The small amounts of these nutrients is the reason that ash is considered a “low grade” fertilizer. In terms of commercial fertilizer, average wood ash would be about 0-1-3 (N-P-K).
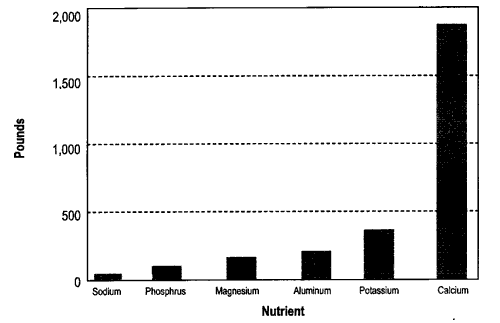
Figure 1 shows the average amount of calcium, potassium, phosphorus, magnesium, aluminum, and sodium in wood ash. These average amounts are from 12 different wood ashes—six produced in Maine and six produced in other states.
Other nutrients are present in wood ash in much smaller amounts. Some of these nutrients, like boron, copper, molybdenum, sulfur, and zinc, are needed in trace amounts by plants. Wood ash may also contain heavy metals. These metals are of concern because they may cause health problems for humans, livestock or wildlife. Both micronutrient and heavy metal concentration in wood ash are usually measured in parts per million (ppm). In other words, the number of pounds contained in every million pounds (or 500 tons) of ash.
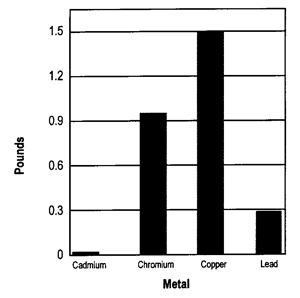
Figure 2 provides an example of the heavy metal content of wood ash. As Figure 2 indicates, applying five tons of ash adds less than two pounds of these elements. If concentrations of cadmium, chromium, or lead are too high, you may not be able to use wood ash.
Wood Ash as a Liming Agent
Wood ash is commonly used as a liming agent because of its high calcium content. Liming agents are used to increase soil pH (pH is a measure of how acid soil is). Soils in the Northeast are naturally acid. Soil pH of 4.5 to 6.0 is common. A soil pH of 7.0 is neutral. Most plants prefer soil pH between 6 and 7 (although potatoes and blueberries prefer lower soil pH).
There are several ways to estimate the liming of wood ash. Lab measurements can be taken (by boiling the ash in acid) to find out the calcium carbonate equivalent (CCE). The CCE tells you how well the wood ash would raise soil pH compared to lime (calcium carbonate). Like the wood ash nutrients discussed above, there are big differences in wood ash CCEs. When CCE was determined in the lab, it ranged from 25 to 59 percent. This is shown in Table 1. This means that if you added the same amount of lime and wood ash, the wood ash should be 25 to 59 percent as effective in raising soil pH.
Wood ash CCE can also be determined in the lab by mixing the ash with soil and measuring the change in soil pH over time. Then this is compared to soil pH after adding lime. These figures are also shown in Table 1, in the column “CCE (incubation).”
You will notice that, in most cases, the CCE determined with this method is lower than the other lab method. Using this method, wood ash CCE ranged from 14 to 56 percent. Again, remember that there are big differences in how well wood ashes increase soil pH.
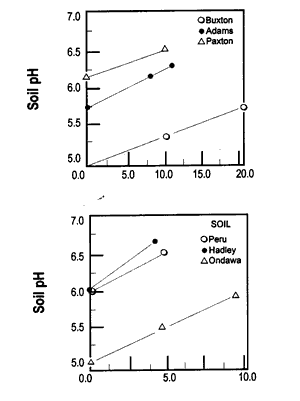
Let’s look at what happens to soil pH when wood ash is applied. Figure 3 shows how soil pH increases as wood ash rate increases. This relationship between soil pH and ash rate is linear. This means that twice as much ash raises the soil pH twice as much.
In Maine, top-dressed applications of wood ash are usually limited to two tons of lime equivalent per acre. If the ash is tilled in, the limit is set at three tons per acre. The actual ash applied may range from about three to eight tons of dry ash per acre, depending on the CCE. The amount of moisture in the ash also affects the application rate. Water is commonly added to the ash at the power plant to cut down on dust. The more water in the ash, the higher the application rate on an “as is” basis.
Potassium and Phosphorus in Wood Ash
Plants remove large amounts of phosphorus (P) and potassium (K) from the soil. One ton of alfalfa hay contains about six pounds of P (14 pounds of P2O5) and 48 pounds of K (56 pounds of K2O). Corn silage yielding 15 tons per acre removes about 50 pounds of P2O5 and 120 pounds of K2O. Over time, P and K must be added to the soil to maintain crop yields. How good is wood ash in meeting crop needs?
There is a difference between the total and available P and K in wood ash. Three different methods are used to estimate how much of these nutrients are available:
- A standard fertilizer test procedure, which extracts nutrients from the ash in an ammonium citrate solution, treating the ash the same as a commercially available fertilizer
- The Maine Soil Test extraction, which measures changes in the amount of available P and K in the soil after ash application, using ammonium acetate
- Measurement of differences in plant uptake of P and K after ash application
We use methods 1 and 2 in research because we want to know quickly what nutrients are available from the ash. However, it is important to compare these laboratory methods with method 3.
The percentage of P and K that is available using methods 1 and 2 is shown in Table 2. From table 2, you can see that wood ash P and K are not completely available to the crop. If wood ash containing 100 pounds of P and 100 pounds of K were applied, soil tests results would increase only about five pounds for P and 40 pounds for K. Again, there are differences between the ash samples. Availability of these nutrients, especially P, is affected by the ash itself, the pH of the soil, and the nutrient level in the soil before you apply ash.
Plant uptake of P and K following wood ash application has been measured in greenhouse studies. The relationship of the soil test procedure and plant uptake is usually linear or straight-line. This relationship is important. It is the first step in being able to predict crop response to nutrients in wood ash.
Should You Use Wood Ash?
Wood ash can be useful in increasing soil pH and supplying plant nutrients. However, you must follow certain procedures before (and possibly after) each ash application. Wood ash applications are currently regulated by the Maine Department of Environmental Protection (DEP). The current regulations are available from the Maine DEP. Being certified for ash application may require soil test results, a location map, and ash nutrient analysis. The amount of ash that you can apply varies by field. It depends on CCEs, potassium content of soil and soil pH.
Although ash is often mixed with water (“conditioned”) before leaving the power plant, it can dry out after being stored in the field. Be careful when you handle any dusty soil amendment (like ash, lime or dry fertilizer). Avoid inhaling the dust and avoid spreading on windy days. Ash can also cause skin and eye irritation. Wear protective clothing (gloves, long-sleeve shirt) and safety glasses if skin contact is likely. Use common sense when handling ash.
References
Campbell, A.G. “Recycling and disposing of wood ash.” Tappi Journal, 73 (1990): 141–146.
Erich, M.S. “Agronomic effectiveness of wood ash as a source of phosphorus and potassium.” Journal of Environmental Quality 20 (1991): 576–581.
Ohno, T., and M.S. Erich. “Effect of wood ash application on soil pH and soil test nutrient levels.” Agriculture, Ecosystems, and Environment 32 (1990): 223–239.
Ohno, T., and M.S. Erich. “Incubation-derived calcium carbonate equivalence of papermill boiler ashes derived from sludge and wood sources.” Environmental Pollution 79 (1993): 175–180.
| Sample # | Ba | B | Cd | Cr | Cu | Pb | Mo | Ni | Se | S | Zn |
|---|---|---|---|---|---|---|---|---|---|---|---|
| 1 | 549 | — | <1.0 | 103 | 151 | 32 | 61 | 65 | 183 | — | 423 |
| 2 | — | 8 | 26 | 92 | 140 | 127 | 123 | 50 | — | 4354 | 692 |
| 3 | — | 127 | 3 | 14 | 78 | 66 | — | 12 | <1.0 | 6800 | 794 |
| 4 | — | — | 4.2 | 9.1 | 40 | 38 | — | 12 | — | — | 200 |
| 5 | — | — | 7.9 | 21.1 | 90 | 72 | — | 49 | — | — | 381 |
| 6 | 910 | 55 | 4.4 | 27 | 120 | 59 | — | 47 | 11 | — | 370 |
| 7 | 0.5 | 290 | 16 | 25 | 70 | 70 | 3 | 50 | — | — | 560 |
| lb/acre in #1 in 5 tons of ash | 5.54 | — | <0.01 | 1 | 1.5 | 0.3 | 0.6 | 0.65 | 1.8 | — | 4.2 |
| From Ohno and Erich 1993. Average of four ash samples from the same Maine location. Ashes 2 through 7 from Campbell 1990. | |||||||||||
Information in this publication is provided purely for educational purposes. No responsibility is assumed for any problems associated with the use of products or services mentioned. No endorsement of products or companies is intended, nor is criticism of unnamed products or companies implied.
© 1993, 2004, 2006
Call 800.287.0274 (in Maine), or 207.581.3188, for information on publications and program offerings from University of Maine Cooperative Extension, or visit extension.umaine.edu.
In complying with the letter and spirit of applicable laws and pursuing its own goals of diversity, the University of Maine System does not discriminate on the grounds of race, color, religion, sex, sexual orientation, transgender status, gender, gender identity or expression, ethnicity, national origin, citizenship status, familial status, ancestry, age, disability physical or mental, genetic information, or veterans or military status in employment, education, and all other programs and activities. The University provides reasonable accommodations to qualified individuals with disabilities upon request. The following person has been designated to handle inquiries regarding non-discrimination policies: Director of Institutional Equity and Title IX Services, 5713 Chadbourne Hall, Room 412, University of Maine, Orono, ME 04469-5713, 207.581.1226, TTY 711 (Maine Relay System).