Bulletin #1160, Why Consumers Buy — and Don’t Buy — Your Farm Direct Products
Bulletin #1160, Why Consumers Buy — and Don’t Buy — Your Farm Direct Products (PDF)
Developed by Donna Lamb, Associate Professor, University of Maine Cooperative Extension; Hsiang-Tai Cheng, Associate Professor, University of Maine Department of Resource Economics and Policy; and Lili Dang, Graduate Student, University of Maine Department of Resource Economics and Policy.
For information about UMaine Extension programs and resources, visit extension.umaine.edu.
Find more of our publications and books at extension.umaine.edu/publications/.
Table of Contents:
- Introduction: The Maine Highlands Consumer Survey
- Chart Gallery
- How Consumers Discover and Access Farm Direct Outlets
- Consumer Expenditures and Product Choices
- Factors in Consumers’ Retail Outlet Choices
- Summary
- Chart Gallery Full Descriptions
Introduction: The Maine Highlands Consumer Survey
In 2003 we conducted a consumer survey to assess direct marketing opportunities and barriers for farmers in the Maine Highlands region (Piscataquis and Penobscot Counties). The survey addressed five direct marketing methods: farm stand, pick-your-own (PYO), tailgate market, home delivery, and farmers market. Our questionnaire was designed to determine whether the current outlets of farm products satisfy consumer needs, and to identify potential areas of direct marketing of farm products that can better serve the needs of consumers.
The questionnaire covered three major themes:
- Consumer behaviors in finding and accessing farm direct outlets
- Consumer considerations when choosing fresh produce and retail outlets
- Consumer willingness to buy fresh farm products directly from local farmers
We surveyed both a rural and urban market area. Piscataquis County and adjacent small towns were the rural market area; Bangor and adjacent cites were the urban market area. Questionnaires were mailed to 2,000 randomly selected residents living in each of the two market areas in July and August of 2003.
Chart Gallery
- Click on the chart caption to enlarge its view into a downloadable PDF.
- Full descriptions of charts may be found at the bottom of the page: Chart Gallery Full Descriptions or by clicking on the chart caption’s ‘Full Description’ link.
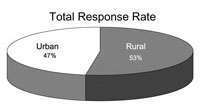
Chart 1 Full Description, Below

Chart 2 Full Description, Below

Chart 3 Full Description, Below

Chart 4 Full Description, Below

Chart 5 Full Description, Below

Chart 6 Full Description, Below
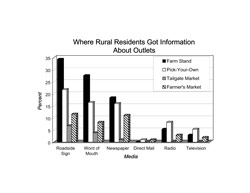
Chart 7a Full Description, Below
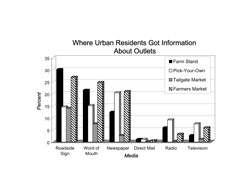
Chart 7b Full Description, Below
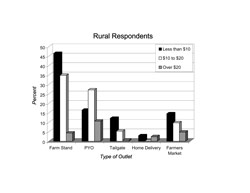
Chart 8a Full Description, Below
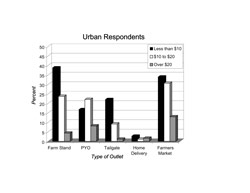
Chart 8b Full Description, Below
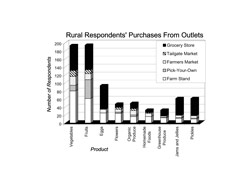
Chart 9a Full Description, Below
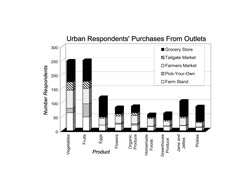
Chart 9b Full Description, Below
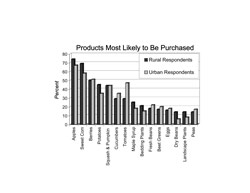
Chart 10 Full Description, Below
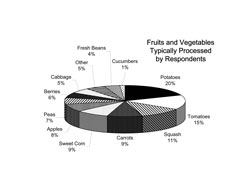
Chart 11 Full Description, Below
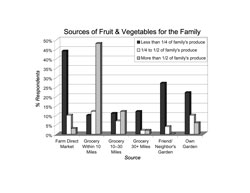
Chart 12a Full Description, Below
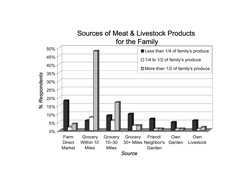
Chart 12b Full Description, Below
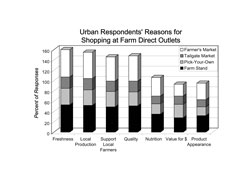
Chart 13 Full Description, Below
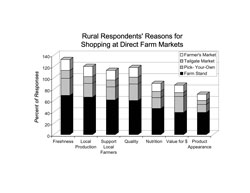
Chart 14 Full Description, Below
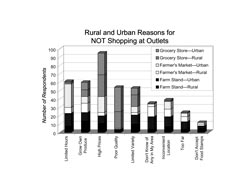
Chart 15 Full Description, Below
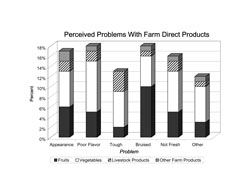
Chart 16 Full Description, Below
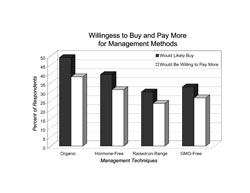
Chart 17 Full Description, Below
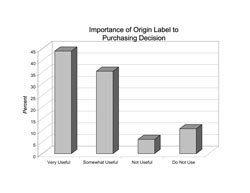
Chart 18 Full Description, Below
Response Rate
A total of 393 completed surveys were returned for the two market areas, representing an overall 9.8 percent response rate. The percentage of responses from the rural and urban respondents is displayed in Chart 1.
Household Demographics
Chart 2 illustrates the age distribution of respondents’ household members. The 207 rural respondents reported a total of 471 members in the household, for an average of 2.3 people per household, while the 186 urban respondents reported a total of 404 members in the household, for an average of 2.2 people per household.
Six percent of respondents indicated that someone in their household was participating in the Maine Senior Farm Share program. Two percent of respondents answered that someone in their household was participating in the Maine WIC (Women, Infants, and Children’s Nutrition) program.
How Consumers Discover and Access Farm Direct Outlets
Awareness of and Access to Farm Direct Outlets
Reported awareness of and accessibility to direct farm market outlets differed between rural and urban residents. Our survey found that the majority of rural residents had relatively more knowledge of and access to farm stands and PYO operations, whereas farmers markets were accessible to more urban residents. Tailgate market and home delivery were less available to most of the rural and urban residents.1
The average numbers of easily accessible grocery stores were three for urban respondents and two for rural respondents, as seen in Chart 3. Over 86 percent of urban respondents and 80 percent of rural respondents reported having easy access to grocery stores.
Only about 45 percent of the urban respondents reported easy access to PYO outlets, while 63 percent of rural respondents knew of PYO outlets, as seen in Chart 4. With regard to farmers markets, 81 percent of urban respondents and 31 percent of rural respondents had knowledge of farmers markets.
Chart 5 presents the average distances from respondents’ homes to the different market outlets they patronized. Rural respondents traveled greater distances than urban respondents to frequent farm stands, tailgate markets, farmers markets, and grocery stores. Urban respondents reported traveling a greater distance than rural respondents to PYO operations.
Chart 6 shows the distribution of shoppers by the number of miles they were willing to travel to farm direct market outlets. There were proportionally more rural residents who were willing to travel farther distances than urban shoppers. Over 45 percent of the rural respondents were willing to travel more than 10 miles to shop at farm direct markets, whereas only 22 percent of the urban respondents reported a willingness to do so.
Discovering Farm Direct Outlets
Respondents were asked to indicate the media through which they got information about farm direct outlets in their area. Charts 7a and 7b show, as percentages, the relative effectiveness of media sources as reported by respondents in this survey.
The information that rural and urban respondents received about farmers markets came chiefly from roadside signs, newspapers, and word of mouth. Rural respondents reported that these three sources accounted for 80 percent of the information they received about farmers markets. Urban respondents reported that these three sources accounted for 64 percent of their information about farmers markets.
The information on PYO operations that the rural respondents received came primarily from roadside signs, which accounted for 22 percent of the information, followed by newspapers and word of mouth. Urban respondents learned about PYO mainly from newspapers (20 percent), followed by roadside signs and word of mouth.
The information on tailgate markets that the respondents received came chiefly from roadside signs and word of mouth. The most frequently checked source of information for home delivery was “don’t know of any,” implying limited home delivery service in the area surveyed.
Implications and Suggestions for Farm Direct Marketers
- Roadside signs are an important source of information about farm direct markets for all consumers.
- Newspapers are another key factor in consumer patronage of farm direct markets.
- Urban residents are more familiar with farmers markets.
- Rural residents are more familiar with farm stands and PYO operations.
- Rural residents generally travel farther than urban residents to patronize direct farm markets. Most rural consumers are willing to travel up to 10 miles to buy from direct farm markets. Urban consumers generally travel less than five miles to farm stand, tailgate, or farmers markets.
Word of mouth significantly influences consumers. Farms should consider strategies to cultivate word-of-mouth marketing.
Consumer Expenditures and Product Choices
How Much Do People Spend at Direct Farm Markets?
Charts 8a and 8b show average expenditures per visit to farm market outlets by rural and urban respondents. The bars display percentages of respondents typically spending less than $10, between $10 and $20, and more than $20 at different types of outlets. You can see that the largest percentages of respondents spent less than $10 at all outlets except pick-your-own (PYO). Urban shoppers tended to make larger purchases than rural shoppers at farmers markets, and smaller purchases at farm stands. Very few people reported using home delivery.
Seasonal Spending Differences
Table 1 displays the average weekly family expenditure on food during the growing season, and during the rest of the year. Fruit and vegetable purchases increased for the middle-spending group ($10 to $20 per week) during the growing season. Meat purchases increased for the low-spending group (up to $10 per week) during the growing season and decreased for the high-spending group (over $20).
|
Fruits and vegetables
|
Meat
|
Livestock products
|
||||||||
|---|---|---|---|---|---|---|---|---|---|---|
|
Per week |
Up to $10 | $10 to $20 | Over $20 | Up to $10 | $10 to $20 | Over $20 | Up to $10 | $10 to $20 | Over $20 | |
|
During growing season |
20% | 35% | 36% | 16% | 31% | 31% | 23% | 16% | 13% | |
|
During the rest of the year |
20% | 27% | 37% | 14% | 31% | 34% | 21% | 14% | 12% | |
Full Table 1 Description: Family average weekly expenditure on food. During the growing season (June to October) 20% of respondents spent up to $10 per week on fruits & vegetables, 35% spent $10 to $20 per week and 36% spent over $20 per week. 16% spent up to $10 per week on meat, 31% spent $10 to $20 and 31% spent over $20. 23% spent up to $10 on other livestock products, 16% spent $10 to $20, and 13% spent over $20. During the rest of the year (November to May) 20% of respondents spent up to $10 per week on fruits & vegetables, 27% spent $10 to $20 per week and 37% spent over $20 per week. 14% spent up to $10 per week on meat, 31% spent $10 to $20 and 34% spent over $20. 21% spent up to $10 on other livestock products, 14% spent $10 to $20, and 12% spent over $20.
Where Do Respondents Buy Particular Products?
Chart 9a shows where rural respondents would be likely to buy particular food products, while Chart 9b shows the same information for urban respondents.
Fruits and Vegetables
- Fruits and vegetables had the largest percentage of all market types.
- Rural respondents were more likely to buy vegetables from farm stands than grocery stores. However, they were more likely to buy fruit from grocery stores, followed by farm stands and PYO operations.
- Urban respondents were more likely to buy fruits and vegetables from grocery stores, followed by farmers markets and farm stands. Farmers markets attracted more urban than rural respondents for the purchase of fruits and vegetables.
- Both urban and rural respondents tended to use PYO for fruit rather than vegetable purchases.
Organic Produce
- Rural respondents bought organic produce primarily from farm stands, followed by grocery stores. Urban respondents bought organic produce primarily from farmers markets, followed by grocery stores, and then farm stands.
Flowers
- Respondents bought flowers in most markets, with the most-used outlets being farm stands, grocery stores, and farmers markets. Urban respondents are more likely to buy flowers from farmers markets and grocery stores. Rural respondents are more likely to buy them from farm stands.
Cheese, Butter, and Eggs
- Our survey group bought cheese, butter, and eggs chiefly from grocery stores, followed by farmers markets and farm stands. Eggs follow vegetables and fruits as the type of item purchased most often.
Homemade Foods
- Respondents bought homemade foods primarily from farmers markets and farm stands. Urban respondents are more likely than rural respondents to prefer farmers markets for homemade foods.
Top Foods Purchased
Chart 10 displays the products most likely to be purchased directly from farmers by rural and urban shoppers. Top products purchased by all respondents were apples, sweet corn, berries, squash and pumpkins, potatoes, tomatoes, and cucumbers. More urban than rural respondents bought tomatoes.
A small number of respondents indicated that they bought the following products directly from farmers: bison, chevon (goat), jerky, ready-to-eat meals, and wool.
An Unexpected Finding: Home Food Processing
About half (49.9 percent) of our respondents indicated that they process food products in bulk for winter by storing, canning, or freezing. This surprising finding suggests resurging interest in home food preservation by all shoppers, not just those who home garden.
Chart 11 shows the relative amounts of fruits and vegetables typically processed by our survey group. Respondents more often processed or stored potatoes, tomatoes, carrots, sweet corn, and apples.
Grocery Stores Claim the Bulk of Food Purchases
Charts 12a and 12b show which outlets claimed what share of our survey group’s business for annual produce and meat purchases.
The majority of respondents bought most of their food from grocery stores within 10 miles of their home. After nearby grocery stores, folks turned to farm direct markets to complete their family food purchases, followed by their own gardens, and friends’ or neighbors’ gardens. More distant grocery stores distant were used to a lesser extent.
Implications and Suggestions for Farm Direct Marketers
- Urban shoppers are more likely to spend over $10 at each visit to a farmers market, while rural shoppers are more likely to spend over $10 at each visit to a farm stand.
- Offer a variety of vegetables and fruits for consumers to buy.
- Consider adding eggs, flowers, and organic produce.
- Increase promotion of PYO activities to rural residents.
- Include apples, sweet corn, berries, potatoes, pumpkins, squash, cucumbers, and tomatoes among your basic farm offerings.
- Offer bulk quantities of potatoes, tomatoes, squash, carrots, and sweet corn for home food processors.
- Don’t fear home vegetable gardens; they contributed to less than a quarter of family produce needs, and only in a small number of families. Most produce was purchased within 10 miles of home at grocery stores or farm direct markets.
Factors in Consumers’ Retail Outlet Choices
Why Consumers Patronize Particular Outlets
Urban Respondents
Farm Direct Outlets: Chart 13 displays the reasons reported by the urban respondents for shopping at each market outlet. The top reasons given were
- freshness (53 percent),
- local production (51 percent),
- quality (49 percent), and
- support for local farmers (47 percent).
Nutrition, the appearance of products, and selection followed the top reasons that respondents shopped at direct farm markets.
Grocery Stores: The top reasons that urban respondents shopped at grocery stores included
- convenience (82 percent),
- selection (62 percent),
- volume (48 percent),
- value for money (44 percent),
- the appearance of products (35 percent), and
- quality (32 percent).
Rural Respondents
Farm Direct Outlets: Chart 14 shows the reasons reported by the rural respondents for shopping at each market outlet. The top reasons given were
- freshness (69 percent),
- local production (66 percent),
- support for local farmers (61 percent), and
- quality (60 percent).
Nutrition, value for money, the appearance of products, and convenience followed the top reasons that rural respondents shopped at direct farm outlets.
Grocery Stores: The top reasons that rural respondents shop at grocery stores included
- convenience (69 percent),
- selection (55 percent),
- volume (33 percent),
- value for money (30 percent),
- quality (22 percent),
- precut/packaged produce (22 percent), and
- the appearance of products (21 percent).
Freshness and local production were the main reported reasons that rural and urban respondents shopped at both farmers markets and farm stands. Farm stand shoppers weighed support for local farmers market patrons ranked quality slightly above support for farmers. The top reasons given by all respondents for shopping at PYO operations were freshness, quality, local production, value for the money, and support for local farmers. The top reasons given by all respondents for shopping at tailgate markets were freshness, local production, quality, and support for local farmers. Convenience was the top reason given for shopping by home deliver but by only four percent of respondents. The primary reason for shopping at grocery stores given by all respondents was convenience, (75 percent), followed by volume, and value for money.
Why Consumers DON’T Patronize Particular Outlets
The survey respondents were asked to identify the reasons they avoided or were disappointed with given outlets. Major complaints about each type of market outlet by urban and rural survey groups are presented in Chart 15.
Few urban or rural respondents identified reasons for dissatisfaction with PYO and tailgate markets since a relatively low proportion of respondents had access to these markets. The proportion of respondents who participated in home delivery was even lower; hence information about home delivery was excluded in the charts.
The biggest complaints overall were high prices and poor product quality at grocery stores, and limited hours at farmers markets and farm stands. High prices were also a complaint about farmers’ markets and farm stands, but not as frequently as for grocery stores.
Urban respondents were more concerned with limited hours and higher prices than rural respondents. Rural respondents were more likely to cite having a garden as a reason NOT to shop at outlets.
Problems With Farm Direct Products
Chart 16 displays respondents’ complaints about the types of farm direct products. The chief problem cited for fruit was “bruised”; the most frequently reported objections to vegetables were “poor flavor” and “not fresh”; the top complaint about livestock products was “tough.”
Preferred Shopping Times
Table 2 displays respondents’ preferred shopping days and times. Most (59 percent) respondents had no preferred shopping days. People who had preferred shopping times generally preferred daytime to nighttime.
|
Weekdays
|
Weekends
|
No Preferred Day
|
Morning
|
Afternoon
|
Evenings
|
No Preferred Time
|
|
|---|---|---|---|---|---|---|---|
| Rural |
22%
|
27%
|
56%
|
33%
|
31%
|
18%
|
42%
|
| Urban |
18%
|
18%
|
62%
|
34%
|
36%
|
25%
|
28%
|
| * Note that some respondents indicated more than one preferred time | |||||||
Full Table 2 Description: Time Preferred for shopping. Note that some respondents indicated more than one preferred time. Weekdays were preferred by 22% rural and 18% urban respondents.
Weekends were preferred by 27% rural and 18% urban respondents. No preferred day was indicated by 56% rural and 62% urban respondents. Mornings were preferred by 33% rural and 34% urban respondents. Afternoons were preferred by 31% rural and 36% urban respondents. Evenings were preferred by 18% rural and 25% urban respondents. No preferred time of day was indicated by 42% rural and 28% urban respondents.
How Respondents Rate Production Methods and Origin Labels
Organic, Hormone-Free, GMO-Free, and Raised-on-Range Food
Chart 17 displays the percentages of respondents who were interested in buying—and who were willing to pay more for—foods grown under different production management methods. Almost half (49 percent) of the respondents were interested in buying organic foods, while a third of the respondents (32 percent) were willing to pay more for this production technique.
Forty percent of respondents were interested in buying hormone-free meat, although only a quarter (24 percent) were willing to pay more for this production method. A third was interested in buying chicken and other raised-on-range meats, but only 22 percent were willing to pay more for this livestock production method.
A third (30 percent) were interested in buying genetically modified organism (GMO)-free food, while 19 percent were willing to pay more for this production option.
Origin Labels
Chart 18 displays how respondents felt about origin labels on fresh produce, meat, or livestock products. A clear majority of respondents believed that origin labels helped them make purchasing decisions: 44 percent described origin labels as very useful, and 35 percent as somewhat useful.
Implications and Suggestions for Farm Direct Marketers
- Sell fresh, high-quality produce! Freshness is the major reason people patronize farm direct markets. Freshness sets farm markets apart from grocery stores.
- Label or identify locally grown products. Consumers want to support their local farmers. Let them know who you are!
- Being perceived by consumers as inconvenient, or worse, nonexistent, is a barrier to farm direct patronage. Overcome such negative perceptions with a mix of strategies including advertising, good directions and signage, consistent hours of operation, and easy parking.
- Consider increasing the variety of items that are offered to consumers.
- Consider increasing your hours of operation if you are located in an urban area.
- Organic, GMO-free, hormone-free or raised-on-range products should be identified to consumers.
Summary
The data in this publication came from a survey conducted in the Maine Highlands region, consisting of Penobscot and Piscataquis Counties, in 2003. Our goal was to discover whether farm direct marketers are meeting consumer demand, and if not, how they can better do so. The survey rendered a great deal of valuable information about consumer habits and decisions. It also identified the following very clear opportunities for farmers who want to increase their farm direct business:
- Help consumers find you. Make generous and thoughtful use of roadside signs, newspapers, and events or gimmicks that stimulate word-of-mouth publicity.
- Offer increased variety.
- Offer top-selling items such as apples, sweet corn, berries, potatoes, pumpkins, squash, cucumbers, and tomatoes
- Add eggs, flowers, and/or organic produce.
- Offer fresh, high-quality produce.
- Offer bulk quantities of potatoes, tomatoes, squash, carrots, and sweet corn for home food processors.
- Offer expanded hours of operation if you serve an urban area.
- Keep your hours of operation consistent.
- Offer easy parking.
- Identify locally grown products.
- Identify organic, GMO-free, hormone-free or raised-on-range products.
1Since respondents had very little knowledge of home delivery, this farm-direct market method has been omitted from this discussion.
Maine Highlands Farm Products Promotion Group members: Alan Clements, Linda Clewley, Bob Petersen, Chris Petersen, Wallace Sinclair, and Lorraine Stutzman assisted with this fact sheet.
Chart Gallery Full Descriptions
Chart 1: Pie chart showing the total response rate of 47% for urban and 53% for rural.
Chart 2: A stacked bar chart showing the age distribution of respondents’ household members. Under ten years of age rural 49, urban 30; ten to nineteen years rural 44, urban 46; twenty to thirty-four years rural 32, urban 42; thirty-five to fifty-four years rural 147, urban 124; fifty-five plus years rural 199, urban 162.
Chart 3: A bar chart showing the number of outlets known by respondents, average known by outlet. Farm stands 1.9 known by rural, 1.1 known by urban; pick-your-own 1.2 known by rural, 1 known by urban; tailgate 0.5 known by rural, 0.7 known by urban; home delivery none known by rural, 0.1 known by urban; Farmers’ Market 0.6 known by rural, 1.2 known by urban; grocery 1.9 known by rural, 3 known by urban.
Chart 4: A bar chart showing the percent of respondents aware of outlets. Farm stands 86% of rural, 61% of urban; pick-your-own 63% of rural, 45% of urban; tailgate 27% of rural, 36% of urban; Farmers’ Market 31% of rural, 81% of urban; grocery 80 of rural, 86% of urban.
Chart 5: A bar chart showing the average distance traveled to outlet. Farm stands 7.5 miles for rural, 5.8 miles for urban; pick-your-own 11.5 miles for rural, 12.6 miles for urban; tailgate 10.7 miles for rural, 4.1 miles for urban; Farmers’ Market 15.4 miles for rural, 3.5 miles for urban; grocery 10.6 miles for rural, 2.9 miles for urban.
Chart 6: A bar chart showing the distance respondents were willing to travel to buy from farm direct markets, percent of respondents by distance in miles. Less than three miles, 7% rural and 7% urban; three to five miles, 20% rural and 32% urban; six to ten miles, 28% rural and 40% urban; eleven to fifteen miles 12% rural and 8% urban; sixteen to twenty miles, 18% rural and 5% urban; over twenty miles 14% rural and 7% urban.
Chart 7a: A bar chart showing where rural residents got information about outlets, percent by media type. Roadside signs, 34% farm stands, 22% pick-your-own, 7% tailgate market, and 12% farmers market; word of mouth, 28% farm stands, 16% pick-your-own, 4% tailgate market, and 8% farmers market; newspaper 18% farm stands, 16% pick-your-own, 1% tailgate market, and 11% farmers market, direct mail 0% farm stands, 1% pick-your-own, 0% tailgate market, and 1% farmers market; radio 5% farm stands, 8% pick-your-own, 0% tailgate market, and 3% farmers market; and television 3% farm stands, 8% pick-your-own, 0% tailgate market, and 3% farmers market.
Chart 7b: A bar chart showing where urban residents got information about outlets, percent by media type. Roadside signs, 30% farm stands, 15% pick-your-own, 14% tailgate market, and 27% farmers market; word of mouth, 22% farm stands, 15% pick-your-own, 8% tailgate market, and 25% farmers market; newspaper 12% farm stands, 20% pick-your-own, 3% tailgate market, and 21% farmers market, direct mail 1% farm stands, 1% pick-your-own, 0% tailgate market, and 1% farmers market; radio 6% farm stands, 9% pick-your-own, 0% tailgate market, and 3% farmers market; and television 3% farm stands, 8% pick-your-own, 1% tailgate market, and 6% farmers market.
Chart 8a: A bar chart showing for rural respondents their typical expenditure on food for each visit to different outlets by percent purchasing less than $10, $10 to $20 or over $20. Farm stand, 46.4 percent spent less than $10, 34.8 percent spent between $10 and $20 and 4.3 percent spent over $20; pick-your-own, 16.4 percent spent less than $10, 27.1 percent spent between $10 and $20 and 10.6 percent spent over $20; tailgate markets 12.1 percent spent less than $10, 5.3 percent spent between $10 and $20 and 0.5 percent spent over $20; home delivery, 2.9 percent spent less than $10, 0 percent spent between $10 and $20 and 2.4 percent spent over $20; farmers market 14.5 percent spent less than $10, 9.7 percent spent between $10 and $20 and 4.8 percent spent over $20.
Chart 8b: A bar chart showing for urban respondents their typical expenditure on food for each visit to different outlets by percent purchasing less than $10, $10 to $20 or over $20. Farm stand, 38.7 percent spent less than $10, 23.7 percent spent between $10 and $20 and 4.3 percent spent over $20; pick-your-own, 16.7 percent spent less than $10, 22 percent spent between $10 and $20 and 8.1 percent spent over $20; tailgate markets 22 percent spent less than $10, 9.1 percent spent between $10 and $20 and 1.1 percent spent over $20; home delivery, 2.7 percent spent less than $10, 1.1 percent spent between $10 and $20 and 1.6 percent spent over $20; farmers market 33.9 percent spent less than $10, 30.6 percent spent between $10 and $20 and 12.9 percent spent over $20.
Chart 9a: A stacked bar chart showing purchases of various products from outlets by number of rural respondents. Vegetables were purchased by 80 respondents at farm stands, 14 at pick-your-own, 22 at farmers markets, 15 at tailgate markets and 62 at grocery stores. Fruits were purchased by 61 respondents at farm stands, 47 at pick-your-own, 15 at farmers markets, 10 at tailgate markets and 61 at grocery stores. Eggs were purchased by 25 respondents at farm stands, none at pick-your-own, 9 at farmers markets, 1 at tailgate markets and 58 at grocery stores. Flowers were purchased by 24 respondents at farm stands, 3 at pick-your-own, 7 at farmers markets, 5 at tailgate markets and 8 at grocery stores. Organic produce was purchased by 16 respondents at farm stands, 4 at pick-your-own, 11 at farmers markets, 5 at tailgate markets and 13 at grocery stores. Homemade foods were purchased by 16 respondents at farm stands, none at pick-your-own, 8 at farmers markets, 2 at tailgate markets and 6 at grocery stores. Greenhouse produce was purchased by 13 respondents at farm stands, 1 at pick-your-own, 3 at farmers markets, 1 at tailgate markets and 14 at grocery stores. Jams and jellies were purchased by 12 respondents at farm stands, 1 at pick-your-own, 6 at farmers markets, 1 at tailgate markets and 41 at grocery stores. Pickles were purchased by 10 respondents at farm stands, 2 at pick-your-own, 6 at farmers markets, 1 at tailgate markets and 42 at grocery stores.
Chart 9b: A stacked bar chart showing purchases of various products from outlets by number of urban respondents. Vegetables were purchased by 64 respondents at farm stands, 16 at pick-your-own, 64 at farmers markets, 30 at tailgate markets and 75 at grocery stores. Fruits were purchased by 49 respondents at farm stands, 47 at pick-your-own, 54 at farmers markets, 26 at tailgate markets and 75 at grocery stores. Eggs were purchased by 20 respondents at farm stands, none at pick-your-own, 24 at farmers markets, 5 at tailgate markets and 70 at grocery stores. Flowers were purchased by 23 respondents at farm stands, 4 at pick-your-own, 25 at farmers markets, 8 at tailgate markets and 23 at grocery stores. Organic produce was purchased by 20 respondents at farm stands, 5 at pick-your-own, 29 at farmers markets, 10 at tailgate markets and 23 at grocery stores. Homemade foods were purchased by 15 respondents at farm stands, 1 at pick-your-own, 27 at farmers markets, 4 at tailgate markets and 11 at grocery stores. Greenhouse produce was purchased by 16 respondents at farm stands, 1 at pick-your-own, 17 at farmers markets, 4 at tailgate markets and 24 at grocery stores. Jams and jellies were purchased by 18 respondents at farm stands, 1 at pick-your-own, 26 at farmers markets, 5 at tailgate markets and 56 at grocery stores. Pickles were purchased by 12 respondents at farm stands, 1 at pick-your-own, 16 at farmers markets, 3 at tailgate markets and 54 at grocery stores.
Chart 10: A bar chart showing products most likely to be purchased by either rural respondents or urban respondents. Apples would like to be purchased by 74 percent rural and 67 percent urban. Sweet corn would like to be purchased by 69 percent rural and 58 percent urban. Berries would like to be purchased by 50 percent rural and 51 percent urban. Potatoes would like to be purchased by 45 percent rural and 35 percent urban. Squash and pumpkins would like to be purchased by 44 percent rural and 44 percent urban. Cucumbers would like to be purchased by 29 percent rural and 35 percent urban. Tomatoes would like to be purchased by 29 percent rural and 47 percent urban. Maple syrup would like to be purchased by 25 percent rural and 18 percent urban. Bedding plants would like to be purchased by 21 percent rural and 15 percent urban. Fresh beans would like to be purchased by 18 percent rural and 22 percent urban. Beet greens would like to be purchased by 17 percent rural and 20 percent urban. Eggs would like to be purchased by 16 percent rural and 18 percent urban. Dry beans would like to be purchased by 14 percent rural and 6 percent urban. Landscape plants would like to be purchased by 14 percent rural and 8 percent urban. Peas would like to be purchased by 14 percent rural and 17 percent urban.
Chart 11: A pie chart showing fruits and vegetables typically processed by respondents. Potatoes were processed by 20 percent of respondents, tomatoes 15 percent, squash 11 percent, carrots 9 percent, sweet corn 9 percent, apples 8 percent, peas 7 percent, berries 6 percent, cabbage 5 percent, other 5 percent, fresh beans 4 percent and cucumbers 1 percent.
Chart 12a: A bar chart showing sources of fruit and vegetables for the families of all respondents that supplied either less than one-quarter of the family’s produce, one quarter to one half of the family’s produce or more than one half of the family’s produce. Farm direct markets provided less than one-quarter of produce for 44% of families, between one quarter and one half of produce for 10% of families and more than half of produce for 3% of families. Grocery stores within 10 miles provided less than one-quarter of produce for 10% of families, between one quarter and one half of produce for 12% of families and more than half of produce for 48% of families. Grocery stores located between 10 miles and 30 miles provided less than one-quarter of produce for 11% of families, between one quarter and one half of produce for 7% of families and more than half of produce for 12% of families. Grocery stores located more than 30 miles away provided less than one-quarter of produce for 12% of families, between one quarter and one half of produce for 2% of families and more than half of produce for 2% of families.
Produce from friends/ neighbor’s garden provided less than one-quarter of produce for 27% of families, between one quarter and one half of produce for 4% of families and more than half of produce for 0% of families. Produce from the respondents garden provided less than one-quarter of produce for 22% of families, between one quarter and one half of produce for 10% of families and more than half of produce for 6% of families.
Chart 12b: A bar chart showing sources of meat and livestock products for the families of all respondents that supplied either less than one quarter of the family’s meat and livestock products, one quarter to one half of the family’s meat and livestock products or more than one half of the family’s meat and livestock products. Farm direct markets provided less than one-quarter of meat and livestock products for 18% of families, between one quarter and one-half of meat and livestock products for 2% of families and more than half of meat and livestock products for 4% of families. Grocery stores within 10 miles provided less than one-quarter of meat and livestock products for 6% of families, between one quarter and one-half of meat and livestock products for 8% of families and more than half of meat and livestock products for 48% of families. Grocery stores located between 10 miles and 30 miles provided less than one-quarter of meat and livestock products for 9% of families, between one quarter and one-half of meat and livestock products for 6% of families and more than half of meat and livestock products for 17% of families. Grocery stores located more than 30 miles away provided less than one-quarter of meat and livestock products for 10% of families, between one quarter and one-half of meat and livestock products for 3% of families and more than half of meat and livestock products for 3% of families. Meat and livestock products from friends/ neighbor’s provided less than one-quarter of meat and livestock products for 7% of families, between one quarter and one-half of meat and livestock products for 1% of families and more than half of meat and livestock products for 1% of families. Meat and livestock products from the respondents garden provided less than one-quarter of meat and livestock products for 5% of families, between one quarter and one-half of meat and livestock products for 1% of families and more than half of meat and livestock products for 1% of families. meat and livestock products from the respondents own livestock provided less than one-quarter of meat and livestock products for 6% of families, between one quarter and one-half of meat and livestock products for 1% of families and more than half of meat and livestock products for 2% of families.
Chart 13: A stacked bar chart showing urban respondents’ reasons for shopping at farm direct outlets. Freshness was the reason 53% or respondents shopped at farm stands, 32% at pick-your-own, 22% from tailgate markets and 53% from farmers markets. Locally grown was the reason 52% or respondents shopped at farm stands, 30% at pick-your-own, 22% from tailgate markets and 51% from farmers markets. Support local farmers was the reason 49% or respondents shopped at farm stands, 30% at pick-your-own, 20% from tailgate markets and 47% from farmers markets. Quality was the reason 51% or respondents shopped at farm stands, 27% at pick-your-own, 21% from tailgate markets and 49% from farmers markets. Nutrition was the reason 35% or respondents shopped at farm stands, 20% at pick-your-own, 15% from tailgate markets and 36% from farmers markets. Value for money was the reason 28% or respondents shopped at farm stands, 26% at pick-your-own, 16% from tailgate markets and 23% from farmers markets. The appearance of products was the reason 32% or respondents shopped at farm stands, 17% at pick-your-own, 14% from tailgate markets and 32% from farmers markets.
Chart 14: A stacked bar chart showing rural respondents’ reasons for shopping at farm direct outlets. Freshness was the reason 69% or respondents shopped at farm stands, 30% at pick-your-own, 14% from tailgate markets and 19% from farmers markets. Locally grown was the reason 66% or respondents shopped at farm stands, 24% at pick-your-own, 12% from tailgate markets and 18% from farmers markets. Support local farmers was the reason 61% or respondents shopped at farm stands, 23% at pick-your-own, 12% from tailgate markets and 17% from farmers markets. Quality was the reason 60% or respondents shopped at farm stands, 29% at pick-your-own, 12% from tailgate markets and 17% from farmers markets. Nutrition was the reason 46% or respondents shopped at farm stands, 19% at pick-your-own, 11% from tailgate markets and 14% from farmers markets. Value for money was the reason 39% or respondents shopped at farm stands, 28% at pick-your-own, 7% from tailgate markets and 13% from farmers markets. The appearance of products was the reason 39% or respondents shopped at farm stands, 14% at pick-your-own, 7% from tailgate markets and 11% from farmers markets.
Chart 15: Is a stacked bar chart showing rural and urban reasons for NOT shopping at outlets. Limited hours was the reason 8 rural and 15 urban did not shop at farm stands; 7 rural and 28 urban did not shop at farmers markets; 2 rural and 1 urban did not shop at grocery stores. Raise my own garden produce was the reason 14 rural and 10 urban did not shop at farm stands; 11 rural and 8 urban did not shop at farmers markets; 8 rural and 9 urban did not shop at grocery stores. High prices were the reason 11 rural and 9 urban did not shop at farm stands; 4 rural and 19 urban did not shop at farmers markets; 26 rural and 26 urban did not shop at grocery stores. Poor quality was the reason 3 rural and 1 urban did not shop at farm stands; 0 rural and 1 urban did not shop at farmers markets; 20 rural and 28 urban did not shop at grocery stores. The limited variety was the reason 10 rural and 11 urban did not shop at farm stands; 3 rural and 7 urban did not shop at farmers markets; 14 rural and 8 urban did not shop at grocery stores. Don’t know any in my area was the reason 4 rural and 15 urban did not shop at farm stands; 12 rural and 3 urban did not shop at farmers markets; 1 rural and 0 urban did not shop at grocery stores. Inconvenient location was the reason 7 rural and 12 urban did not shop at farm stands; 9 rural and 9 urban did not shop at farmers markets; 1 rural and 1 urban did not shop at grocery stores. Too far was the reason 4 rural and 9 urban did not shop at farm stands; 6 rural and 4 urban did not shop at farmers markets; 0 rural and 1 urban did not shop at grocery stores. Don’t accept food stamps was the reason 5 rural and 3 urban did not shop at farm stands; 2 rural and 2 urban did not shop at farmers markets; 0 rural and 0 urban did not shop at grocery stores.
Chart 16: A stacked bar chart showing perceived problems with farm direct products. The percent of respondents who identified problems with appearance of fruit was 6%, vegetables was 7%, livestock products was 2% and other farm products was 2%. The percent of respondents who identified problems with poor flavor of fruit was 5%, vegetables was 10%, livestock products was 2% and other farm products was 1%.
- The percent of respondents who identified problems with tough fruit was 2%, vegetables was 7%, livestock products was 4% and other farm products was 0%.
- The percent of respondents who identified problems with bruised fruit was 10%, vegetables was 6%, livestock products was 1% and other farm products was 1%.
- The percent of respondents who identified problems with not fresh fruit was 5%, vegetables was 8%, livestock products was 2% and other farm products was 1%.
- The percent of respondents who identified other problems with fruit was 3%, vegetables was 7%, livestock products was 1% and other farm products was 1%.
Chart 17: A bar chart showing the willingness to buy and pay more for management methods. 48% of respondents would likely purchase products raised with organic methods and 38% would be willing to pay more for these products. 40% of respondents would likely purchase products raised with hormone-free methods and 31% would be willing to pay more for these products. 30% of respondents would likely purchase products raised on range methods and 24% would be willing to pay more for these products. 33% of respondents would likely purchase products raised with GMO-free methods and 27% would be willing to pay more for these products.
Chart 18: A bar chart showing the importance of origin label to purchasing decision. The respondents indicated that 44% found the labels very useful, 35% found them somewhat useful, 6% did not find them useful and 11% did not use the labels.
Information in this publication is provided purely for educational purposes. No responsibility is assumed for any problems associated with the use of products or services mentioned. No endorsement of products or companies is intended, nor is criticism of unnamed products or companies implied.
© 2005
Call 800.287.0274 (in Maine), or 207.581.3188, for information on publications and program offerings from University of Maine Cooperative Extension, or visit extension.umaine.edu.
In complying with the letter and spirit of applicable laws and pursuing its own goals of diversity, the University of Maine System does not discriminate on the grounds of race, color, religion, sex, sexual orientation, transgender status, gender, gender identity or expression, ethnicity, national origin, citizenship status, familial status, ancestry, age, disability physical or mental, genetic information, or veterans or military status in employment, education, and all other programs and activities. The University provides reasonable accommodations to qualified individuals with disabilities upon request. The following person has been designated to handle inquiries regarding non-discrimination policies: Director of Institutional Equity and Title IX Services, 5713 Chadbourne Hall, Room 412, University of Maine, Orono, ME 04469-5713, 207.581.1226, TTY 711 (Maine Relay System).


