2010-2013 Maine and Vermont Organic Spring Wheat Variety Trial Results
2010-2013 Maine and Vermont Organic Spring Wheat Variety Trial Results (PDF)
Ellen Mallory, Heather Darby, Thomas Molloy, and Erica Cummings
Bread wheat is a new crop option for farmers in New England due to increasing consumer demand for locally grown food. In 2010, the University of Maine and University of Vermont began a series of trials evaluating varieties of hard red wheat to identify those that perform well in Northern New England under organic production. This publication presents results for spring wheat varieties tested from 2010 through 2013. Separate publications of prior years’ full results for both spring and winter wheat variety trials are available online.
This collaborative work was funded by a grant from the USDA Organic Agriculture Research and Extension Initiative to improve bread wheat production in our region.
TRIAL DESIGN AND VARIETIES
Trials were established each year at four locations in Northern New England: Alburgh, VT; Old Town or Presque Isle, ME; Sidney, ME; and Willsboro, NY. The experimental design was a randomized complete block with four replications, which means that each variety was planted in four separate plots at each location. All of the varieties evaluated from 2010 to 2013 are listed in Table 1. Over the course of the trials, some varieties were added as new ones became available and some varieties were removed if they were found to be unsuitable for our region (ex., highly susceptible to Fusarium head blight) or for bread flour markets (ex., low grain protein levels). The results for varieties that were dropped from our trials can be found in previous years’ reports.
WEATHER CONDITIONS
Seasonal precipitation and temperature were recorded at or near the trial locations. The Alburgh, VT, Old Town, ME, Presque Isle, ME, and Willsboro, NY locations had weather stations in close proximity to the trial sites, while the Sidney, ME location had a weather station within 8 miles. Weather conditions varied greatly from year to year, affecting the overall development and quality of the wheat (Table 2).
In 2010, weather conditions were ideal for growing spring wheat. The spring was warm and dry, with April and May temperatures well above the 30-year mean and rainfall below normal, allowing for wheat to be planted up to two weeks earlier than what is normal for the region. Except for the month of June, the pattern of above average temperatures and below average rainfall continued through the growing season.
In 2011, weather conditions were more challenging for spring grains due to heavy spring precipitation, especially at the VT and NY sites where rainfall for both April and May was about 5 inches above normal. Planting was delayed at all sites, occurring from May 2 to May 13. Summer temperatures were slightly cooler than normal in ME and slightly warmer than usual at the VT and NY sites. Precipitation levels were normal or slightly below at all sites.
As in 2010, early spring conditions in 2012 were substantially warmer and somewhat drier than usual allowing for early planting (April 6 to April 13). The VT and NY locations also experienced above average temperatures during the middle and later part of the growing season. In ME, precipitation was above average in June prior to and during wheat flowering and conditions were warmer and drier than average during grain fill and harvest.
2013 started off drier than normal allowing for early planting at the VT and NY sites and timely planting in ME. Starting in late May through June, precipitation levels were well above normal. The VT and NY sites received two times the average rainfall for June. July precipitation levels returned to normal at all sites, however, above average levels occurred in August in ME during grain ripening and dry down.
CULTURAL PRACTICES
Trial plots were managed following practices similar to those used by farmers in New England (Table 3).
University of Maine Rogers and Smith Research Farms — Old Town, ME (2010 – 2012): As soon as weather conditions allowed, the plot areas were moldboard plowed. Prior to planting, solid dairy manure was applied and incorporated on the same day with a Perfecta harrow. The estimated total available nitrogen from the various fertility sources was 70 lbs per acre in 2010 and 2011 and 90 lbs per acre in 2012. The spring wheat varieties were planted using an Almaco cone seeder with 6.5-inch row spacing. The seeding rate was 30 live seeds per square foot in 2010 and 2012 and increased to 51 live seeds per square foot for 2012. These rates correspond to target plant populations of 1.3 and 2 million plants per acre, respectively. When the wheat reached the 3-leaf stage, the plots were tine harrowed with a 10-ft. Lely Weeder (spring tine harrow) if weed seedling numbers were high and field conditions allowed. In 2012, the plots were topdressed with Chilean nitrate at 100 lbs per acre (16 lbs of nitrogen per acre) when the wheat was in the late tillering stage. Wheat grain was harvested using a Wintersteiger Classic plot combine. Harvest area was 4’ x 33’.
University of Maine Presque Isle Research Farm — Presque Isle, ME (2013 only): The trial area was disk harrowed in early spring and then chicken manure from a broiler operation was spread. The manure was worked in with a Vibrashank seed-bed conditioner. The estimated total available nitrogen from the manure source was 60 lbs per acre. The spring wheat varieties were planted using an Almaco cone seeder with a 6.5 inch row spacing. The seeding rate was 51 live seeds per square foot, which corresponds to a target population of 2 million plants per acre. The plots were tine harrowed using a Lely Weeder when the wheat was at the 3-leaf stage. A Wintersteiger Classic plot combine was used to harvest the plots. Harvest area was 4’ x 33’.
Rainbow Valley Farm — Sidney, ME: Field preparation at this site was similar to the Old Town site except liquid dairy manure was used in 2010 and 2011, and manure incorporation and seedbed preparation were accomplished with two passes of a disc harrow followed by a pass of either a cultivator packer, a spring-tooth harrow, or a C-shank chisel harrow. The estimated total available nitrogen from the manure sources were 70 lbs per acre in 2010 and 2011, 55 lbs per acre in 2012, and 78 lbs per acre in 2013. Spring wheat was planted using an Almaco cone seeder with a 6.5 inch row spacing. The seeding rate was 30 live seeds per square foot in 2010 and 2012 and increased to 51 live seeds per square foot for 2012 and 2013. Weeds were managed with one pass of a LELY Weeder tine weeder in 2010 and 2012. A Wintersteiger Classic plot combine was used to harvest the plots. Harvest area was 4’ x 33’.
Borderview Research Farm — Alburgh, VT: For the 2010 and 2012 trials, the plot areas were plowed the prior fall to kill and incorporate a perennial forage stand, and in the spring, they were disked and spike-tooth harrowed before planting. The estimated nitrogen availability from the sod plow down was 65-75 lbs per acre. In 2011, the fertility source was poultry manure applied at a rate to supply an estimated 70 lbs per acre of available nitrogen. In 2013, no pre-plant fertility was applied following a prior corn crop. In 2011 and 2013, field preparation consisted of one pass each of a disk and a spike-tooth harrow. In all years, wheat was seeded using an eight-row Kincaid Cone Seeder with 6-inch row spacing at a rate of 33 live seeds per square foot, equivalent to a target population of 1.4 million plants per acre. When needed, plots were tine weeded with a 12 ft. Kovar Tine Weeder. Wheat was harvested using an Almaco SPC50 plot combine. Harvest area was 5’ x 20’.
Willsboro Research Farm — Willsboro, NY: The fields used for the 2010 and 2011 trials were fall plowed. In 2010, the field was dragged twice in the fall to eliminate remaining alfalfa and perennial grasses. In April of each year, the fields were disked and spike-tooth harrowed before planting. Estimated nitrogen availability from the various fertility sources was 65-75 lbs per acre. Wheat was seeded using a custom eight-row cone seeder with 6-inch row spacing at a rate of 33 live seeds per square foot. The plots were harvested with a Hege plot combine. Harvest area was 4’ x 13’.
MEASUREMENTS AND METHODS
Flowering date was recorded for each variety where possible. Plant heights were measured at each site at the peak biomass stage. Prior to harvest, the incidence and severity of lodging was noted for each variety. All varieties were harvested on the same day at each site once the latest maturing variety threshed free in hand tests and weather and logistics allowed. Following harvest, grain was cleaned with a small Clipper cleaner and weights were recorded. Harvest moisture and test weights were determined using DICKEY-john GAC-2100 grain moisture meters.
Subsamples were ground into flour using a Perten LM3100 Laboratory Mill. The ground material was then analyzed for crude protein, falling number, and mycotoxin levels. Protein content was determined using a Perten Inframatic 8600 Flour Analyzer. Most commercial mills target 12-14% protein. Falling number was determined on a Perten FN 1500 Falling Number Machine. The falling number is related to the level of sprout damage that has occurred in the grain due to enzymatic activity. It is measured as the time it takes, in seconds, for a plunger to fall through a slurry of flour and water to the bottom of the tube. Falling numbers less than 200 seconds indicate high enzymatic activity and poor quality wheat. Concentrations of deoxynivalenol (DON), a mycotoxin produced by the fungus that causes Fusarium head blight, were determined using the Veratox DON 2/3 Quantitative test from the NEOGEN Corp. This test has a detection range of 0.5 to 5 ppm. Samples with DON values greater than 1 ppm are considered unsuitable for human consumption.
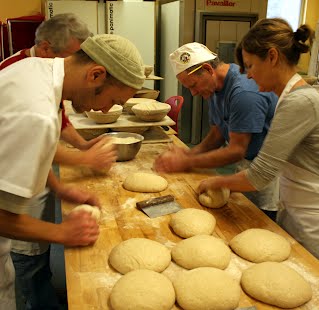
Bake testing was conducted on eleven varieties from the 2012 growing season. Samples for testing came from individual field sites and were selected based on protein, DON, falling number levels and quantity of available grain. Each sample was milled at Gleason Grains in Bridport, VT on a Meadows Mills Inc. stone burr mill and then sifted on a Meadows Mills Inc. bolter which produced a finely ground flower with an approximate 86% extraction rate. The bake tests were conducted by: Randy George, Red Hen Baking Company, Duxbury, VT; Jeffery Hamelman, King Arthur Flour, Norwich, VT; and Alison Pray, Standard Baking Co., Portland, ME. Each baker followed the same recipe for a naturally leavened bread and as each sample was tested the bakers used a predetermined list of criteria to score for certain characteristics from the beginning of the baking process to the final loaf.
All data were analyzed using mixed model Analysis of Variance (ANOVA) in which replicates were considered random effects. The LSD procedure was used to detect whether differences among variety averages were statistically significant and was only conducted if the ANOVA F-test was significant (P<0.05) (see below for a description of a “significant difference”). There were significant differences between the locations for most parameters, so results from each location are reported independently.
What Is a Significant Difference?
Variations in yield and quality can occur not only due to genetics but also due to variability in soil, weather, and other growing conditions. Statistical analysis makes it possible to determine whether a difference between two varieties is real or whether it might have occurred due to other variability in the field. The Least Significant Difference (LSD) is the minimum difference needed between two averages to consider them statistically different. LSDs at the 5% level of probability are presented at the bottom of each table for each measure. Where the difference between two varieties within a column is equal to or greater than the LSD value, you can be sure in 19 out of 20 chances that there is a real difference between the two varieties.
In the example below, variety A is significantly different from variety C because the difference between their yields (1454) is greater than the LSD value (889). Variety A is not significantly different from variety B because the difference between their yields (725) is less than the LSD value (889).
Throughout this bulletin, the greatest value at each site for each measure is indicated with an underline and bold type. Varieties that are not significantly different from the greatest value are also in bold type. Using the example below, variety C had the highest measured yield (underlined and bolded) but it was not significantly different than the yield of variety B (bolded).
Example Table
| Variety | Yield | ||||||
|
|
||||||
| LSD | 889 |
RESULTS
Growth and Development
Weather played a very important role in the growth, development, and production of spring wheat over the four years of trials. Warm, dry weather conditions in April and May in 2010 and 2012 allowed for early planting at all locations, which supported good early growth, limited weed pressure, and good to excellent yields and overall quality. In 2011, high precipitation levels in early spring led to late planting and resulted in moderate to severe issues with weed pressure, yields, and quality, especially at the Alburgh, VT, and Willsboro, NY sites. In 2013, dry weather from mid-April to mid-May allowed for timely planting at all sites, but extreme moisture conditions starting in mid-May and persisting into early July during the critical early growth stages of wheat led to below-average yields and high DON levels, with the Presque Isle, ME site being the exception.
Flowering generally occurred during the third and fourth week of June in each year, except in 2011 and at the Presque Isle, ME site in 2013 (Table 4). In these cases, later planting delayed flowering. Across all sites and years, Brick, and Roblin were the earliest varieties to flower, whereas AC Walton and Red Fife were among the latest.
Over the four years of trialing, plant heights ranged from 28 to 43 inches (Table 4). AC Walton, Kaffé, Megantic, and Red Fife were the tallest varieties, while Sy Rowyn, Ada, Jenna, and Sy Soren were the shortest.
Lodging was moderate in the first three years with Sabin, Helios lodging in Alburgh, VT in 2011 and Red Fife lodging in Old Town, ME in 2011. In 2013, the VT and NY sites experienced more lodging issues and the varieties that lodged were Red Fife, McKenzie, Megantic, Prosper, Yorkton, Superb, Faller, Kaffé, and Sy Rowyn. At the Sidney, ME site that year, three varieties lodged, Red Fife, Advance, and RB07.
Weed pressure was generally low at the ME sites and did not cause yield or quality problems except at the Sidney location in 2013 where weeds likely contributed to lower yield. Weed pressure was severe at the Alburgh, VT site in 2010 and 2013, and the Willsboro, NY site in 2013. In 2011 and 2013, the NY site also experienced extensive damage from wild turkeys.
Grain Yield
A typical yield for organic hard red spring wheat grown in Northern New England is about 2,000 lbs per acre (Matt Williams, personal communication, 2011). Yields over the four years of these trials were variable (Table 5). At the ME sites, the average yield across varieties met or exceeded the regional average in all years except in 2013 in Sidney. In contrast, yields were well below the regional average at the Alburgh, VT site in 2010 and 2011 but exceeded or met this average in 2012 and 2013. In Willsboro, NY yields were equal or above average in 2010 and 2012 but below average in 2011 and 2013. Across all sites and years, Faller, Jenna, Magog, and Tom have been consistently among the highest yielding varieties, whereas AC Barrie and Red Fife have been among the lowest yielding varieties.
Grain Quality
Commercial mills use a variety of measurements to determine if a particular lot of wheat is suitable for bread flour, including grain protein, test weight, falling number, and mycotoxin (DON) concentration.
Grain protein levels varied considerably among years, with all sites producing their highest protein levels in 2010 and most sites experiencing their lowest protein levels in 2011 (Table 6). Site averages ranged from lows of 11.3% and 11.5% at the 2011 Old Town, ME and 2013 Presque Isle ME sites, respectively, to highs of 15.3%, 15.6%, and 15.7% at the 2010 Alburgh, VT, 2010 Willsboro, NY, and 2010 Old Town, ME sites, respectively. Among the varieties, AC Barrie, Glenn, Roblin, and the new variety Yorkton have consistently produced among the highest protein levels over the four years of trialing, whereas Faller, FBC Dylan, and Kaffé have consistently ranked low for grain protein.
The standard test weight for hard red spring wheat is 58 lbs per bushel, with an acceptable range of 56-60 lbs per bushel. Most varieties had adequate to good test weights for the first three years of the trial, although in 2011 test weights were on the lower end of the acceptable range (Table 7). However, in 2013, while most varieties at the Presque Isle, ME site tested above 60 lbs per bushel, most of the varieties at the Sidney, ME and Alburgh, VT locations tested below the acceptable level. (Test weight was not measured at the Willsboro, NY site in 2013.) Varieties that consistently demonstrated relatively high test weights across locations included Barlow, Faller, Glenn, Jenna, Oklee, and Tom, whereas AC Barrie, AC Walton, Red Fife, and Roblin tended to produce low test weights.
Falling number values were well above the acceptable level (250 seconds) in almost all cases. Exceptions include Jenna, Kaffé, and Roblin, which tested below 250 seconds in 2011 and 2013 for at least one site (Table 8). However, these trials are not the best indicator of each variety’s susceptibility to pre-harvest sprouting because of our method of harvesting, which required us to harvest all varieties at the same time and therefore wait to harvest until the latest maturing variety threshed free in hand tests. This may have put early maturing varieties like Roblin at greater risk for pre-harvest sprouting and low falling number values than later maturing varieties.
Fusarium head blight, which produces the mycotoxin deoxynivalenol (DON), is a disease of major concern for wheat growers in northern New England. It primarily infects the plant during flowering and is favored by cool, humid weather. The United States Food and Drug Administration has established a maximum DON guideline of 1 ppm for finished human products. Millers may accept grain with slightly higher DON levels because, through cleaning, they can remove some of the infected grain and reduce DON levels.
DON levels were quite variable among sites and years (see Table 9). In ME, the Old Town and Sidney locations experienced average DON levels above 1 ppm in five of the seven site years, while the 2013 Presque Isle site had very low DON levels with only one variety testing above 1 ppm (Red Fife). At the Alburgh, VT site, average DON levels were above 1 ppm for two of the four years, while at Willsboro, NY DON levels exceeded 1 ppm in only one year (2013). Some varieties were dropped from the trialing program due to unacceptably high DON levels, specifically Batiscan, Cabernet, Kelse, and Malbec. Other varieties that have showed relatively high DON levels include Barlow, Jenna, McKenzie, Steele, Superb, and Ulen. The varieties that have consistently shown the lowest DON levels are AC Barrie, Brick, Glenn, Magog, Tom, and Yorkton.
Baking Quality
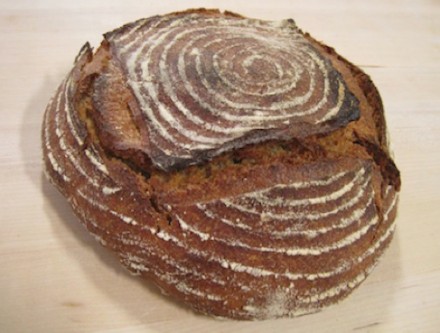
The three bakers found that all of the spring wheat samples that they tested had satisfactory to excellent baking characteristics and produced bread loaves that they would be comfortable selling in their bakeries. The varieties tested were Barlow, Faller, Glenn, Magog, McKenzie, RB07, Red Fife, Roblin, Sy Soren, Tom, and Yorkton (Table 10). Glenn and Faller produced the best overall results in this testing, while Red Fife, Tom, and Yorkton were found to have some deficiencies. The samples used for the tests had a range of protein levels from 12.8 to 13.8%. Within this range, the bakers noted that higher protein did not necessarily equate with better baking quality. However, they did remark that these samples of spring wheat had higher overall protein levels and baking performance than winter wheat samples they had trialed in 2012.
DISCUSSION
Wheat grain sold for bread flour can receive up to twice the pay price as grain sold for livestock feed in New England, but the grain must meet higher quality standards. Therefore, when choosing varieties, it is important to consider their potential to produce grain with acceptable protein, test weight, falling number, DON levels, and baking performance, as well as their ability to produce high yields.
There is often a tradeoff between yield potential and protein potential. For instance Faller had impressive yields over the four years of these trials, but also had among the lowest protein levels. In contrast, Roblin, Glenn, and Yorktown produced lower than average yields, but consistently had among the highest protein levels. A number of varieties tested in these trials have produced average or above-average yields and also maintained adequate protein levels. These varieties include Jenna, Oklee, RB07, Superb, and Tom.
Fusarium head blight can be a major issue in our region. Options for managing the disease in organic systems are limited and include rotating with non-grain crops (i.e., avoid planting wheat after wheat, corn, barley, and rye), incorporating any disease-carrying debris into the soil, and choosing less susceptible varieties. While none of the current wheat varieties are fully resistant to Fusarium head blight, some have better tolerance to the disease than others. In variety trials conducted in North Dakota and Minnesota where Fusarium inoculant and moisture levels were controlled to maximize disease incidence, Brick, Forefront, Glenn, and RB07 had the best tolerance to Fusarium when compared to the other varieties. In our trials, varieties that have consistently shown below average DON levels over multiple years include AC Barrie, Brick, Glenn, Magog, Tom, and Yorkton.
Choosing a more tolerant variety may provide some protection against Fusarium, but conditions at flowering drive infection and may still result in high DON levels. One management strategy is to plant multiple varieties that have different maturity dates, and hence flowering dates, to hedge against wet weather at flowering. In these trials Roblin and Brick were consistently early to flower, while AC Walton and Red Fife were the latest.
Although a limited number of varieties and samples were selected for bake testing, the results showed that as long as quality parameters such as protein, DON, falling number, and test weight are adequate, good to excellent artisanal breads can be baked from organic spring wheat grown in Northern New England. “For the most part, these flours were at least as strong as the flours we currently use in our bakery, if not more,” said test baker Alison Pray of Standard Baking Company in Portland ME, “The flavors and textures, given some slight variations between the flours, were widely enjoyed by our staff. I’m confident that we could make great bread using any one of these, with some tweaks in the process.”
It may be helpful to compare these ME, VT, and NY results with results from variety trails conducted in other regions. Ultimately, though, it is important to evaluate data from test sites that are similar to your farm and region when deciding which varieties to grow.
Full reports of the 2010, 2011, and 2012 results are available as separate publications.
March 11, 2014
Acknowledgements: The UVM Extension Crops and Soils Team would like to thank the Borderview Research Farm and the Willsboro Research Farm for their generous help with the trials, and Katie Blair, Chantel Cline, and Savanna Kittell-Mitchell for their assistance with data collection and entry. The University of Maine Sustainable Agriculture team thanks Jeff Bragg of Rainbow Valley Farm for providing his assistance and field in Sidney, the University of Maine Rogers Research Farm, and Joe Cannon, Chris Illingworth, Maggie Lynn, Jess Richards, Michael Correl, Erin Roche, and Aaron Englander for their technical help.
Information in this publication is provided purely for educational purposes. No responsibility is assumed for any problems associated with the use of products or services mentioned. No endorsement of products or companies is intended, nor is criticism of unnamed products or companies implied.
This research is supported by the U.S. Department of Agriculture, National Institute of Food and Agriculture, Organic Research and Extension Initiative under Award No. 2009-01366, “Enhancing farmers’ capacity to produce high quality organic bread wheat.”
Published and distributed in furtherance of Acts of Congress of May 8 and June 30, 1914, by the University of Maine Cooperative Extension, the Land Grant University of the state of Maine and the U.S. Department of Agriculture cooperating. Cooperative Extension and other agencies of the U.S.D.A. provide equal opportunities in programs and employment. Call 800.287.0271 (in Maine), or 207.581.3188, for information on publications and program offerings from University of Maine Cooperative Extension, or visit extension.umaine.edu.
Table 1. Spring wheat varieties planted in ME, VT, and NY in 2010-2013.
| Year Grown | |||||
|---|---|---|---|---|---|
| Variety | Origin and Year of Release† | 2010 | 2011 | 2012 | 2013 |
| AC Barrie | AAFC‡, Saskatchewan, 1994 | X | X | X | X |
| AC Walton | AAFC, PEI, 1995 | X | X | X | X |
| Ada | MAES, 2006 | X | X | X | |
| Advance | SDAES, 2011 | X | |||
| Barlow | NDAES, 2009 | X | X | X | X |
| Batiscan | Semican, Canada | X | X | ||
| Brick | SDAES, 2000 | X | X | X | |
| Cabernet | Resource Seed, PNW, 2001 | X | X | ||
| Faller | NDAES, 2007 | X | X | X | X |
| FBC Dylan | NPSAS/FBC, 2006 | X | X | X | |
| ForeFront | SDAES, 2012 | X | |||
| Glenn | NDAES, 2005 | X | X | X | X |
| Helios | AAFC, Saskatchewan, 2007 | X | X | ||
| Howard | NDSU, 2006 | X | X | ||
| Jenna | Agripro Syngenta, 2009 | X | X | X | X |
| Kaffé§ | Semican, Canada | X | X | X | |
| Kelse | WSU, 2008 | X | X | ||
| Kingsey | Semican, Canada | X | X | ||
| Magog | Semican, Canada, 2009 | X | X | X | X |
| Malbec | Agripro Syngenta, PNW | X | X | ||
| McKenzie | SWP/ARD, 1997 | X | X | X | |
| Megantic | SynAgri, 2008 | X | |||
| Oklee | MAES, 2003 | X | X | X | |
| Prosper | NDAES & MAES, 2012 | X | |||
| RB07 | MAES, 2007 | X | X | X | X |
| Red Fife | Heritage var., ca. 1860 | X | X | X | X |
| Roblin | ACRS, Winnipeg, 2001 | X | X | X | X |
| Sabin | MAES, 2009 | X | X | X | |
| Steele | NDAES, 2004 | X | X | X | |
| Superb | AAFC, Winnipeg, 2001 | X | X | X | X |
| Sy Rowyn | Agripro Syngenta, 2013 | X | |||
| Sy Soren | Agripro Syngenta, 2011 | X | X | ||
| Tom | MAES, 2008 | X | X | X | X |
| Ulen | MAES, 2005 | X | X | X | |
| Yorkton# | Semican, Canada, 2013 | X | X | X | |
† Year of release not always available,
‡ Abbreviations: AAFC = Agric. & Agri-Food Canada, ACRS = Agric. Canada Rsrch. Station, FBC = Farmer Breeder Club, MAES = Minnesota Agric. Expt. Station, NDAES = North Dakota Agric. Expt. Station, NDSU = North Dakota State Univ., NPSAS = North Plains Sustainable Agric. Society, PEI = Prince Edward Island, SDAES = South Dakota Agric. Expt. Station, WSU = Washington State University SWP=Saskatchewan Wheat Pool, ARD=Agricultural Research and Development.
§ Soft white.
# Formerly 07SW07
Table 2. Precipitation, temperature, and growing degree days in ME, VT, and NY in 2010-2013.†
| Site and Month |
Total Precipitation (in.) |
30-Year Average |
Average Temperature (°F) |
30-Year Average |
Growing Degree Days |
|||||||||
|---|---|---|---|---|---|---|---|---|---|---|---|---|---|---|
| 2010 | 2011 | 2012 | 2013 | 1981-2010 | 2010 | 2011 | 2012 | 2013 | 1981-2010 | 2010 | 2011 | 2012 | 2013 | |
| Old Town, ME | ||||||||||||||
| April | 2.3 | 5.7 | 3.7 | 1.4 | 3.8 | 46 | 42 | 44 | 40 | 42 | 426 | 294 | 356 | 229 |
| May | 1.9 | 3.8 | 4.3 | 4.2 | 3.9 | 56 | 54 | 55 | 54 | 53 | 726 | 680 | 707 | 667 |
| June | 4.0 | 4.2 | 6.0 | 6.0 | 4.1 | 62 | 61 | 61 | 61 | 62 | 857 | 844 | 867 | 855 |
| July | 2.2 | 2.1 | 1.0 | 4.4 | 3.6 | 71 | 69 | 69 | 69 | 68 | 1182 | 1127 | 1114 | 1104 |
| August | 1.1 | 8.8 | 2.8 | 6.4 | 3.3 | 67 | 66 | 69 | 64 | 66 | 1077 | 1061 | 1096 | 1002 |
| Waterville, ME | ||||||||||||||
| April | 3.1 | 4.3 | 3.3 | 2.1 | 3.5 | 48 | 43 | 46 | 42 | 43 | 479 | 340 | 408 | 305 |
| May | 1.8 | 4.3 | 3.5 | 5.4 | 3.8 | 58 | 55 | 57 | 52 | 54 | 779 | 723 | 766 | 677 |
| June | 4.3 | 1.8 | 5.2 | 4.0 | 64 | 63 | 63 | 63 | 64 | 945 | 930 | 924 | 981 | |
| July | 2.3 | 3.6 | 0.6 | 4.2 | 3.6 | 72 | 71 | 72 | 71 | 69 | 1223 | 1213 | 1227 | 1168 |
| August | 3.7 | 6.3 | 3.7 | 6.7 | 3.5 | 69 | 69 | 71 | 67 | 68 | 1133 | 1134 | 1202 | 1088 |
| Alburgh, VT | ||||||||||||||
| April | 2.6 | 7.9 | 2.6 | 2.1 | 2.82 | 40 | 47 | 45 | 44 | 44.8 | 331 | 465 | 396 | 348 |
| May | 3.9 | 8.7 | 3.9 | 4.8 | 3.45 | 45 | 59 | 61 | 59 | 56.3 | 396 | 826 | 884 | 848 |
| June | 3.2 | 3.5 | 3.2 | 9.2 | 3.69 | 61 | 67 | 67 | 64 | 65.8 | 884 | 1088 | 1046 | 967 |
| July | 3.8 | 3.7 | 3.8 | 1.9 | 4.16 | 67 | 74 | 71 | 72 | 70.6 | 1046 | 1314 | 1221 | 1235 |
| August | 10.2 | 2.4 | 3.91 | 71 | 70 | 68 | 68.8 | 1221 | 1121 | 1112 | ||||
| Willsboro, NY | ||||||||||||||
| April | 2.8 | 6.6 | 2.8 | 2.1 | 2.8 | 46 | 46 | 46 | 45 | 45 | 411 | 423 | 411 | 383 |
| May | 4.4 | 7.8 | 4.4 | 8.7 | 3.5 | 62 | 58 | 62 | 61 | 56 | 435 | 809 | 435 | 890 |
| June | 3.2 | 2.8 | 3.2 | 9.9 | 3.7 | 68 | 66 | 68 | 67 | 66 | 917 | 1064 | 917 | 1034 |
| July | 3.8 | 1.8 | 3.8 | 4.5 | 4.2 | 73 | 73 | 73 | 74 | 71 | 1072 | 1277 | 1072 | 1253 |
| August | 2.9 | 5.8 | 2.9 | 3.1 | 3.9 | 72 | 70 | 72 | 69 | 69 | 1271 | 1181 | 1271 | 1161 |
† Bases on National Weather Service data from cooperative observer stations in close proximity to field trials available at http://www.ncdc.noaa.gov/crn/report. Historical averages are for 30 years (1981-2010) available at https://www.climate.gov/maps-data/dataset/1981-2010-climate-normals-data-table.
‡ Monthly averages not available due to missing data points.
# Base 32°F
Table 3. Plot management for the spring wheat variety trials in ME, VT, and NY in 2010-2013.
| Trial Location | ||||
|---|---|---|---|---|
| Old Town or Presque Isle†, ME |
Sidney, ME | Alburgh, VT | Willsboro, NY | |
| Soil type | ||||
| 2010 | Suffield silt loam | Buxton silt loam | Benson rocky silt loam | Kingsbury silt clay loam |
| 2011 | Buxton silt loam | |||
| 2012 | Stetson fine sandy loam | |||
| 2013 | Caribou gravelly loam | |||
| Previous crop | ||||
| 2010 | Soybeans | Silage corn | Grass sod | Soybeans |
| 2011 | Silage corn | High moisture ear corn | Winter wheat | Timothy/alfalfa sod |
| 2011 | Silage corn | High moisture ear corn | Sunflowers/grass sod | Winter wheat |
| 2013 | Potato | High moisture ear corn | Silage corn | Winter wheat |
| Pre-plant fertility source (rates are per acre) | ||||
| 2010 | Solid dairy manure | Liquid dairy manure | Grass sod plow down | Soybeans |
| 21 ton | 5333 gal | |||
| 2011 | Solid dairy manure | Liquid dairy manure | Poultry manure (2-3-2) | 3-yr Timothy/Alfalfa sod |
| 24 ton | 6900 gal | 2 ton | ||
| 2012 | Solid dairy manure | Solid dairy manure | Grass sod plow down | 3-yr Timothy/Alfalfa sod |
| 25 ton | 20 ton | |||
| 2013 | Chicken manure | Solid dairy manure | None | 3-yr Timothy/Alfalfa sod |
| 3-4 ton | 28 ton | |||
| Topdress nitrogen (rates are per acre) | ||||
| 2010 | None | None | None | None |
| 2011 | None | None | Pro-Gro, 50 lb N | None |
| 2012 | Chilean nitrate, 16 lb N | None | None | None |
| 2013 | None | None | None | None |
| Planting date | ||||
| 2010 | 26-Apr | 15-Apr | 21-Apr | 26-Apr |
| 2011 | 9-May | 3-May | 2-May | 13-May |
| 2012 | 12-Apr | 14-Apr | 6-Apr | 13-Apr |
| 2013 | 13-May | 2-May | 22-Apr | 23-Apr |
| Harvest date | ||||
| 2010 | 6-Aug | 30-Jul | 30-Jul | 2-Aug |
| 2011 | 19-Aug | 12-Aug | 17-Aug | 19-Aug |
| 2012 | 7-Aug | 31-Jul | 31-Jul | 8-Aug |
| 2013 | 29-Aug | 15-Aug | 5-Aug | 16-Aug |
† Trial location was in Presque Isle, ME in 2013
Table 4. Relative flowering time Flowering and plant height of spring wheat grown in ME, VT, and NY in 2010-2013.
| Relative Flowering Date |
Plant Height (in) |
|
|---|---|---|
| AC Barrie | Medium | 37 |
| AC Walton | Late | 40 |
| Ada | Medium | 29 |
| Advance | Medium | 31 |
| Barlow | Medium | 34 |
| Brick | Early | 36 |
| Faller | Medium | 33 |
| FBC Dylan | Medium | 33 |
| Forefront | Medium | 38 |
| Glenn | Medium | 35 |
| Helios | Medium | 36 |
| Jenna | Medium | 29 |
| Kaffé | Medium | 40 |
| Magog | Medium | 38 |
| McKenzie | Medium | 38 |
| Megantic | Medium | 43 |
| Oklee | Medium | 31 |
| Prosper | Medium | 34 |
| RB07 | Medium | 30 |
| Red Fife | Late | 43 |
| Roblin | Early | 36 |
| Sabin | Medium | 31 |
| Steele | Medium | 32 |
| Superb | Medium | 33 |
| Sy Rowyn | Medium | 29 |
| Sy Soren | Medium | 28 |
| Tom | Medium | 32 |
| Ulen | Medium | 31 |
| Yorkton‡ | Medium | 36 |
‡ Formerly 07SW04
Table 5. Yield of spring wheat grown in ME, VT, and NY in 2010-2013.
| Yield at 13.5% moisture (lbs/acre) | ||||||||||||||||||||
|---|---|---|---|---|---|---|---|---|---|---|---|---|---|---|---|---|---|---|---|---|
| Old Town or Presque Isle†, ME |
Sidney, ME | Alburgh, VT | Willsboro, NY | |||||||||||||||||
| 2010 | 2011 | 2012 | 2013† | Avg. | 2010 | 2011 | 2012 | 2013 | Avg. | 2010 | 2011 | 2012 | 2013 | Avg. | 2010 | 2011 | 2012 | 2013 | Avg. | |
| AC Barrie | 2077 | 2578 | 3796 | 2952 | 2851 | 1987 | 2606 | 2221 | 956 | 1943 | 845 | 711 | 3022 | 1090 | 1417 | 1864 | 736 | 2755 | 413 | 1442 |
| AC Walton | 2699 | 2736 | 4919 | — | 3451 | — | 3001 | 2377 | — | 2201 | 1222 | 847 | 3339 | 2783 | 2048 | 2872 | 534 | 3669 | 539 | 1903 |
| Ada | 2098 | 2917 | — | — | 2508 | 2382 | 3030 | — | — | 2706 | 1011 | 992 | 3733 | — | 1912 | 2215 | 1579 | 3488 | — | 2427 |
| Advance | — | — | — | 3857 | 3857 | — | — | — | 1553 | 1553 | — | — | — | 2046 | 2046 | — | — | — | 1322 | 1322 |
| Barlow | — | 2922 | 4324 | 3401 | 3549 | — | 3170 | 2530 | 1710 | 2470 | — | 978 | 3609 | 1819 | 2135 | — | 1604 | 3989 | 1987 | 2527 |
| Brick | — | 2748 | 4450 | 3212 | 3470 | — | 2763 | 2143 | 1615 | 2174 | — | 1102 | 3578 | 2363 | 2348 | — | 1744 | 3582 | 2047 | 2458 |
| Faller | 3575 | 3221 | 5086 | 3427 | 3827 | 3260 | 3653 | 2166 | 1878 | 2739 | 1580 | 965 | 3998 | 2503 | 2262 | 3235 | 1634 | 3981 | 1865 | 2679 |
| FBC Dylan | 2987 | 2900 | 4588 | — | 3492 | 2566 | 2945 | 2587 | — | 2699 | 1286 | 796 | 3168 | — | 1750 | 2202 | 1101 | 3227 | — | 2177 |
| Forefront | — | — | — | 3169 | 3169 | — | — | — | 1950 | 1950 | — | — | — | 2404 | 2404 | — | — | — | 2314 | 2314 |
| Glenn | 2334 | 2644 | 3948 | 3255 | 3045 | 2200 | 2695 | 1860 | 1434 | 2047 | 1063 | 730 | 3260 | 1474 | 1632 | 2001 | 1863 | 3864 | 1413 | 2285 |
| Helios | — | — | — | — | — | — | — | — | — | — | 1148 | 1353 | 3156 | — | 1886 | 2016 | 1165 | 3976 | — | 2386 |
| Jenna | — | 3338 | 4781 | 3848 | 3989 | — | 3355 | 2861 | 1602 | 2606 | — | 1168 | 3865 | 2341 | 2458 | — | 1437 | 3453 | 1547 | 2146 |
| Kaffé§ | — | — | — | — | — | — | — | — | — | — | 2009 | 1307 | 3919 | 1630 | 2216 | 2653 | 1153 | 3568 | 959 | 2083 |
| Magog | 2396 | 2695 | 4779 | 3969 | 3460 | 2765 | 3257 | 2849 | 1090 | 2490 | 1281 | 1013 | 4048 | 2032 | 2093 | 2582 | 500 | 3351 | 677 | 1777 |
| McKenzie | — | 2218 | 4135 | — | 3177 | — | 2508 | 2127 | — | 2318 | 1146 | 847 | 2191 | 1062 | 1311 | 2527 | 1593 | 3472 | 1738 | 2332 |
| Megantic | — | — | — | — | — | — | — | — | — | — | — | — | — | 1375 | 1375 | — | — | — | 1005 | 1005 |
| Oklee | 3353 | 3134 | 4361 | — | 3616 | 2943 | 2771 | 2291 | — | 2668 | 1130 | 813 | 3131 | — | 1691 | 2147 | 1190 | 2757 | — | 2031 |
| Prosper | — | — | — | 4044 | 4044 | — | — | — | 1714 | 1714 | — | — | — | 1919 | 1919 | — | — | — | 2143 | 2143 |
| RB07 | 2766 | 3047 | 4115 | 3419 | 3337 | 2716 | 3281 | 2303 | 1576 | 2469 | 1113 | 695 | 3776 | 2132 | 1929 | 2136 | 1526 | 3774 | 1339 | 2194 |
| Red Fife | 2036 | 2278 | 3368 | 2279 | 2490 | 1993 | 2529 | 2119 | 1347 | 1997 | 1083 | 788 | 2604 | 1057 | 1383 | 2325 | 477 | 2937 | 453 | 1548 |
| Roblin | 2523 | 2289 | 3921 | 2495 | 2807 | 2071 | 2793 | 2065 | 1600 | 2132 | 1097 | 758 | 3026 | 1416 | 1574 | 1838 | 686 | 3455 | 954 | 1733 |
| Sabin | 2986 | 2692 | 4393 | — | 3357 | 2920 | 3058 | 1911 | — | 2630 | 1247 | 940 | 2666 | — | 1618 | 2599 | 863 | 2882 | — | 2115 |
| Steele | 2829 | 2759 | 4653 | — | 3414 | 2643 | 3110 | 1777 | — | 2510 | 1222 | 749 | 3367 | — | 1779 | 2183 | 882 | 3260 | — | 2108 |
| Superb | 3168 | 2650 | 4440 | — | 3419 | 2807 | 2996 | 2190 | — | 2664 | 1297 | 1226 | 3658 | 1661 | 1961 | 2429 | 1536 | 3363 | 1129 | 2114 |
| Sy Rowyn | — | — | — | 3762 | 3762 | — | — | — | 1824 | 1824 | — | — | — | 2563 | 2563 | — | — | — | 1693 | 1693 |
| Sy Soren | — | — | — | 3565 | 3565 | — | — | — | 1719 | 1719 | — | — | 4294 | 2007 | 3151 | — | — | 3513 | 1485 | 2499 |
| Tom | 3684 | 3087 | 4488 | 3462 | 3680 | 3050 | 3179 | 3082 | 1992 | 2826 | 1298 | 1267 | 4159 | 2304 | 2257 | 1980 | 1627 | 3600 | 1296 | 2126 |
| Ulen | 2969 | 2816 | 4358 | — | 3381 | 2679 | 2755 | 2142 | — | 2525 | 1277 | 900 | 3755 | — | 1977 | 1916 | 1532 | 2817 | — | 2088 |
| Yorkton‡ | — | 2560 | 3963 | 2755 | 3093 | — | 2502 | 2140 | 1224 | 1955 | — | 799 | 3592 | 1582 | 1991 | — | 933 | 3263 | 482 | 1559 |
| Site Average |
2780 | 2773 | 4343 | 3366 | 3316 | 2599 | 2950 | 2287 | 1580 | 2354 | 1229 | 945 | 3402 | 1886 | 1866 | 2301 | 1213 | 3423 | 862 | 1950 |
| LSD (0.05) | 453 | 417 | 588 | 730 | — | 515 | 561 | 661 | 262 | — | 473 | 359 | 592 | 628 | — | 352 | 525 | 489 | 1308 | — |
†The trial was located in Old Town in 2010-2012 and in Presque Isle in 2013.
‡ Formerly 07SW04
Table 6. Protein concentration of spring wheat grown in ME, VT, and NY in 2010-2013.
| Protein at 12% moisture (%) | ||||||||||||||||||||
|---|---|---|---|---|---|---|---|---|---|---|---|---|---|---|---|---|---|---|---|---|
| Old Town or Presque Isle†, ME |
Sidney, ME | Alburgh, VT | Willsboro, NY | |||||||||||||||||
| 2010 | 2011 | 2012 | 2013 | Avg. | 2010 | 2011 | 2012 | 2013 | Avg. | 2010 | 2011 | 2012 | 2013 | Avg. | 2010 | 2011 | 2012 | 2013 | Avg. | |
| AC Barrie | 16.0 | 11.6 | 14.0 | 11.4 | 13.2 | 14.5 | 13.1 | 14.3 | 17.2 | 14.8 | 16.8 | 13.3 | 15.1 | 17.1 | 15.6 | 16.1 | 15.3 | 12.7 | 16.5 | 15.2 |
| AC Walton | 15.6 | 10.9 | 10.8 | — | 12.4 | — | 11.0 | 12.1 | — | 11.6 | 15.7 | 12.3 | 13.8 | 14.8 | 14.2 | 13.7 | 15.5 | 12.1 | 14.9 | 14.0 |
| Ada | 16.0 | 11.4 | — | — | 13.7 | 12.6 | 13.3 | — | — | 13.0 | 14.6 | 12.3 | 13.0 | — | 13.3 | 15.0 | 14.2 | 12.5 | — | 13.9 |
| Advance | — | — | — | 11.5 | 11.5 | — | — | — | 12.0 | 12.0 | — | — | — | 14.5 | 14.5 | — | — | — | 13.6 | 13.6 |
| Barlow | — | 11.3 | 13.0 | 11.8 | 12.0 | — | 13.5 | 13.4 | 14.4 | 13.8 | — | 13.0 | 14.1 | 15.3 | 14.1 | — | 15.3 | 12.9 | 14.2 | 14.1 |
| Brick | — | 10.5 | 13.2 | 11.6 | 11.8 | — | 12.1 | 13.0 | 13.6 | 12.9 | — | 13.8 | 14.0 | 14.7 | 14.2 | — | 15.5 | 12.7 | 14.9 | 14.4 |
| Faller | 14.9 | 10.8 | 10.9 | 10.6 | 11.8 | 12.2 | 11.0 | 11.4 | 12.9 | 11.9 | 14.4 | 11.0 | 12.9 | 14.7 | 13.3 | 14.4 | 13.9 | 11.4 | 15.4 | 13.8 |
| FBC Dylan | 14.6 | 10.5 | 12.3 | — | 12.5 | 11.7 | 11.2 | 11.3 | — | 11.4 | 13.8 | 12.3 | 13.6 | — | 13.2 | 14.1 | 13.8 | 11.4 | — | 13.1 |
| Forefront | — | — | — | 11.0 | 11.0 | — | — | — | 14.0 | 14.0 | — | — | — | 14.3 | 14.3 | — | — | — | 14.3 | 14.3 |
| Glenn | 16.4 | 12.0 | 14.7 | 11.4 | 13.6 | 15.4 | 13.8 | 13.8 | 14.3 | 14.3 | 16.0 | 12.5 | 14.9 | 16.4 | 14.9 | 17.0 | 15.6 | 14.1 | 14.1 | 15.2 |
| Helios | — | — | — | — | — | — | — | — | — | 16.0 | 13.8 | 14.3 | — | 14.7 | 17.3 | 14.3 | 12.6 | — | 14.7 | |
| Jenna | — | 10.9 | 13.3 | 12.5 | 12.2 | — | 11.7 | 13.0 | 13.1 | 12.6 | — | 13.0 | 13.9 | 14.3 | 13.7 | — | 13.9 | 11.7 | 14.5 | 13.4 |
| Kaffé§ | — | — | — | — | — | — | — | — | — | — | 13.7 | 11.3 | 12.0 | 14.3 | 12.8 | 14.2 | 12.9 | 11.1 | 14.5 | 13.2 |
| Magog | 15.6 | 10.5 | 11.9 | 9.7 | 11.9 | 12.6 | 12.1 | 12.7 | 15.4 | 13.2 | 15.9 | 13.0 | 13.1 | 15.1 | 14.3 | 14.9 | 15.0 | 12.6 | 15.3 | 14.5 |
| McKenzie | — | 10.9 | 12.7 | — | 11.8 | — | 11.8 | 12.2 | — | 12.0 | 15.3 | 11.8 | 13.1 | 15.6 | 13.9 | 15.3 | 14.7 | 11.9 | 15.1 | 14.3 |
| Megantic | — | — | — | — | — | — | — | — | — | — | — | — | — | 15.9 | 15.9 | — | — | — | 15.7 | 15.7 |
| Oklee | 15.7 | 11.5 | 13.7 | — | 13.6 | 12.5 | 12.6 | 13.7 | — | 12.9 | 15.6 | 13.5 | 14.6 | — | 14.6 | 16.1 | 14.8 | 12.9 | — | 14.6 |
| Prosper | — | — | — | 10.8 | 10.8 | — | — | — | 10.6 | 10.6 | — | — | — | 14.7 | 14.7 | — | — | — | 14.8 | 14.8 |
| RB07 | 15.8 | 11.4 | 13.4 | 12.2 | 13.2 | 14.3 | 12.7 | 13.1 | 14.3 | 13.6 | 15.2 | 12.5 | 13.7 | 14.7 | 14.0 | 15.8 | 14.3 | 12.3 | 13.9 | 14.1 |
| Red Fife | 16.4 | 12.2 | 11.2 | 10.4 | 12.5 | 14.2 | 12.4 | 12.2 | 12.5 | 12.8 | 16.2 | 12.8 | 13.6 | 14.9 | 14.4 | 15.3 | 14.4 | 12.5 | 14.3 | 14.1 |
| Roblin | 16.6 | 12.8 | 15.3 | 13.4 | 14.5 | 14.8 | 13.5 | 13.9 | 14.9 | 14.3 | 16.0 | 15.0 | 15.7 | 15.9 | 15.7 | 18.0 | 15.8 | 15.1 | 16.3 | 16.3 |
| Sabin | 15.7 | 10.9 | 12.3 | — | 13.0 | 12.0 | 11.9 | 12.1 | — | 12.0 | 16.9 | 13.0 | 13.6 | — | 14.5 | 14.7 | 14.5 | 11.6 | — | 13.6 |
| Steele | 15.8 | 11.7 | 13.7 | — | 13.7 | 13.7 | 12.6 | 12.6 | — | 13.0 | 15.2 | 13.3 | 13.9 | — | 14.1 | 16.2 | 15.2 | 12.4 | — | 14.6 |
| Superb | 16.0 | 11.7 | 13.4 | — | 13.7 | 13.4 | 13.0 | 12.6 | — | 13.0 | 15.0 | 13.5 | 13.4 | 16.1 | 14.5 | 16.0 | 14.5 | 13.0 | 15.5 | 14.8 |
| Sy Rowyn | — | — | — | 12.1 | 12.1 | — | — | — | 12.6 | 12.6 | — | — | — | 13.9 | 13.9 | — | — | — | 14.6 | 14.6 |
| Sy Soren | — | — | — | 12.4 | 12.4 | — | — | — | 14.3 | 14.3 | — | — | 14.1 | 15.5 | 14.8 | — | — | 13.3 | 15.4 | 14.3 |
| Tom | 14.6 | 10.7 | 13.8 | 10.7 | 12.5 | 13.2 | 13.1 | 12.7 | 12.9 | 13.0 | 13.6 | 13.3 | 14.4 | 15.0 | 14.1 | 15.6 | 14.7 | 12.7 | 13.3 | 14.1 |
| Ulen | 16.0 | 11.9 | 14.6 | — | 14.2 | 14.4 | 13.2 | 13.5 | — | 13.7 | 15.3 | 13.0 | 14.1 | — | 14.1 | 16.7 | 14.6 | 12.3 | — | 14.5 |
| Yorkton‡ | — | 11.7 | 14.1 | 12.0 | 12.6 | — | 13.6 | 14.7 | 17.8 | 15.4 | — | 13.3 | 15.0 | 16.4 | 14.9 | — | 16.6 | 14.3 | 17.1 | 16.0 |
| Site Average |
15.7 | 11.3 | 13.1 | 11.5 | 12.9 | 13.4 | 12.5 | 12.9 | 14.0 | 13.2 | 15.3 | 12.9 | 13.9 | 15.0 | 14.3 | 15.6 | 14.8 | 12.6 | 15.0 | 14.5 |
| LSD (0.05) | 0.8 | 0.6 | 1.0 | 0.8 | — | 1.4 | 0.8 | 1.0 | 1.0 | — | — | 1.3 | 0.8 | 1.0 | — | — | 0.8 | 0.8 | 0.9 | — |
† The trial was located in Old Town in 2010-2012 and in Presque Isle in 2013.
‡ Formerly 07SW04
Table 7. Test weight of spring wheat grown in ME, VT, and NY in 2010-2013.
| Test Weight (lbs/bu) | |||||||||||||||||||
|---|---|---|---|---|---|---|---|---|---|---|---|---|---|---|---|---|---|---|---|
| Old Town or Presque Isle†, ME |
Sidney, ME | Alburgh, VT | Willsboro, NY | ||||||||||||||||
| 2010 | 2011 | 2012 | 2013 | Average | 2010 | 2011 | 2012 | 2013 | Average | 2010 | 2011 | 2012 | 2013 | Average | 2010 | 2011 | 2012 | Average | |
| AC Barrie | 57 | 56 | 61 | 60 | 58 | 59 | 58 | 59 | 51 | 57 | 55 | 55 | 61 | 57 | 57 | 55 | 57 | 59 | 57 |
| AC Walton | 54 | 53 | 60 | — | 56 | — | 56 | 54 | — | 55 | 52 | 55 | 57 | 53 | 54 | 54 | 56 | 57 | 56 |
| Ada | 57 | 58 | — | — | 58 | 60 | 58 | — | — | 59 | 56 | 56 | 62 | — | 58 | 60 | 57 | 60 | 59 |
| Advance | — | — | — | 61 | 61 | — | — | — | 52 | 52 | — | — | — | 57 | 57 | — | — | — | — |
| Barlow | — | 58 | 64 | 61 | 61 | — | 59 | 60 | 55 | 58 | — | 56 | 61 | 58 | 58 | — | 57 | 60 | 59 |
| Brick | — | 58 | 63 | 61 | 61 | — | 59 | 60 | 54 | 58 | — | 55 | 62 | 57 | 58 | — | 57 | 59 | 58 |
| Faller | 59 | 57 | 62 | 60 | 59 | 59 | 57 | 58 | 53 | 57 | 56 | 55 | 61 | 56 | 57 | 57 | 56 | 58 | 57 |
| FBC Dylan | 59 | 56 | 62 | 59 | 59 | 58 | 59 | 59 | 56 | 56 | 61 | — | 58 | 57 | 57 | 59 | 58 | ||
| Forefront | — | — | — | 60 | 60 | — | — | — | 54 | 54 | — | — | — | 57 | 57 | — | — | — | — |
| Glenn | 60 | 59 | 64 | 61 | 61 | 61 | 59 | 60 | 55 | 59 | 55 | 56 | 64 | 56 | 58 | 59 | 58 | 60 | 59 |
| Helios | — | — | — | — | — | — | — | — | — | — | 55 | 56 | 60 | — | 57 | 57 | 58 | 58 | 58 |
| Jenna | — | 55 | 61 | 60 | 59 | — | 56 | 57 | 51 | 55 | — | 56 | 61 | 54 | 57 | — | 57 | 58 | 58 |
| Kaffé§ | — | — | — | — | — | — | — | — | — | — | 56 | 56 | 60 | 54 | 56 | 58 | 57 | 57 | 57 |
| Magog | 56 | 56 | 61 | 60 | 58 | 59 | 57 | 58 | 50 | 56 | 53 | 56 | 61 | 56 | 56 | 54 | 55 | 59 | 56 |
| McKenzie | — | 57 | 61 | — | 59 | — | 57 | 58 | — | 58 | 56 | 55 | 61 | 55 | 57 | 58 | 57 | 57 | 57 |
| Megantic | — | — | — | — | — | — | — | — | — | — | — | — | — | 59 | 59 | — | — | — | — |
| Oklee | 59 | 58 | 63 | — | 60 | 60 | 59 | 59 | — | 59 | 56 | 56 | 61 | — | 58 | 58 | 57 | 58 | 58 |
| Prosper | — | — | — | 60 | 60 | — | — | — | 53 | 53 | — | — | — | 54 | 54 | — | — | — | — |
| RB07 | 56 | 56 | 61 | 61 | 58 | 58 | 57 | 59 | 49 | 56 | 57 | 55 | 60 | 55 | 57 | 58 | 58 | 57 | 58 |
| Red Fife | 57 | 55 | 60 | — | 57 | 57 | 56 | 54 | 52 | 55 | 51 | 56 | 61 | 53 | 55 | 50 | 55 | 59 | 55 |
| Roblin | 56 | 54 | 60 | 59 | 57 | 58 | 56 | 58 | 50 | 56 | 51 | 55 | 59 | 55 | 55 | 56 | 57 | 58 | 57 |
| Sabin | 57 | 57 | 61 | — | 58 | 58 | 58 | 58 | — | 58 | 55 | 56 | 59 | — | 57 | 57 | 57 | 57 | 57 |
| Steele | 59 | 56 | 62 | — | 59 | 59 | 58 | 58 | — | 58 | 56 | 56 | 62 | — | 58 | 58 | 57 | 58 | 58 |
| Superb | 57 | 55 | 60 | — | 57 | 60 | 57 | 58 | — | 58 | 53 | 55 | 61 | 55 | 56 | 56 | 57 | 58 | 57 |
| Sy Rowyn | — | — | — | 61 | 61 | — | — | — | 52 | 52 | — | — | — | 57 | 57 | — | — | — | — |
| Sy Soren | — | — | — | 61 | 61 | — | — | — | 54 | 54 | — | — | 62 | 56 | 59 | — | — | 59 | 59 |
| Tom | 59 | 58 | 62 | 61 | 60 | 60 | 58 | 59 | 54 | 58 | 58 | 56 | 62 | 56 | 58 | 58 | 58 | 59 | 58 |
| Ulen | 57 | 56 | 60 | — | 58 | 59 | 57 | 58 | — | 58 | 57 | 55 | 61 | — | 58 | 57 | 57 | 59 | 58 |
| Yorkton‡ | — | — | 61 | 60 | 60 | — | 58 | 59 | 52 | 56 | — | 55 | 61 | 55 | 57 | — | 57 | 59 | 58 |
| Site Average | 57 | 56 | 61 | 60 | 59 | 59 | 57 | 58 | 52 | 57 | 53 | 55 | 61 | 56 | 56 | 57 | 57 | 58 | 57 |
| LSD (0.05) | 1 | 0.7 | 0.5 | 0.5 | — | 1 | 0.8 | 1.2 | 1.4 | — | 3.4 | NS | 0.9 | 1.9 | — | 1.4 | 1.4 | 1.3 | — |
† The trial was located in Old Town in 2010-2012 and in Presque Isle in 2013.
‡ Formerly 07SW04
Table 8. Falling number of spring wheat grown in ME, VT, and NY in 2010-2013.
| Falling Number at 14% Moisture (seconds) | |||||||||||||
|---|---|---|---|---|---|---|---|---|---|---|---|---|---|
| Old Town or Presque Isle†, ME |
Sidney, ME | Alburgh, VT | Willsboro, NY | ||||||||||
| 2010 | 2011 | 2012 | 2011 | 2012 | 2010 | 2011 | 2012 | 2013 | 2010 | 2011 | 2012 | 2013 | |
| AC Barrie | 464 | 358 | 491 | 417 | 461 | 394 | 379 | 453 | 396 | 461 | 441 | 447 | 339 |
| AC Walton | 409 | 368 | 444 | 364 | 430 | 357 | 312 | 434 | 361 | 362 | 386 | 431 | 313 |
| Ada | 532 | 366 | — | 419 | — | 404 | 409 | 464 | — | 448 | 473 | 481 | — |
| Advance | — | — | — | — | — | — | — | — | 275 | — | — | — | 313 |
| Barlow | — | 261 | 398 | 372 | 371 | — | 305 | 399 | 261 | — | 390 | 395 | 322 |
| Brick | — | 326 | 423 | 385 | 437 | — | 282 | 410 | 326 | — | 353 | 357 | 343 |
| Faller | 413 | 358 | 453 | 371 | 440 | 341 | 332 | 432 | 344 | 358 | 393 | 417 | 333 |
| FBC Dylan | 502 | 306 | 456 | 343 | 486 | 403 | 345 | 479 | — | 435 | 460 | 476 | — |
| Forefront | — | — | — | — | — | — | — | 408 | 314 | — | — | 440 | 346 |
| Glenn | 388 | 329 | 422 | 401 | 403 | 334 | 323 | 379 | 282 | 335 | 386 | 393 | 333 |
| Helios | — | — | — | — | — | 414 | 384 | 485 | — | 461 | 473 | 465 | — |
| Jenna | — | 290 | 472 | 360 | 411 | — | 232 | 422 | 262 | — | 401 | 371 | 289 |
| Kaffé§ | — | — | — | — | — | 288 | 235 | 374 | 297 | 334 | 233 | 322 | 117 |
| Magog | 511 | 388 | 520 | 471 | 520 | 384 | 362 | 464 | 394 | 419 | 432 | 474 | 347 |
| McKenzie | — | 360 | 470 | 401 | 442 | 377 | 375 | 421 | 345 | 379 | 412 | 407 | 362 |
| Megantic | — | — | — | — | — | — | — | 393 | — | — | — | 347 | |
| Oklee | 478 | 319 | 474 | 374 | 475 | 362 | 310 | 425 | — | 408 | 387 | 432 | — |
| Prosper | — | — | — | — | — | — | — | — | 326 | — | — | — | 344 |
| RB07 | 408 | 330 | 394 | 300 | 421 | 344 | 298 | 401 | 276 | 380 | 398 | 377 | 305 |
| Red Fife | 392 | 317 | 372 | 333 | 383 | 305 | 300 | 377 | 253 | 327 | 359 | 359 | 251 |
| Roblin | 403 | 210 | 467 | 268 | 434 | 358 | 265 | 389 | 344 | 400 | 381 | 382 | 282 |
| Sabin | 383 | 389 | 458 | 478 | 496 | 351 | 332 | 468 | — | 428 | 437 | 483 | — |
| Steele | 414 | 293 | 392 | 399 | 423 | 319 | 310 | 410 | — | 371 | 378 | 408 | — |
| Superb | 440 | 358 | 395 | 400 | 501 | 345 | 343 | 433 | 309 | 398 | 415 | 400 | 320 |
| Sy Rowyn | — | — | — | — | — | — | — | — | 391 | — | — | — | 360 |
| Sy Soren | — | — | — | — | — | — | — | 432 | 318 | — | — | 430 | 347 |
| Tom | 469 | 374 | 445 | 480 | 449 | 381 | 380 | 450 | 403 | 434 | 445 | 448 | 361 |
| Ulen | 367 | 264 | 295 | 335 | 340 | 288 | 372 | 393 | — | 317 | 372 | 375 | — |
| Yorkton‡ | — | 391 | 479 | 444 | 500 | — | 413 | 461 | 392 | — | 431 | 462 | 343 |
† The trial was located in Old Town in 2010-2012 and in Presque Isle in 2013.
‡ Formerly 07SW04
Table 9. Levels of the deoxynivalenol mycotoxin (DON) in spring wheat grown in ME, VT, and NY in 2010-2013.
| DON (ppm) | ||||||||||||||||
|---|---|---|---|---|---|---|---|---|---|---|---|---|---|---|---|---|
| Old Town or Presque Isle†, ME |
Sidney, ME | Alburgh, VT | Willsboro, NY | |||||||||||||
| 2010 | 2011 | 2012 | 2013 | 2010 | 2011 | 2012 | 2013 | 2010 | 2011 | 2012 | 2013 | 2010 | 2011 | 2012 | 2013 | |
| AC Barrie | 0.8 | 2.2 | < | < | < | < | 0.5 | 4.5 | 3.3 | < | < | 3.7 | < | < | < | 1.4 |
| AC Walton | 2.6 | 1.7 | 1.4 | — | — | < | 1.5 | — | 2.1 | < | < | 5.5 | < | < | < | 1.4 |
| Ada | 1.6 | 4.1 | — | — | 0.6 | 1.0 | — | — | 3.3 | < | < | — | 0.8 | < | < | — |
| Advance | — | — | — | < | — | — | — | 4.7 | — | — | — | 5.2 | — | — | — | 1.9 |
| Barlow | — | 3.4 | 1.0 | < | — | 1.5 | 1.1 | 5.0 | — | < | 0.6 | 5.0 | — | < | < | 2.0 |
| Brick | — | 1.8 | 0.6 | < | — | 0.7 | < | 3.6 | — | < | < | 6.2 | — | < | < | 2.0 |
| Faller | 1.0 | 1.8 | 0.5 | < | 0.6 | 0.5 | 0.6 | 7.0 | 2.3 | < | < | 3.6 | 0.7 | < | < | 1.8 |
| FBC Dylan | 0.5 | 4.1 | 0.7 | — | < | 0.6 | 0.6 | — | 2.8 | < | 0.6 | — | 0.6 | < | < | |
| Forefront | — | — | — | < | — | — | — | 4.2 | — | — | — | 4.2 | — | — | — | 1.5 |
| Glenn | < | 1.8 | 0.7 | < | < | 0.6 | 0.8 | 4.1 | 2.0 | < | < | 6.1 | 0.6 | < | 0.6 | 1.4 |
| Helios | — | — | — | — | — | — | — | — | 2.3 | < | < | — | 0.6 | < | < | — |
| Jenna | — | 4.2 | 1.6 | 0.8 | — | 1.0 | 4.0 | 3.4 | — | < | < | 6.0 | — | < | < | 2.6 |
| Kaffé§ | — | — | — | — | — | — | — | — | 4.1 | < | < | 8.0 | * | < | < | 2.7 |
| Magog | 1.3 | 1.7 | 0.7 | < | 0.5 | < | 1.0 | 5.0 | 3.1 | < | < | 4.9 | * | < | < | 1.0 |
| McKenzie | — | 1.5 | 1.5 | — | — | < | 1.9 | — | 2.2 | < | < | 4.0 | 0.5 | < | < | 1.9 |
| Megantic | — | — | — | — | — | — | — | — | — | — | — | 2.8 | — | — | — | 1.5 |
| Oklee | 1.0 | 4.1 | 1.1 | — | < | 0.8 | 0.9 | — | 3.8 | 0.5 | 0.7 | — | 0.9 | < | < | — |
| Prosper | — | — | — | < | — | — | — | 2.8 | — | — | — | 5.2 | — | — | — | 1.8 |
| RB07 | 0.8 | 3.6 | 0.7 | < | 0.6 | 0.7 | 0.5 | 7.4 | 2.4 | < | 0.6 | 3.6 | 0.6 | < | 0.5 | 1.3 |
| Red Fife | < | 1.5 | 1.5 | 5.3 | < | 1.1 | 1.5 | 4.5 | 2.1 | < | < | 4.1 | * | < | < | 1.6 |
| Roblin | 0.7 | 3.8 | 0.5 | < | < | 0.8 | 0.5 | 6.5 | 2.3 | 0.6 | 0.5 | 8.5 | * | < | < | 4.1 |
| Sabin | < | 1.1 | < | — | < | 0.5 | < | — | 1.6 | < | < | — | * | < | < | — |
| Steele | 1.2 | 3.9 | 1.5 | — | 0.5 | 1.1 | 2.7 | — | 3.4 | < | 0.6 | — | 1.3 | < | < | — |
| Superb | 1.9 | 5.1 | 4.2 | — | 0.7 | 2.0 | 2.6 | — | 4.9 | < | 0.7 | 7.0 | 2.1 | < | < | 2.4 |
| Sy Rowyn | — | — | — | < | — | — | — | 2.2 | — | — | — | 3.2 | — | — | — | 1.2 |
| Sy Soren | — | — | — | < | — | — | — | 3.7 | — | — | < | 4.9 | — | — | < | 1.3 |
| Tom | 1.2 | 2.4 | 0.7 | < | < | < | 0.7 | 4.8 | 1.7 | < | < | 4.1 | 0.8 | < | < | 1.3 |
| Ulen | 2.5 | 4.4 | 1.7 | — | 0.5 | 0.9 | 2.1 | — | 3.1 | < | 0.7 | — | 0.7 | < | < | — |
| Yorkton‡ | — | 1.3 | 0.5 | < | — | < | < | 3.5 | — | < | < | 3.8 | — | < | < | 0.9 |
| Site Average | 1.1 | 2.8 | 1.1 | 0.5 | < | 0.8 | 1.2 | 4.5 | 2.8 | < | < | 5.0 | 0.7 | < | < | 1.8 |
† The trial was located in Old Town in 2010-2012 and in Presque Isle in 2013.
‡ Formerly 07SW04
< = < 0.05
Table 10. Bake test results for select spring wheat varieties grown in ME, VT, and NY in 2012.
| Flour quality characteristics | ||||
|---|---|---|---|---|
| Variety | Protein† | Test wt | Falling Number | Baking Performance |
| (%) | (lbs/bu) | (seconds) | (Notes from test bakers) | |
| Barlow | 13.0 | 64 | 398 | Great bread |
| BR07 | 13.4 | 61 | 394 | Great bread |
| Faller | 12.9 | 61 | 432 | Strong, excellent volume, great flavor |
| Glenn | 14.8 | 64 | 422 | Excellent volume, great crumb |
| Magog | 13.1 | 61 | 464 | Excellent crumb and volume, good flavor |
| McKenzie | 13.1 | 61 | 421 | Good flavor, not great crumb |
| RB07 | 13.4 | 61 | 394 | Great bread |
| Red Fife | 13.6 | 61 | 377 | Slightly lower volume, less than perfect texture |
| Roblin | 15.3 | 60 | 467 | Great bread |
| Sy Soren | 14.1 | 62 | 432 | Not great crumb and flavor |
| Tom | 13.8 | 62 | 445 | Low volume, overly extensible as dough |
| Yorkton | 14.1 | 62 | 479 | Slightly lower volume, good flavor |
† 12% moisture