2010-2013 Organic Winter Wheat Variety Trial Results – Maine & Vermont
2010-2013 Organic Winter Wheat Variety Trial Results – Maine & Vermont (PDF)
Ellen Mallory, Heather Darby, Thomas Molloy, Erica Cummings
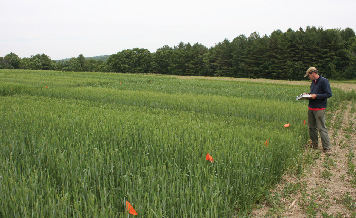
Bread wheat is a new crop option for farmers in New England due to increasing consumer demand for locally grown food. In 2010, the University of Maine and University of Vermont began a series of trials evaluating varieties of hard red wheat to identify those that perform well in Northern New England under organic production. This publication presents results for winter wheat varieties tested from 2010 through 2013. Separate publications of each year’s full results for both spring and winter wheat variety trials are available online.
This collaborative work was funded by a grant from the USDA Organic Agriculture Research and Extension Initiative to improve bread wheat production in our region.
TRIAL DESIGN AND VARIETIES
Trials were established each year at four locations in Northern New England: Alburgh, VT; Old Town, ME; Athens or Houlton, ME; and Willsboro, NY. The experimental design was a randomized complete block with four replications, which means that each variety was planted in four separate plots at each location. All of the varieties evaluated from 2010 to 2013 are listed in Table 1. Over the course of the trials, some varieties were added as new ones became available and some varieties were removed if they were found to be unsuitable for our region (ex., highly susceptible to Fusarium head blight) or for bread flour markets (ex., low grain protein levels). The results for varieties that were dropped from our trials can be found in previous years’ reports.
Table 1. Winter wheat varieties planted in ME, VT, and NY in 2010-2013.
| Year Grown | |||||
|---|---|---|---|---|---|
| Variety | Origin and Year of Release† | 2010 | 2011 | 2012 | 2013 |
| AC Morley | Advantage Seeds, Canada | x | x | x | x |
| Alice§ | SDAES‡, 2006 | x | x | ||
| Alliance | NAES, 1993 | x | x | ||
| Anton§ | NAES, USDA-ARS, 2007 | x | |||
| Appalachian White§ | USDA-ARS, 2009 | x | x | x | |
| Arapahoe | NAES, 1988 | x | x | x | x |
| Banatka | Heritage Grain Conservancy, MA | x | x | x | |
| Bauermeister | WAES, 2005 | x | |||
| Bezbanat | Heritage Grain Conservancy, MA | x | |||
| Borden# | Semican, Canada, 1983 | x | x | x | x |
| Camelot | NAES, USDA-ARS, 2008 | x | x | x | x |
| Expedition | SDAES, 2002 | x | x | x | x |
| Harvard | C&M Seeds, ON, 2003 | x | x | x | x |
| Ideal | SDAES, 2011 | x | |||
| Jerry | NAES, 2001 | x | x | x | x |
| Mace | NAES, USDA-ARS, 2007 | x | x | ||
| Maxine | C&M seeds, Canada, 2001 | x | x | x | x |
| MDM§ | WAES, 2005 | x | |||
| Millennium | NAES, USDA-ARS, SDAES, 1999 | x | x | x | x |
| NuEast | USDA-ARS, 2009 | x | x | x | |
| Overland | NAES, USDA-ARS, 2007 | x | x | x | x |
| Redeemer | Canada, 2008 | x | x | x | x |
| Robidoux | NAES, USDA-ARS, WAES, 2010 | x | |||
| Roughrider | NDAES, 1975 | x | x | x | |
| Sherman≠ | OR, 1928 | x | x | x | |
| Wahoo | NAES, USDA-ARS, WAES, 2001 | x | x | ||
| Warthog | Semican, Canada, 2001 | x | x | x | x |
| Wesley | NAES, SDAES, WARC, 2000 | x | x | ||
| Zorro | Canada | x | x | x | x |
| † Year of release not always available. ‡ Abbreviations: OR = Oregon, NAES = Nebraska Agric. Expt. Station, NDAES = North Dakota Agric. Expt. Station, SDAES = South Dakota Agric. Expt. Station, USDA-ARS = United States Dept. of Agric. Agricultural Research Service, WAES = Washington Agric. Expt. Station. • Hard white # Medium hard red ≠ Soft white |
|||||
WEATHER CONDITIONS
Seasonal precipitation and temperature were recorded at or near the trial locations. The Alburgh, VT, Old Town, ME, and Willsboro, NY locations had weather stations in close proximity to the trial sites. The Athens, ME and Houlton, ME sites had stations within 25 and 5 miles, respectively. Weather conditions varied greatly from year to year, affecting the overall development and quality of the wheat (Table 2).
Weather conditions in 2010 were ideal for growing winter wheat. Mild conditions throughout winter and spring pushed wheat development 1-2 weeks ahead of normal. Except for June, the pattern of above average temperatures and below average rainfall continued through the growing season.
In 2011, fall weather conditions for planting and early growth were good at all sites. In Houlton, snow cover was inconsistent and temperatures were above normal in early winter. Spring-time precipitation was above normal, especially at the VT and NY sites where rainfall for both April and May was about 5 inches above normal. Summer temperatures were slightly cooler than normal in ME and slightly warmer than usual at the VT and NY sites. Summer precipitation levels were normal or slightly below at all sites.
A very mild winter and spring in 2012 led to excellent growing conditions for winter wheat. Spring-time conditions were substantially warmer and somewhat drier than usual allowing for good early growth of winter wheat. The VT and NY locations also experienced above average temperatures during the middle and later part of the growing season. In ME, precipitation was above average in June prior to and during wheat flowering and conditions were warmer and drier than average during grain fill and harvest.
Weather conditions proved challenging in 2013 at all sites. In ME, several severe freeze/thaw cycles occurred during the winter leading to icing in areas of the Old Town, Me location. The lack of consistent snow cover in conjunction with cold conditions at the Houlton, ME location caused almost complete winter-kill and subsequent discontinuation of this site. Conditions improved at the Old Town, ME site with normal temperatures and only June experiencing above normal precipitation levels. At the VT and NY sites starting in late May through June, precipitation levels were well above normal with these sites receiving two times the average rainfall for the month of June. July precipitation levels returned to normal at these sites.
Table 2. Precipitation, temperature, and growing degree days in ME, VT, and NY in 2010-2013.†
| Site and Month | Total Precipitation (in.) | 30 Year Average | Average Temperature (°F) | 30 Year Average | Growing Degree Days # | |||||||||
|---|---|---|---|---|---|---|---|---|---|---|---|---|---|---|
| 2010 | 2011 | 2012 | 2013 | 1981 – 2010 | 2010 | 2011 | 2012 | 2013 | 1981 – 2010 | 2010 | 2011 | 2012 | 2013 | |
| Old Town, ME | ||||||||||||||
| September‡ | 1.4 | 4.8 | 1.9 | 8.0 | 3.8 | 56 | 60 | 61 | 57 | 57 | 700 | 839 | 864 | 730 |
| October‡ | 5.6 | 4.7 | 4.3 | 7.0 | 4.0 | 43 | 47 | 49 | 50 | 46 | 334 | 440 | 514 | 545 |
| November‡ | 4.2 | 4.5 | 2.6 | 1.6 | 4.4 | 39 | 36 | 41 | 33 | 36 | 207 | 165 | 268 | 110 |
| March | 4.6 | 4.1 | 2.0 | 2.6 | 4.1 | 37 | 30 | 36 | 33 | 30 | 195 | 67 | 200 | 85 |
| April | 2.3 | 5.7 | 3.7 | 1.4 | 3.8 | 46 | 42 | 44 | 40 | 42 | 426 | 294 | 356 | 229 |
| May | 1.9 | 3.8 | 4.3 | 4.2 | 3.9 | 56 | 54 | 55 | 54 | 53 | 726 | 680 | 707 | 667 |
| June | 4.0 | 4.2 | 6.0 | 6.0 | 4.1 | 62 | 61 | 61 | 61 | 62 | 857 | 844 | 867 | 855 |
| July | 2.2 | 2.1 | 1.0 | 4.4 | 3.6 | 71 | 69 | 69 | 69 | 68 | 1182 | 1127 | 1114 | 1104 |
| Houlton or Athens, ME | ||||||||||||||
| September‡ | 0.9 | 5.0 | 3.4 | – | 3.4 | 59 | 58 | 59 | – | 55 | 808 | 781 | 796 | – |
| October‡ | 6.1 | 3.6 | 3.3 | – | 3.7 | 44 | 44 | 47 | – | 43 | 385 | 374 | 461 | – |
| November‡ | 6.1 | 4.9 | 1.7 | – | 4.0 | 41 | 33 | 38 | – | 33 | 263 | 126 | 225 | – |
| March | 5.1 | 5.2 | 1.5 | – | 2.6 | 38 | 26 | 33 | – | 26 | 205 | 39 | 154 | – |
| April | 3.1 | 3.0 | 3.0 | – | 3.9 | 48 | 38 | 42 | – | 39 | 479 | 205 | 297 | – |
| May | 1.8 | 5.9 | 3.5 | – | 3.3 | 58 | 52 | 53 | – | 51 | 779 | 604 | 637 | – |
| June | 4.3 | 5.3 | 11.5 | – | 3.7 | 64 | 60 | 60 | – | 60 | 945 | 836 | 844 | – |
| July | 2.3 | 4.6 | 0.6 | – | 3.7 | 72 | 66 | 68 | – | 66 | 1223 | 1056 | 1098 | – |
| Alburgh, VT | ||||||||||||||
| September‡ | 4.0 | 4.3 | 5.6 | 5.4 | 3.6 | 58 | 64 | 63 | 61 | 61 | 771 | 991 | 932 | 896 |
| October‡ | 5.2 | 6.7 | 3.5 | 4.1 | 3.6 | 44 | 51 | 50 | 52 | 48 | 396 | 578 | 978 | 652 |
| November‡ | § | 2.9 | 1.4 | § | 3.1 | § | 40 | 43 | § | 39 | § | 243 | 344 | § |
| March | 2.8 | 3.4 | 1.5 | 1.0 | 2.2 | 38 | 33 | 40 | 32 | 31 | 229 | 144 | 331 | 89 |
| April | 2.8 | 7.9 | 2.6 | 2.1 | 2.8 | 49 | 47 | 45 | 44 | 45 | 521 | 465 | 396 | 348 |
| May | 0.9 | 8.7 | 3.9 | 4.8 | 3.5 | 60 | 59 | 61 | 59 | 56 | 854 | 826 | 884 | 848 |
| June | 4.6 | 3.5 | 3.2 | 9.2 | 3.7 | 66 | 67 | 67 | 64 | 66 | 1019 | 1088 | 1046 | 967 |
| July | 4.3 | 3.7 | 3.8 | 1.9 | 4.2 | 74 | 74 | 71 | 72 | 71 | 1305 | 1314 | 1221 | 1235 |
| Willsboro, NY | ||||||||||||||
| September‡ | 0.5 | 2.7 | 6.1 | 5.4 | 3.6 | 60 | 62 | 64 | 62 | 61 | 816 | 909 | 964 | 896 |
| October‡ | 1.6 | 4.1 | 3.4 | 5.0 | 3.6 | 47 | 49 | 50 | 53 | 48 | 427 | 518 | 566 | 648 |
| November‡ | § | 2.7 | 1.4 | § | 3.1 | § | 39 | 43 | § | 39 | § | 236 | 368 | § |
| March | 3.4 | 1.1 | 1.0 | 2.1 | 2.2 | 39 | 30 | 43 | 33 | 31 | 239 | 104 | 411 | 25 |
| April | 2.1 | 6.6 | 2.8 | 2.1 | 2.8 | 50 | 46 | 46 | 45 | 45 | 532 | 423 | 435 | 383 |
| May | 1.1 | 7.8 | 4.4 | 8.7 | 3.5 | 60 | 58 | 62 | 61 | 56 | 876 | 809 | 917 | 890 |
| June | 4.8 | 2.8 | 3.2 | 9.9 | 3.7 | 66 | 66 | 68 | 67 | 66 | 1004 | 1064 | 1072 | 1034 |
| July | 2.4 | 1.8 | 3.8 | 4.5 | 4.2 | 74 | 73 | 73 | 74 | 71 | 1294 | 1277 | 1271 | 1253 |
| †Bases on National Weather Service data from cooperative observer stations in close proximity to field trials available at http://www.ncdc.noaa.gov/crn/report. Historical averages are for 30 years (1981-2010) available at https://www.ncdc.noaa.gov/cdo-web/datatools/normals. ‡ From the previous year. • Monthly averages not available due to missing data points. # Base 32°F |
||||||||||||||
CULTURAL PRACTICES
Trial plots were managed following practices similar to those used by farmers in New England (Table 3).
University of Maine Rogers Farm – Old Town, ME – Plots were moldboard plowed in early to mid-September prior to manure application. Pre-plant fertility was solid dairy manure applied with a targeted application rate of 70 lbs of available nitrogen (N) per acre. The plots were then harrowed to work in the manure and prepare a seedbed. Planting was done with an Almaco cone seeder with 6.5-inch row spacing with a targeted seeding rate of 33 live seeds per square foot, which corresponds to 1.4 millions live seeds per acre. In 2012 and 2013 the plots were topdressed with Chilean nitrate at 100 lbs per acre (16 lbs of nitrogen per acre) when the wheat was in the late tillering stage. Grain was harvested using a Wintersteiger Classic plot combine. Harvest area was 4’ x 33’.
Sites Farm – Athens, ME (2010) – Plot were moldboard plowed in early September. Poultry manure was applied at a rate of 4 tons per acre (approximately 70 lbs available N) and immediately incorporated with a disk and spike tooth harrow. An Almaco cone seeder with 6.5-inch row spacing was used to plant the wheat with a targeted seeding rate of 33 live seeds per square foot. The plots were harvested using a Wintersteiger Classic plot combine. The harvest area was 4’ x 33’.
Nature Circle Farm – Houlton, ME (2011 – 2013) – A chisel plow was used to prepare the plots prior to fertility application. Dehydrated pelletized poultry manure (“Nutri-Wave” (4-1-2); Envirem Technologies Inc.) was applied pre-plant at 800 lbs per acre. A spring tine harrow was used to incorporate the manure and prepare a seedbed. The plots were seeded with an Almaco cone seeder with a 6.5-inch row spacing at target rates of 33 live seeds per square foot in 2011 and 41 live seeds per square foot in 2012 and 2013. In the early spring the plots received a topdress application of Nutri-wave at a rate of 3000 lbs per acre. Nutri-wave N was assumed to be 50% available for both pre-plant and topdress applications. The plots were harvested with a Wintersteiger Classic plot combine. The harvest area was 4’x33”. In 2013, the plots were discontinued in the spring due to icing and winterkill.
Borderview Research Farm – Alburgh, VT – For the 2010 trials, the plot areas were plowed the prior spring to kill and incorporate a perennial forage stand and were disked and spike-tooth harrowed throughout the summer prior to planting. The estimated nitrogen availability from the sod plow down was 65-75 lbs per acre. In 2011, 2012 and 2013 where the previous crop was spring wheat, the plots were plowed in the fall just prior to planting. In 2011, the pre-plant fertility source was composted poultry manure applied at a rate to supply an estimated 70 lbs per acre of available nitrogen. In 2012 and 2013, no pre-plant fertility was applied. In 2012, a topdress application of a 1:1 blend of Pro-Booster and Pro-Gro was applied in the spring at a rate of 1000 lbs per acre. In all years, wheat was seeded using an eight-row Kincaid Cone Seeder with 6-inch row spacing at a rate of 32 live seeds per square foot, equivalent to a target population of 1.4 million plants per acre. Wheat was harvested using an Almaco SPC50 plot combine. Harvest area was 5’ x 20’.
Willsboro Research Farm – Willsboro, NY – For the 2010 and 2011 crops, a three-year-old sod of timothy and alfalfa was plowed in the year prior to planting wheat and the site was fallowed during the summer before planting to control perennial weeds. For the 2012 and 2013 crops, the sod was plowed in and incorporated two to three weeks before seeding wheat. Wheat was seeded using a custom eight-row cone seeder with 6-inch row spacing at a rate of 32 live seeds per square foot. The plots were harvested with a Hege plot combine. Harvest area was 4’ x 13’.
Table 3. Plot management for the winter wheat variety trials in ME, VT, and NY in 2010-2013.
| Trial Location | ||||
|---|---|---|---|---|
| Old Town, ME | Houlton or Athens, ME† | Alburgh, VT | Willsboro, NY | |
| Soil type | ||||
| 2010 | Melrose fine sandy loam | Adams loamy sand | Benson rocky silt loam | Kingsbury silt clay loam |
| 2011 | Caribou gravelly loam | |||
| 2012 | Caribou gravelly loam | |||
| 2013 | — | |||
| Previous crop | ||||
| 2010 | Mixed vegetables | Winter rye sod | Reed canary/alfalfa sod | timothy/alfalfa sod, fallow |
| 2011 | Mixed vegetables | Fallow | Spring wheat | timothy/alfalfa sod, fallow |
| 2012 | Fallow | Oats | Spring wheat | timothy/alfalfa sod |
| 2013 | Flax | — | Spring wheat | timothy/alfalfa sod |
| Pre-plant fertility source (rates are per acre)‡ | ||||
| 2010 | Solid dairy manure: 20 ton | Chicken manure: 4 ton | Sod plow down | Sod plow down |
| 2011 | Solid dairy manure: 22 ton | Pelletized chicken manure: 0.4 ton | Composted poultry manure: 2 ton | Sod plow down |
| 2012 | Solid dairy manure: 32 ton | Pelletized chicken manure: 0.4 ton | None | Sod plow down |
| 2013 | Solid dairy manure: 32 ton | — | None | Sod plow down |
| Topdress nitrogen (rates are per acre) | ||||
| 2010 | None | None | None | None |
| 2011 | None | Pelletized chicken manure: 60 lb available N | None | None |
| 2012 | Chilean nitrate: 16 lb N | Pelletized chicken manure: 60 lb available N | Pro-Booster, Pro-Gro: 75 lb available N | None |
| 2013 | Chilean nitrate: 16 lb N | — | None | None |
| Planting date | ||||
| 2010 | 24-Sep | 25-Sep | 26-Sep | 25-Sep |
| 2011 | 23-Sep | 22-Sep | 23-Sep | 27-Sep |
| 2012 | 9-Sep | 22-Sep | 21-Sep | 27-Sep |
| 2013 | 24-Sep | — | 21-Sep | 27-Sep |
| Harvest date | ||||
| 2010 | 20-Jul | 23-Jul | 21-Jul | 26-Jul |
| 2011 | 25-Jul | 6-Aug | 20-Jul | 28-Jul |
| 2012 | 20-Jul | 3-Aug | 11-Jul | 20-Jul |
| 2013 | 2-Aug | — | 18-Jul | 20-Jul |
| †The trial was located in Athens in 2010 and in Houlton in 2011-2013.
‡ The target rate for pre-plant N applications was 70 lbs of total N with no more than 25 lbs in the inorganic form. |
||||
MEASUREMENTS AND METHODS
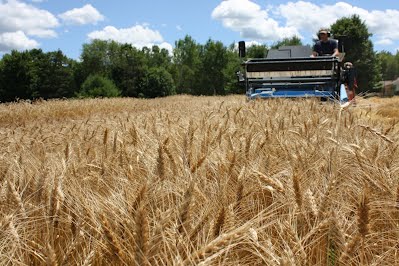
Flowering date was recorded for each variety where possible. Plant heights were measured at each site at the peak biomass stage. Prior to harvest, the incidence and severity of lodging was noted for each variety. All varieties were harvested on the same day at each site once the latest maturing variety threshed free in hand tests and weather and logistics allowed. Following harvest, grain was cleaned with a small Clipper cleaner and weights were recorded. Harvest moisture and test weights were determined using DICKEY-john GAC-2100 grain moisture meters.
Subsamples were ground into flour using a Perten LM3100 Laboratory Mill. The ground material was analyzed for crude protein, falling number, and mycotoxin levels. Protein content was determined using a Perten Inframatic 8600 Flour Analyzer. Most commercial mills target 12-14% protein. Falling number was determined on a Perten FN 1500 Falling Number Machine. The falling number is related to the level of sprout damage that has occurred in the grain due to enzymatic activity. It is measured as the time it takes, in seconds, for a plunger to fall through a slurry of flour and water to the bottom of the tube. Falling numbers less than 200 seconds indicate high enzymatic activity and poor quality wheat. Concentrations of deoxynivalenol (DON), a mycotoxin produced by the fungus that causes Fusarium head blight, were determined using the Veratox DON 2/3 Quantitative test from the NEOGEN Corp, which has a detection range of 0.5 to 5 ppm. Samples with DON values greater than 1 ppm are considered unsuitable for human consumption.
All data were analyzed using mixed model Analysis of Variance (ANOVA) in which replicates were considered random effects. The LSD procedure was used to detect whether differences among varieties were statistically significant and was only conducted if the ANOVA F-test was significant (P<0.05) (see below for a description of a “significant difference”). There were significant differences between the locations for most parameters, so results from each location are reported independently.
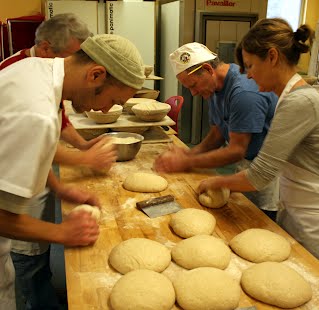
Bake testing was conducted in 2011 and 2012 of 15 varieties. Test samples came from individual field sites harvested in 2010 and 2011 and were selected based on protein, DON, falling number levels and quantity of available grain. Each sample was milled at Gleason Grains in Bridport, VT on a Meadows Mills Inc. stone burr mill and then sifted on a Meadows Mills Inc. bolter, which produced a finely ground flower with an extraction rate of approximate 92%. The first bake test was conducted in 2011 at King Arthur Flour in Norwich, VT by bakers Randy George, Red Hen Baking Company, Duxbury, VT; Jeffery Hamelman, King Arthur Flour, Norwich, VT; Alison Pray, Standard Baking Co., Portland, ME; and Jim Amaral, Borealis Breads, Wells, ME. The following varieties were tested: AC Morley, Jerry, Redeemer, and Zorro. The remaining 11 varieties were tested by bakers individually their respective facilities in 2012. Each baker followed the same recipe for a naturally leavened bread and used a predetermined list of criteria to score for certain characteristics from the beginning of the baking process to the final loaf. Scores from the 2011 test are the average of the four bakers’ individual scores, while scores from 2012 are from individual bakers.
What Is a Significant Difference?
Variations in yield and quality can occur not only due to genetics but also due to variability in soil, weather, and other growing conditions. Statistical analysis makes it possible to determine whether a difference between two varieties is real or whether it might have occurred due to other variability in the field. The Least Significant Difference (LSD) is the minimum difference needed between two averages to consider them statistically different. LSDs at the 5% level of probability are presented at the bottom of each table for each measure. Where the difference between two varieties within a column is equal to or greater than the LSD value, you can be sure in 19 out of 20 chances that there is a real difference between the two varieties.
In the example below, variety A is significantly different from variety C because the difference between their yields (1454) is greater than the LSD value (889). Variety A is not significantly different from variety B because the difference between their yields (725) is less than the LSD value (889).
Throughout this bulletin, the greatest value at each site for each measure is indicated with an underline and bold type. Varieties that are not significantly different from the greatest value are also in bold type. Using the example below, variety C had the highest measured yield (underlined and bolded) but it was not significantly different than the yield of variety B (bolded).
Example Table
| Variety | Yield | ||||||
|
|
||||||
| LSD | 889 |
RESULTS
Growth and Development
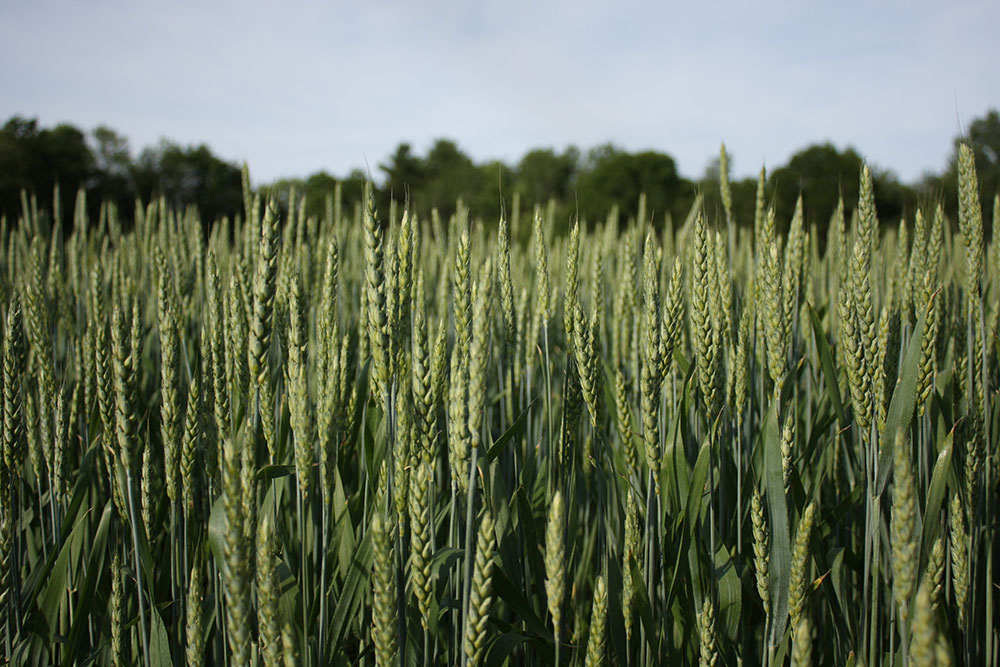
Winter wheat growth and development were influenced most by over winter and early spring weather conditions. In all years, fall planting was timely and plant growth was good going into the winter. In 2012, and to a lesser extent in 2010, the subsequent mild winter and early spring led to vigorous early growth and high yields. In contrast, winter thaws followed by icing, in 2011, and inconsistent snow cover and extreme cold, in 2013, negatively impacted growth and yields at a number of sites. Winterkill was so severe in Houlton in 2013 that the plots were discontinued. Heavy precipitation in early spring and summer did not impact yields (as compared with its effects on our spring wheat trials), but did appear to increase leaf diseases and DON levels, especially in 2013 at the Alburgh, VT and Willsboro, NY sites. Background soil conditions had a strong impact at the Athens, ME site where plant growth was noticeably poor. Subsequent soil tests indicated low pH (6.0) and low phosphorus availability.
Flowering occurred predominately during the first and second weeks of June in Old Town, ME, Alburgh, VT, and Willsboro, NY, and a week later in Houlton, ME. Across all sites and years, Appalachian White, Expedition and NuEast were the earliest varieties to flower, while Zorro was the latest (Table 4).
Plant heights ranged from 32 to 51 inches over the four years of trialing (Table 4). Banatka, Bezbanat, and Sherman were the tallest and are all heritage varieties, while Appalachian White, Camelot, and Ideal were the shortest.
Lodging was noted in 2012 and 2013. In 2012, there was partial lodging of Appalachian White and Sherman in Alburgh, VT and severe lodging of Banatka in Old Town, ME. In 2013, Sherman, Roughrider, Borden and Jerry all severely lodged in Alburgh, VT and Willsboro, NY.
Weed pressure was generally low at most sites and did not negatively impact yields and quality with the exception of the Athens, ME site in 2010 and the Willsboro, NY site in 2013 where perennials, such as quackgrass, were the predominant weeds present. Sheperd’s purse, a winter annual weed, was noted most years in Old Town, ME. While it is unlikely that it negatively impacted yields, it was able to flower and set seed, contributing to the weed seed bank at this location.
Table 4. Relative flowering time and plant height of winter wheat grown in ME, VT, and NY in 2010-2013.
| Relative Flowering Time | Plant Height (in) | |
|---|---|---|
| AC Morley | Medium | 40 |
| Appalachian White | Early | 32 |
| Arapahoe | Medium | 34 |
| Banatka | Medium | 51 |
| Bezbanat | Medium | 45 |
| Borden | Medium | 41 |
| Camelot | Medium | 32 |
| Expedition | Early | 33 |
| Harvard | Medium | 34 |
| Ideal | Medium | 32 |
| Jerry | Medium | 36 |
| Maxine | Medium | 31 |
| Millennium | Medium | 34 |
| NuEast | Early | 33 |
| Overland | Medium | 34 |
| Redeemer | Medium | 35 |
| Robidoux | Medium | 34 |
| Roughrider | Medium | 40 |
| Sherman | Medium | 43 |
| Warthog | Medium | 35 |
| Zorro | Late | 40 |
Grain Yield
Winter wheat yields were good to excellent and fairly stable (Table 7). Average yields by site and year were near or above the long-term estimated average of 2500 lb/acre (Matt Williams, personal communication). The exceptions were Athens, ME, where soil conditions and perennial weeds were problematic, and Houlton, ME in 2013, which was severely impacted by winterkill. Yields did not appear to be impacted by above normal precipitation during the growing season. Varieties that were among the highest yielding across sites and years were Borden, Warthog, AC Morley, Harvard, Overland, Jerry, and Zorro; and those that were among the lowest yielding were Roughrider, Banatka, Robidoux, and Sherman, with exceptions in particular site-years.
Grain Quality
Commercial mills use a variety of measurements to determine if a particular lot of wheat is suitable for bread flour, including grain protein, test weight, falling number, and mycotoxin (DON) concentration.
Grain protein levels were consistently low in ME, with the exception of Athens in 2010 (Table 6). Protein levels were generally higher in VT and NY but variable among years. Protein ranged from 8.9 to 12.0% in ME, 10.9 to 12.5% in VT, and 10.0 to 13.0% in NY. Overall, Redeemer and Maxine had the highest protein levels across sites. Roughrider, Sherman, and Banatka also had high protein levels but were grown in fewer site-years. Expedition, Overland, and NuEast consistently had the lowest protein levels.
The standard test weight for hard red winter wheat is 60 lbs per bushel, with a minimum acceptable level around 56 lbs per bushel depending on the buyer. Test weights ranged from 49 to 64 lbs per bushel (Table 7). Test weights often reflect growing conditions but can also vary among varieties. Varieties that consistently had high test weights were NuEast, Roughrider, Camelot, Banatka, and Expedition, while Jerry and Millennium tended to be relatively low.
Falling number values were all above the acceptable level (250 seconds) in all cases (Table 8).
Fusarium head blight, which produces the mycotoxin deoxynivalenol (DON), is a disease of major concern for wheat growers in northern New England. It infects the plant primarily during flowering and is favored by cool, humid weather. The United States Food and Drug Administration has established a maximum DON guideline of 1 ppm for finished human products. Millers may accept grain with slightly higher DON levels because, through cleaning, they can remove some of the infected grain and reduce DON levels. DON level was a major criteria used for removing varieties from trials in subsequent years.
In ME, DON levels were below the 0.05 ppm detectable limit for the testing kit used in all years (Table 9). In VT and NY, measurable DON levels were recorded for most varieties, except in Alburgh, VT in 2012, and, in 2013, DON levels were extremely high among all varieties at both sites. Results among varieties were variable with none showing consistently low or high DON levels at these sites. It should be noted that DON levels were used as a major criteria for removing varieties from these trials with each successive year, so not all varieties tested are shown here. For results from previous years’ reports, see extension.umaine.edu/grains-oilseeds/topics/.
Baking Quality
Two separate bake tests were conducted. The first involved all four bakers and was at the King Arthur Four’s test kitchen in Norwich, VT to calibrate the scoring criteria to be used. Sample lots were chosen to give a range of proteins to help calibrate the testing procedure. From this first round of testing, Redeemer (12% protein) was the only variety that the bakers thought made good bread and indicated they would be willing to sell in their respective bakeries. In the second round of testing, each individual baker at their own facility tested another three to four varieties of varying protein levels. From this round of testing eight of the varieties were found to be suitable for baking (Table 10). It should be noted that protein level was not a good predictor of how a particular lot of flour was scored by the bakers.
DISCUSSION
Wheat grain sold for bread flour can receive up to twice the pay price as grain sold for livestock feed in New England, but the grain must meet higher quality standards. Therefore, when choosing varieties, it is important to consider their potential to produce grain with acceptable protein, test weight, falling number, DON levels, and baking performance, as well as their ability to produce high yields.
Overall yields were good to excellent. In our trials, timely fall planting was never limited by weather in any of our twelve site-years, which is a distinct advantage of winter wheat over spring grains. As well, annual weeds were never an issue. Perennial weeds and poor overwintering conditions had the most impact on yields, both of which could be alleviated to some extent by proper site selection.
There is commonly a tradeoff between grain yield and protein, which can be seen not only among the site averages but also among the individual varieties. Those that yield the highest often have lower protein levels than those that yield less. Over all of the sites and years, varieties that tended to be among the highest yielding are AC Morley, Borden, Harvard, Jerry, Warthog, and Zorro. Varieties that consistently had above average protein levels include Banatka, Maxine, Redeemer, Roughrider, and Sherman. Others with average protein levels include Warthog, Jerry and Zorro. Spring topdressing can help boost grain protein but given limited options for organic production, variety selection is a key management decision to optimize protein levels.
Fusarium head blight can be a major issue in the Northeast. However, in Maine, DON levels were consistently very low in these winter wheat trials, even when spring wheat variety trials conducted at the same site in Old Town showed higher levels. The reason for this is unclear but could be related to there being very little grain corn production in the area and winter wheat flowering occurring before inoculum levels build up at these cooler sites. In contrast, VT and NY have seen measurable levels in winter wheat, with extremely high levels in 2013 due to heavy precipitation. Variety selection can help, however none of the varieties tested in these trials are resistant to Fusarium. Options for managing the disease in organic systems are limited and include rotation with non-grain crops (i.e. avoiding planting wheat after wheat, corn, or barley and rye), burying any disease-carrying residue, and choosing less susceptible varieties. While no current wheat varieties are resistant to Fusarium head blight, as evidenced by the 2013 results in VT and NY, some have shown better tolerance to the disease when it occurs in moderation. Varieties that had DON levels consistently below 1ppm in the other years in VT and NY are AC Morley, Borden, Redeemer, Roughrider, and Sherman.
Although a limited number of varieties and samples were selected for bake testing, the results showed that good to excellent artisanal breads can be baked from organic winter wheat grown in Northern New England. Regional bakers found that nine of the 15 varieties they tested were suitable for making bread. All of the samples tested, except for the sample of Redeemer, had a protein levels below 12%, the industry standard for bread flour, which supports bakers’ observations that flour with less than 12% protein can give excellent results using artisanal methods.
It may be helpful to compare these ME, VT, and NY results with results from variety trails conducted in other regions. Ultimately, though, it is important to evaluate data from test sites that are similar to your farm and region when deciding which varieties to grow.
Full reports of the 2010, 2011, and 2012 results are available as separate publications at extension.umaine.edu/grains-oilseeds/topics/.
Table 5. Yield of winter wheat grown in ME, VT, and NY in 2010-2013.
| Yield at 13.5% moisture (lbs/acre) | |||||||||||||||||||
|---|---|---|---|---|---|---|---|---|---|---|---|---|---|---|---|---|---|---|---|
| Old Town, ME | Houlton or Athens, ME† | Alburgh, VT | Willsboro, NY | ||||||||||||||||
| 2010 | 2011 | 2012 | 2013 | Average | 2010 | 2011 | 2012 | Average | 2010 | 2011 | 2012 | 2013 | Average | 2010 | 2011 | 2012 | 2013 | Average | |
| AC Morley | 2746 | 2799 | 4812 | 3115 | 3368 | 1635 | 2993 | 4020 | 2883 | 3985 | 5171 | 5507 | 2975 | 4410 | 3798 | 3226 | 3887 | 3087 | 3500 |
| App. White | — | 2710 | 4257 | 2625 | 3197 | — | 2160 | 3540 | 2850 | — | 3839 | 4648 | 2898 | 3795 | — | 2501 | 4376 | 3614 | 3497 |
| Arapahoe | 2515 | 2337 | 3876 | 3075 | 2951 | 1853 | 1921 | 3083 | 2286 | 4041 | 3028 | 3948 | 2536 | 3388 | 4439 | 2653 | 4261 | 3312 | 3666 |
| Banatka | — | 2660 | 3596 | 2215 | 2824 | — | — | 2484 | 2484 | — | — | — | — | — | — | — | — | — | — |
| Bezbanat | — | — | — | 3791 | 3791 | — | — | — | — | — | — | — | — | — | — | — | — | — | — |
| Borden | 3344 | 2752 | 4652 | — | 3583 | 2127 | 2602 | 4089 | 2939 | 4615 | 4306 | 3872 | 3453 | 4062 | 4657 | 2331 | 3766 | 3160 | 3479 |
| Camelot | 2887 | 2332 | 4583 | 2472 | 3069 | 1962 | 1960 | 3242 | 2388 | 3631 | 3687 | 4824 | 2593 | 3684 | 4121 | 2387 | 4175 | 3115 | 3450 |
| Expedition | 2656 | 2504 | 4710 | 2930 | 3200 | 2371 | 2522 | 3724 | 2872 | 3466 | 3207 | 4748 | 2913 | 3584 | 4173 | 2436 | 5073 | 3803 | 3871 |
| Harvard | 3247 | 2696 | 4321 | 2648 | 3228 | 2409 | 2740 | 3538 | 2896 | 3237 | 4338 | 4221 | 3453 | 3812 | 4303 | 3006 | 3708 | 2983 | 3500 |
| Ideal | — | — | — | 3206 | 3206 | — | — | — | — | — | — | — | 3073 | 3073 | — | — | — | 3439 | 3439 |
| Jerry | 3469 | 2372 | 4385 | 3137 | 3341 | 1897 | 3024 | 3360 | 2760 | 4408 | 3609 | 3816 | 2469 | 3576 | 4432 | 2862 | 3740 | 3157 | 3548 |
| Maxine | 2388 | 1744 | 4080 | 2079 | 2573 | 1788 | 1651 | 2927 | 2122 | 3692 | 3324 | 4839 | 3056 | 3728 | 2822 | 1654 | 4198 | 2730 | 2851 |
| Millennium | 2511 | 2214 | 4298 | — | 3008 | 1521 | 1767 | 3056 | 2115 | 4319 | 3683 | 4585 | 1721 | 3577 | 4397 | 2501 | 4591 | 2479 | 3492 |
| NuEast | — | 2680 | 3932 | 2361 | 2991 | — | 1893 | 3729 | 2811 | — | 3758 | 5210 | 3054 | 4007 | — | 2913 | 4128 | 3563 | 3535 |
| Overland | 3001 | 2248 | 4155 | 3309 | 3178 | 1645 | 2237 | 3426 | 2436 | 4208 | 3904 | 4983 | 3331 | 4107 | 4372 | 3397 | 4229 | 3293 | 3823 |
| Redeemer | 2652 | 2537 | 3783 | 2557 | 2882 | 1905 | 2704 | 2925 | 2511 | 3886 | 4149 | 4159 | 2926 | 3780 | 3043 | 2217 | 3958 | 2898 | 3029 |
| Robidoux | — | — | — | 2860 | 2860 | — | — | — | — | — | — | — | 2316 | 2316 | — | — | — | 2863 | 2863 |
| Roughrider | — | — | 3146 | — | 3146 | — | — | 2479 | 2479 | 3423 | 3010 | 3650 | 1494 | 2894 | 3798 | 2457 | 3213 | 1573 | 2760 |
| Sherman | — | — | — | — | — | — | — | — | — | — | 3226 | 3043 | 1459 | 2576 | — | 2660 | 3396 | 1614 | 2557 |
| Warthog | 3387 | 3068 | 4695 | 3090 | 3560 | 1444 | 3330 | 3569 | 2781 | 3580 | 4202 | 4437 | 3228 | 3862 | 3178 | 1691 | 4440 | 3294 | 3151 |
| Zorro | 3145 | 2667 | 4413 | 2761 | 3247 | 2091 | 2379 | 3362 | 2611 | 2836 | 3933 | 3553 | 3260 | 3396 | 3746 | 2984 | 3320 | 3721 | 3443 |
| Site Average | 2919 | 2520 | 4217 | 2837 | 3123 | 1896 | 2392 | 3327 | 2538 | 3809 | 3787 | 4355 | 2748 | 3675 | 3949 | 2581 | 4027 | 3037 | 3399 |
| LSD (0.05) | 695 | 433 | 414 | 641 | — | 539 | 466 | 449 | — | NS | 518 | 451 | 819 | — | 564 | 811 | NS | 453 | — |
| †The trial was located in Athens in 2010 and in Houlton in 2011-2013. Icing at the 2013 Houlton site caused severe winter kill and plots were discontinued. | |||||||||||||||||||
Table 6. Protein concentration of winter wheat grown in ME, VT, and NY in 2010-2013.
| Protein at 12% moisture (%) | |||||||||||||||||||
|---|---|---|---|---|---|---|---|---|---|---|---|---|---|---|---|---|---|---|---|
| Old Town, ME | Houlton or Athens, ME† | Alburgh, VT | Willsboro, NY | ||||||||||||||||
| 2010 | 2011 | 2012 | 2013 | Average | 2010 | 2011 | 2012 | Average | 2010 | 2011 | 2012 | 2013 | Average | 2010 | 2011 | 2012 | 2013 | Average | |
| AC Morley | 10.8 | 8.4 | 8.7 | 10.1 | 9.3 | 12.1 | 8.2 | 9.7 | 10.0 | 12.1 | 9.6 | 10.8 | 12.0 | 11.1 | 13.1 | 10.6 | 9.7 | 10.5 | 11.0 |
| App. White | — | 8.9 | 9.2 | 10.4 | 9.1 | — | 9.2 | 9.1 | 9.2 | — | 9.9 | 11.6 | 12.9 | 11.5 | — | 11.5 | 10.2 | 11.3 | 11.0 |
| Arapahoe | — | 9.8 | 8.9 | 9.8 | 9.4 | — | 8.4 | 10.0 | 9.2 | — | 9.6 | 11.0 | 12.4 | 11.0 | — | 10.6 | 9.4 | 12.2 | 10.7 |
| Banatka | — | 10.2 | 9.8 | 11.9 | 10.0 | — | — | 11.8 | 11.8 | — | — | — | — | — | — | — | — | — | — |
| Bezbanat | — | — | — | 9.4 | 9.4 | — | — | — | — | — | — | — | — | — | — | — | — | — | — |
| Borden | 10.1 | 8.2 | 8.5 | — | 8.9 | 11.7 | 8.4 | 9.1 | 9.7 | 9.7 | 9.7 | 10.5 | 10.7 | 10.2 | 12.1 | 9.8 | 9.5 | 10.5 | 10.5 |
| Camelot | 10.7 | 8.9 | 9.3 | 10.1 | 9.6 | 11.9 | 9.4 | 9.5 | 10.3 | 11.1 | 9.2 | 10.5 | 12.0 | 10.7 | 13.1 | 11.4 | 9.3 | 11.2 | 11.3 |
| Expedition | 10.2 | 8.6 | 8.9 | 9.5 | 9.2 | 12.1 | 8.4 | 8.6 | 9.7 | 10.1 | 9.4 | 10.7 | 11.4 | 10.4 | 13.1 | 10.7 | 8.7 | 11.4 | 11.0 |
| Harvard | 9.6 | 8.9 | 9.1 | 9.8 | 9.2 | 11.3 | 8.9 | 9.8 | 10.0 | 9.7 | 9.7 | 11.6 | 12.8 | 11.0 | 12.2 | 11.2 | 10.7 | 12.1 | 11.6 |
| Ideal | 9.0 | 9.0 | — | — | — | — | — | — | — | 11.0 | 11.0 | — | — | — | 10.1 | 10.1 | |||
| Jerry | 10.9 | 9.6 | 9.1 | 9.5 | 9.9 | 12.1 | 8.5 | 9.9 | 10.2 | 10.7 | 10.4 | 11.4 | 12.1 | 11.2 | 12.7 | 11.5 | 9.9 | 12.1 | 11.6 |
| Maxine | 11.7 | 10.6 | 10.0 | 11.2 | 10.8 | 12.3 | 10.4 | 10.2 | 11.0 | 10.8 | 10.3 | 11.9 | 12.5 | 11.4 | 13.6 | 12.7 | 10.5 | 12.2 | 12.3 |
| Millennium | 10.8 | 9.2 | 9.1 | — | 9.7 | 12.1 | 8.7 | 9.7 | 10.2 | 10.0 | 9.8 | 10.0 | 11.8 | 10.4 | 12.8 | 10.9 | 9.4 | 11.1 | 11.1 |
| NuEast | 8.9 | 9.2 | 9.8 | 9.1 | — | 8.8 | 8.8 | 8.8 | — | 8.6 | 10.3 | 11.4 | 10.1 | 11.1 | 9.4 | 10.6 | 10.4 | ||
| Overland | 10.5 | 8.4 | 8.9 | 9.7 | 9.3 | 12.1 | 8.2 | 9.5 | 9.9 | 9.6 | 9.7 | 10.2 | 12.3 | 10.5 | 12.8 | 11.0 | 8.4 | 10.4 | 10.7 |
| Redeemer | 11.5 | 10.5 | 11.0 | 12.1 | 11.0 | 12.0 | 10.4 | 12.6 | 11.7 | 12.9 | 12.3 | 12.8 | 14.8 | 13.2 | 14.3 | 13.0 | 11.4 | 13.2 | 13.0 |
| Robidoux | — | — | — | 10.5 | 10.5 | — | — | — | — | — | — | — | 12.0 | 12.0 | — | — | — | 11.7 | 11.7 |
| Roughrider | — | — | 10.4 | — | 10.4 | — | — | 13.3 | 13.3 | 11.4 | 10.3 | 10.9 | 13.9 | 11.6 | 13.6 | 11.7 | 10.5 | 13.3 | 12.3 |
| Sherman | — | — | — | — | — | — | — | — | — | 11.8 | 13.0 | 15.4 | 13.4 | — | 13.5 | 11.3 | 14.7 | 13.2 | |
| Warthog | 10.7 | 8.8 | 8.9 | 10.2 | 9.5 | 12.1 | 8.8 | 10.1 | 10.3 | 11.1 | 10.0 | 11.3 | 13.3 | 11.4 | 13.1 | 12.0 | 10.5 | 11.7 | 11.8 |
| Zorro | 10.6 | 9.7 | 9.8 | 10.5 | 10.0 | 11.8 | 8.6 | 10.8 | 10.4 | 12.1 | 11.0 | 12.3 | 12.7 | 12.0 | 13.1 | 11.3 | 11.2 | 11.9 | 11.9 |
| Site Average | 10.7 | 9.2 | 9.3 | 10.2 | 9.9 | 12.0 | 8.9 | 10.1 | 10.3 | 10.9 | 10.1 | 11.2 | 12.5 | 11.2 | 13.0 | 11.4 | 10.0 | 11.7 | 11.5 |
| LSD (0.05) | 0.7 | 0.9 | 0.5 | 1.0 | — | NS | 0.9 | 0.8 | — | 1.5 | 0.9 | 0.6 | 0.6 | — | 1.1 | 0.7 | 0.6 | 0.7 | — |
| †The trial was located in Athens in 2010 and in Houlton in 2011-2013. Icing at the 2013 Houlton site caused severe winter kill and plots were discontinued. | |||||||||||||||||||
Table 7. Test weight of winter wheat grown in ME, VT, and NY in 2010-2013.
| Test Weight (lbs/bu) | |||||||||||||||||||
|---|---|---|---|---|---|---|---|---|---|---|---|---|---|---|---|---|---|---|---|
| Old Town, ME | Houlton or Athens, ME† | Alburgh, VT | Willsboro, NY | ||||||||||||||||
| 2010 | 2011 | 2012 | 2013 | Average | 2010 | 2011 | 2012 | Average | 2010 | 2011 | 2012 | 2013 | Average | 2010 | 2011 | 2012 | 2013 | Average | |
| AC Morley | 58 | 61 | 59 | 59 | 59 | 56 | 57 | 59 | 57 | 57 | 65 | 62 | 56 | 60 | 59 | 60 | 60 | 49 | 57 |
| App. White | — | 62 | 61 | 57 | 60 | — | 51 | 57 | 54 | — | 66 | 62 | 59 | 62 | — | 59 | 58 | 54 | 57 |
| Arapahoe | 56 | 62 | 60 | 57 | 59 | 55 | 56 | 57 | 56 | 55 | 65 | 60 | 56 | 59 | 59 | 58 | 58 | 52 | 57 |
| Banatka | — | 62 | 60 | 60 | 61 | — | — | 60 | 60 | — | — | — | — | — | — | — | — | — | — |
| Bezbanat | — | — | — | 58 | — | — | — | — | — | — | — | — | — | — | — | — | — | — | — |
| Borden | 55 | 58 | 57 | — | 57 | 53 | 53 | 58 | 55 | 54 | 65 | 59 | 54 | 58 | 58 | 55 | 56 | 46 | 54 |
| Camelot | 57 | 63 | 61 | 58 | 60 | 55 | 53 | 57 | 55 | 56 | 63 | 61 | 57 | 59 | 59 | 58 | 60 | 52 | 57 |
| Expedition | 58 | 62 | 61 | 58 | 60 | 56 | 57 | 57 | 57 | 56 | 63 | 63 | 59 | 60 | 60 | 59 | 60 | 53 | 58 |
| Harvard | 58 | 62 | 58 | 59 | 59 | 56 | 57 | 59 | 57 | 56 | 63 | 60 | 55 | 59 | 60 | 59 | 59 | 48 | 57 |
| Ideal | — | — | — | 57 | — | — | — | — | — | — | — | — | 53 | 53 | — | — | — | 47 | 47 |
| Jerry | 57 | 61 | 60 | 57 | 59 | 55 | 55 | 58 | 56 | 56 | 63 | 59 | 55 | 58 | 59 | 58 | 58 | 46 | 55 |
| Maxine | 59 | 61 | 60 | 59 | 60 | 55 | 56 | 57 | 56 | 57 | 63 | 60 | 60 | 60 | 58 | 58 | 59 | 50 | 56 |
| Millennium | 58 | 62 | 60 | — | 60 | 56 | 55 | 57 | 56 | 56 | 64 | 60 | 56 | 59 | 59 | 58 | 59 | 45 | 55 |
| NuEast | — | 64 | 63 | 59 | 62 | 56 | 59 | 58 | 64 | 64 | 61 | 63 | — | 60 | 60 | 54 | 58 | ||
| Overland | 57 | 60 | 59 | 58 | 59 | 55 | 55 | 56 | 55 | 56 | 62 | 62 | 58 | 60 | 59 | 59 | 58 | 51 | 57 |
| Redeemer | 59 | 62 | 62 | 57 | 60 | 56 | 58 | 58 | 57 | 57 | 65 | 61 | 56 | 60 | 58 | 58 | 59 | 50 | 56 |
| Robidoux | — | — | — | 56 | — | — | — | — | — | — | — | — | 52 | 52 | — | — | — | 44 | 44 |
| Roughrider | — | — | 61 | — | 61 | — | — | — | — | 57 | 64 | 63 | 58 | 61 | 60 | 59 | 61 | 44 | 56 |
| Sherman | — | — | — | — | — | — | — | — | — | — | 66 | 62 | 57 | 62 | — | 59 | 59 | 44 | 54 |
| Warthog | 58 | 60 | 61 | 59 | 60 | 55 | 56 | 58 | 56 | 57 | 64 | 59 | 58 | 60 | 58 | 58 | 59 | 53 | 57 |
| Zorro | 59 | 62 | 58 | 59 | 60 | 55 | 56 | 59 | 57 | 56 | 63 | 59 | 55 | 58 | 59 | 58 | 59 | 49 | 56 |
| Site Average | 58 | 62 | 60 | 58 | 59 | 55 | 55 | 58 | 56 | 55 | 64 | 61 | 57 | 60 | 59 | 58 | 59 | 49 | 56 |
| LSD (0.05) | NS | 0.9 | 0.9 | 0.5 | — | 2 | 0.7 | 1.0 | — | 1 | NS | 1.9 | 4.2 | — | 2 | 1.6 | 1.7 | 3 | — |
| †The trial was located in Athens in 2010 and in Houlton in 2011-2013. Icing at the 2013 Houlton site caused severe winter kill and plots were discontinued. | |||||||||||||||||||
Table 8. Falling number of winter wheat grown in ME, VT, and NY in 2010-2013.
| Falling Number at 14% Moisture (seconds) | |||||||||||||||
|---|---|---|---|---|---|---|---|---|---|---|---|---|---|---|---|
| Old Town, ME | Houlton or Athens, ME† | Alburgh, VT | Willsboro, NY | ||||||||||||
| 2010 | 2011 | 2012 | 2013 | 2010 | 2011 | 2012 | 2010 | 2011 | 2012 | 2013 | 2010 | 2011 | 2012 | 2013 | |
| AC Morley | 383 | 463 | 507 | — | — | 345 | 413 | 368 | 370 | 377 | 356 | 349 | 402 | 354 | 340 |
| Appalachian White | — | 486 | 438 | — | — | 375 | 400 | — | 395 | 392 | 377 | — | 367 | 408 | 352 |
| Arapahoe | 397 | 748 | 436 | — | — | 328 | 452 | 396 | 429 | 404 | 386 | 400 | 420 | 394 | 372 |
| Banatka | — | 469 | 427 | — | — | — | 421 | — | — | — | — | — | — | — | — |
| Bezbanat | — | — | — | — | — | — | — | — | — | — | — | — | — | — | — |
| Borden | 393 | 396 | 508 | — | — | 386 | 508 | 364 | 402 | 354 | 369 | 361 | 408 | 377 | 353 |
| Camelot | 415 | 464 | 472 | — | — | 462 | 436 | 395 | 393 | 402 | 415 | 386 | 421 | 405 | 403 |
| Expedition | 404 | 453 | 511 | — | — | 340 | 479 | 388 | 391 | 405 | 391 | 363 | 412 | 395 | 361 |
| Harvard | 300 | 411 | 502 | — | — | 331 | 355 | 374 | 349 | 337 | 362 | 363 | 389 | 361 | 330 |
| Ideal | — | — | — | — | — | — | — | — | — | — | 366 | — | — | — | 337 |
| Jerry | 371 | 486 | 448 | — | — | 290 | 402 | 381 | 416 | 413 | 393 | 376 | 423 | 386 | 300 |
| Maxine | 292 | 477 | 525 | — | — | 410 | 484 | 385 | 412 | 391 | 392 | 375 | 367 | 405 | 392 |
| Millennium | 388 | 460 | 503 | — | — | 257 | 425 | 376 | 391 | 397 | 384 | 378 | 419 | 390 | 340 |
| NuEast | — | 518 | 456 | — | — | 441 | 458 | — | 410 | 403 | 410 | — | 440 | 396 | 391 |
| Overland | 416 | 484 | 438 | — | — | 396 | 477 | 382 | 404 | 382 | 367 | 399 | 436 | 384 | 376 |
| Redeemer | 426 | 499 | 466 | — | — | 322 | 488 | 421 | 428 | 407 | 383 | 420 | 452 | 439 | 408 |
| Robidoux | — | — | — | — | — | — | — | 391 | — | — | 391 | — | — | — | 352 |
| Roughrider | — | — | 478 | — | — | — | 434 | 399 | 412 | 369 | 408 | 365 | 432 | 387 | 308 |
| Sherman | — | — | — | — | — | — | — | — | 410 | 399 | 386 | — | 400 | 411 | 324 |
| Warthog | 426 | 463 | 463 | — | — | 413 | 461 | 412 | 413 | 388 | 440 | 422 | 466 | 435 | 421 |
| Zorro | 297 | 469 | 471 | — | — | 283 | 482 | 370 | 397 | 372 | 365 | 342 | 429 | 351 | 354 |
| †The trial was located in Athens in 2010 and in Houlton in 2011-2013. Icing at the 2013 Houlton site caused severe winter kill and plots were discontinued. | |||||||||||||||
Table 9. Levels of the deoxynivalenol mycotoxin (DON) in winter wheat grown in ME, VT, and NY in 2010-2013.
| DON (ppm) | ||||||||||||||||
|---|---|---|---|---|---|---|---|---|---|---|---|---|---|---|---|---|
| Old Town, ME | Houlton or Athens, ME† | Alburgh, VT | Willsboro, NY | |||||||||||||
| 2010 | 2011 | 2012 | 2013 | 2010 | 2011 | 2012 | 2010 | 2011 | 2012 | 2013 | 2010 | 2011 | 2012 | 2013 | ||
| AC Morley | All values were <0.5 for all years at these sites | 0.6 | < | < | 9.2 | 0.7 | 0.6 | < | 15.6 | |||||||
| Appalachian White | — | 2.0 | < | 8.5 | — | 2.0 | 0.8 | 7.1 | ||||||||
| Arapahoe | 0.6 | 1.3 | < | 6.6 | 0.6 | 0.9 | < | 10.2 | ||||||||
| Banatka | — | — | < | — | — | — | — | — | ||||||||
| Bezbanat | — | — | < | — | — | — | — | — | ||||||||
| Borden | All values were <0.5 for all years at these sites | < | 0.6 | < | 9.6 | 0.5 | 0.5 | < | 14.2 | |||||||
| Camelot | 0.6 | 1.8 | < | 6.4 | 0 | 1.5 | 0.7 | 12.9 | ||||||||
| Expedition | 0.6 | 1.3 | < | 4.1 | 0.8 | 1.2 | 0.6 | 9.1 | ||||||||
| Harvard | 1.9 | 0.6 | < | 6.0 | 0.6 | 1.1 | < | 12.8 | ||||||||
| Ideal | — | — | < | 10.6 | — | — | — | 18.1 | ||||||||
| Jerry | All values were <0.5 for all years at these sites | 2.1 | 0.8 | < | 8.2 | 0 | 0.8 | 0.6 | 15.3 | |||||||
| Maxine | < | 1.0 | < | 6.9 | 0.8 | 1.2 | < | 9.0 | ||||||||
| Millennium | < | 1.5 | 0.5 | 8.8 | 1 | 1.2 | < | 14.5 | ||||||||
| NuEast | — | 1.2 | < | 4.7 | — | 2.4 | 0.6 | 8.4 | ||||||||
| Overland | 0.8 | 1.6 | < | 6.5 | < | 1.3 | < | 8.9 | ||||||||
| Redeemer | All values were <0.5 for all years at these sites | < | < | < | 4.0 | < | 0.7 | < | 11.2 | |||||||
| Robidoux | — | — | < | 7.9 | — | — | — | 16.8 | ||||||||
| Roughrider | 0.6 | 0.6 | < | 7.6 | < | < | < | 12.6 | ||||||||
| Sherman | — | 0.6 | < | 6.6 | — | 0.6 | < | 11.0 | ||||||||
| Warthog | 1.0 | 0.7 | < | 5.9 | 0.9 | 0.8 | < | 11.0 | ||||||||
| Zorro | 0.9 | 1.0 | < | 8.6 | 0.9 | < | < | 17.7 | ||||||||
| Site Average | 0.7 | 1.0 | < | 7.2 | 0.5 | 1.1 | 0.7 | 12.4 | ||||||||
| †The trial was located in Athens in 2010 and in Houlton in 2011-2013. Icing at the 2013 Houlton site caused severe winter kill and plots were discontinued.< = < 0.5 ppm. | ||||||||||||||||
Table 10. Bake test results for select winter wheat varieties grown in ME, VT, and NY in 2010 and 2011.
| Bake Performance | |||||||
|---|---|---|---|---|---|---|---|
| Variety | Test baker† | Flour quality characteristics | Bake Score | Notes from test bakers | |||
| Protein‡ (%) | Test wt (lbs/bu) | Falling Number (seconds) | |||||
| AC Morley | all | 8 | 57 | 374 | 42 | Deficient, would not want to bake with | |
| App. White | C | 9 | 62 | 486 | 81 | Great potential as bread flour | |
| Arapahoe | B | 10 | 62 | 475 | 78 | Good, willing to bake with | |
| Borden | B | 10 | 65 | 402 | 45 | Very weak, wouldn’t want to bake with | |
| Expedition | C | 10 | 58 | 403 | 82 | Great potential as bread flour | |
| Harvard | B | 10 | 65 | 349 | 78 | Low absorption, excellent crumb structure, willing to bake with | |
| Jerry | all | 10 | 64 | 435 | 43 | Deficient, would not want to bake with | |
| Maxine | B | 11 | 61 | 475 | 72 | Great absorption, would have been better with more water | |
| Millennium | A | 9 | 62 | 460 | 78 | Good | |
| Nu-East | A | 9 | 64 | 525 | 74 | Good | |
| Overland | A | 11 | 57 | 471 | 76 | Good | |
| Redeemer | all | 12 | 64 | 444 | 63 | Made good bread | |
| Roughrider | C | 10 | 64 | 412 | 50 | Low absorption, weak, not interested in baking with | |
| Warthog | A | 10 | 64 | 413 | 77 | Made excellent bread | |
| Zorro | all | 11 | 59 | 406 | 55 | Would not want to bake with | |
| † Letters represent the three individual bakers who performed the second round of testing.‡ 12% moisture. | |||||||
|
|
|
Updated October 2015
Acknowledgements: The UVM Extension Crops and Soils Team would like to thank the Borderview Research Farm and the Willsboro Research Farm for their generous help with the trials, as well as acknowledge the USDA OREI grants program for their financial support. We would also like to thank Katie Blair, Chantel Cline, and Savanna Kittell-Mitchell for their assistance with data collection and entry. The University of Maine Sustainable Agriculture team thanks Luke Sites of Sites Farm and Dick York of Nature’s Circle Farm for providing their assistance and fields in Athens and Houlton, the University of Maine Rogers Research Farm, and Joe Cannon, Chris Illingworth, Maggie Lynn, Jess Richards, Michael Correl, Erin Roche, and Aaron Englander for their technical help.
Information in this publication is provided purely for educational purposes. No responsibility is assumed for any problems associated with the use of products or services mentioned. No endorsement of products or companies is intended, nor is criticism of unnamed products or companies implied.
This research is supported by the U.S. Department of Agriculture, National Institute of Food and Agriculture, Organic Research and Extension Initiative under Award No. 2009-01366, “Enhancing farmers’ capacity to produce high quality organic bread wheat.”
Published and distributed in furtherance of Acts of Congress of May 8 and June 30, 1914, by the University of Maine Cooperative Extension, the Land Grant University of the state of Maine and the U.S. Department of Agriculture cooperating. Cooperative Extension and other agencies of the U.S.D.A. provide equal opportunities in programs and employment. Call 800-287-0271 or TDD 800-287-8957 (in Maine), or 207-581-3188, for information on publications and program offerings from University of Maine Cooperative Extension, or visit extension.umaine.edu.