2010 Organic Spring Wheat Variety Trial – Vermont
2010 Vermont Organic Spring Wheat Trial Results (PDF)
Heather Darby, Erica Cummings, Rosalie Madden, Amanda Gervais, Phillip Halteman, and Susan Monahan
In 2010, the University of Vermont Extension in collaboration with the University of Maine began an extensive evaluation of hard red spring wheat varieties grown under organic production in order to determine which varieties thrive in our northern climate. The trials were established at Borderview Research Farm in Alburgh, Vermont and at the Cornell Willsboro Research Farm in Willsboro, New York. The results for the Alburgh location are reported below; the Willsboro data will be added as soon as quality analyses are completed. This trial is one of several in a USDA Organic Research Education Initiative grant focused on the production of high quality organic bread wheat in New England.
SPRING WHEAT VARIETY TRIALS
The experimental plot design was randomized complete block with four replications. Wheat varieties evaluated and their sources are listed in Table 1.
Table 1. Winter wheat varieties planted in Alburgh, VT and Willsboro, NY.
| Species | Seed Source | |
|---|---|---|
| Spring Wheat Varieties | Type | |
| AC Barrie | Hard Red | McCardle Bros |
| AC McKenzie | Hard Red | Semican |
| AC Roblin | Hard Red | Wood Prairie Farm |
| AC Superb | Hard Red | Seedway |
| AC Walton | Hard Red | McCardle Bros |
| Ada | Hard Red | University of Minnesota |
| Batiscan | Hard Red | Semican |
| Cabernet | Hard Red | Tristate Seeds |
| Faller | Hard Red | Albert Lea Seed |
| FBC Dylan | Hard Red | North Dakota State University |
| Glenn | Hard Red | Albert Lea Seed |
| Helios | Hard Red | La Coop de Federee |
| Howard | Hard Red | North Dakota State University |
| HRS10181J | Hard Red | JGL, Inc |
| HRS10182J | Hard Red | JGL, Inc |
| HRS7001J | Hard Red | Grand Falls Milling |
| Kaffé | Soft White | Semican |
| Kelse | Hard Red | Washington State University |
| Kinsey | Hard Red | Semican |
| Magog | Hard Red | Semican |
| Melbec | Hard Red | Tristate Seeds |
| Nick | Hard Red | Tristate Seeds |
| Oklee | Hard Red | University of Minnesota |
| RB07 | Hard Red | University of Minnesota |
| Red Fife | Hard Red | Butterworks Farm |
| Sabin | Hard Red | University of Minnesota |
| SD7006J | Durum | Grand Falls Milling |
| Steele | Hard Red | Albert Lea Seed House |
| Tom | Hard Red | University of Minnesota |
| Ulen | Hard Red | University of Minnesota |
WEATHER DATA
Seasonal precipitation and temperature recorded at weather stations in close proximity to the 2010 sites are shown in Table 2. This growing season’s weather was ideal for growing wheat. Due to the warm spring the wheat got off to an early start and continued to be at least a week early in reaching major developmental stages. From planting to harvest in Alburgh there was an accumulation of 4890 Growing Degree Days (GDD), 411 GDDs higher than the 30 year average.
Table 2. Temperature and precipitation summary for Alburgh, VT and Willsboro, NY, 2010
| Alburgh, VT | April | May | June | July | August |
|---|---|---|---|---|---|
| Average Temperature (F) | 49.3 | 59.6 | 66.0 | 74.1 | 70.4 |
| Departure from Normal | 5.80 | 3.00 | 0.20 | 3.00 | 1.40 |
| Precipitation (inches) | 2.76 | 0.92 | 4.61 | 4.30 | 5.48 |
| Departure from Normal | 0.25 | -2.01 | 1.40 | 0.89 | 1.63 |
| Growing Degree Days (base 32) | 521 | 854 | 1019 | 1305 | 1192 |
| Departure from Normal | 176 | 91.5 | 4.50 | 94.6 | 45.0 |
| Willsboro, NY | April | May | June | July | August |
| Average Temperature (F) | 49.8 | 60.2 | 65.5 | 73.8 | 70.0 |
| Departure from Normal | 7.80 | 5.80 | 0.20 | 3.70 | 2.50 |
| Precipitation (inches) | 2.11 | 1.08 | 4.84 | 2.38 | 4.38 |
| Departure from Normal | 0.79 | -2.12 | 1.50 | -1.00 | 0.28 |
| Growing Degree Days (base 32) | 532 | 876 | 1004 | 1294 | 1178 |
| Departure from Normal | 189 | 116 | -4.5 | 7.70 | 54.3 |
| *Based on National Weather Service data from cooperative observer stations in close proximity to field trials. Historical averages are for 30 years of data (1971-2000) | |||||
CULTURAL PRACTICES
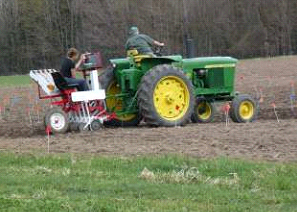
The seedbed at both the Alburgh and Willsboro locations were prepared by conventional tillage methods. All plots were managed with practices similar to those used by producers in the surrounding areas (Table 3). The Alburgh site had been perennial forages (reed canary and alfalfa) for the previous 10 years. In the fall of 2009 the area was moldboard plowed and in the spring of 2010 disked and spike-toothed harrowed to prepare for the planting. The plots in Alburgh were seeded with a Kincaid Cone Seeder on April 21st, 2010. Grain plots were harvested with an Almaco SP50 plot combine on July 30th, 2010.
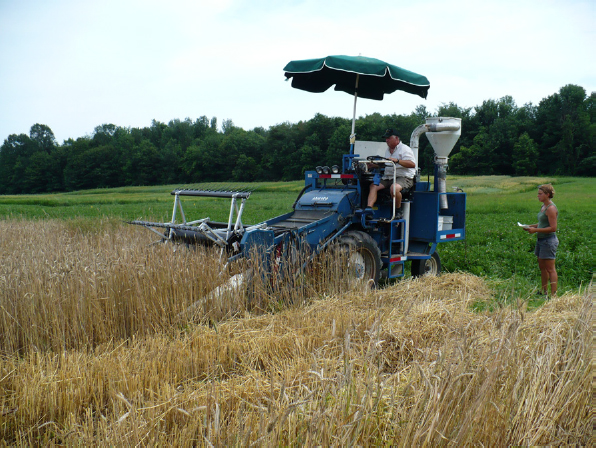
At the Willsboro location planting of the spring wheat followed a crop of food-grade soybeans. After the soybeans were harvested in the fall of 2009 the area was plowed and in the spring of 2010 it was disked and spike-toothed harrowed before planting. The plots were seeded on April 26th, 2010 with a custom made eight-row cone planter and harvested on August 2nd, 2010 with a Hege plot combine.
Following harvest, seed was cleaned with a small Clipper cleaner. An approximate one pound subsample was collected to determine quality. Quality measurements included standard testing parameters used by commercial mills. Test weight was measured by the weighing of a known volume of grain. Generally the heavier the wheat is per bushel, the higher baking quality. The acceptable test weight for bread wheat is 56-60 lbs per bushel. Once test weight was determined, the samples were then ground into flour using the Perten LM3100 Laboratory Mill. At this time flour was evaluated for its protein content, falling number, and mycotoxin levels. Grains were analyzed for protein content using the Perten Inframatic 8600 Flour Analyzer. Grain protein affects gluten strength and loaf volume. Most commercial mills target 14-15% protein. The determination of falling number (AACC Method 56-81B, AACC Intl., 2000) was measured on the Perten FN 1500 Falling Number Machine. The falling number is related to the level of sprout damage that has occurred in the grain. It is measured by the time it takes, in seconds, for a stirrer to fall through a slurry of flour and water to the bottom of the tube. Falling numbers greater than 350 indicate low enzymatic activity and sound quality wheat. A falling number lower than 200 indicates high enzymatic activity and poor quality wheat. Deoxynivalenol (DON) analysis was analyzed using Veratox DON 5/5 Quantitaive test from the NEOGEN Corp. This test has a detection range of 0.5 to 5 ppm. Samples with DON values greater than 1 ppm are considered unsuitable for human consumption.
All data was analyzed using a mixed model analysis where replicates were considered random effects. The LSD procedure was used to separate cultivar means when the F-test was significant (P< 0.10). There were significant differences among the two locations for most parameters and therefore data from each location is reported independently.
Table 3. General plot management of the wheat trials.
| Trial Information | Winter Wheat Variety Trial |
|
|---|---|---|
Location |
Alburgh, VT Borderview Farm |
Willsboro, NY Willsboro Research Farm |
| Soil type | Benson rocky silt loam | Kingsbury silt clay loam |
| Previous crop | Sod | Food-grad soybeans |
| Row spacing (in) | 6 | 6 |
| Seeding rate (lbs ac-1) | 150 | 150 |
| Replicates | 4 | 4 |
| Planting date | 4-21-10 | 4/26/2010 |
| Harvest date | 7-30-10 | 8/2/2010 |
| Harvest area (ft) | 5×20 | 4×13.5 |
| Tillage operations | Fall plow, spring disc & spike- toothed harrow | Fall plow, spring disk & spike-toothed harrow |
LEAST SIGNIFICANT DIFFERENCE (LSD)
Variations in yield and quality can occur because of variations in genetics, soil, weather, and other growing conditions. Statistical analysis makes it possible to determine whether a difference among varieties is real or whether it might have occurred due to other variations in the field. At the bottom of each table a LSD value is presented for each variable (e.g. yield). Least Significant Differences at the 10% level of probability are shown. Where the difference between two varieties within a column is equal to or greater than the LSD value at the bottom of the column, you can be sure in 9 out of 10 chances that there is a real difference between the two varieties. Wheat varieties that were not significantly lower in performance than the highest variety in a particular column are indicated with an asterisk. In the example below variety A is significantly different from variety C but not from variety B. The difference between A and B is equal to 725 which is less than the LSD value of 889. This means that these varieties did not differ in yield. The difference between A and C is equal to 1454 which is greater than the LSD value of 889. This means that the yields of these varieties were significantly different from one another. The asterisk indicates that variety B was not significantly lower than the top yielding variety.
| Variety | Yield |
| A B C |
3161 3886* 4615 |
| LSD | 889 |
RESULTS
Spring Wheat Growth and Development:
During the 2010 growing season several observations and measurements were recorded on wheat development. All varieties at the Alburgh location emerged by May 1, 2010. The relative flowering date was recorded for each of the varieties at the Alburgh site (Table 4). The majority of varieties at both locations flowered during the fourth week of June. Bird deterrents; squawk boxes and owl decoys, were place in and around the plot area which appeared to help reduce bird presence in the Alburgh plots. There did not appear to be bird issues at the Willsboro location. At both sites minimal bird damage was recorded. Lodging amongst the varieties trialed, in general was minimal. Two varieties, Kinsey and Bastican, were noted to be wispier and leaning at both locations. Ergot, Claviceps purpurea, was observed in two varieties, Glenn and Tom, in Willsboro.
Table 4. Relative flowering date of spring wheat, Alburgh.
| Variety | Early | Mid | Late |
|---|---|---|---|
| 3rd Wk June | 4th Wk June | 1st Wk July | |
| AC Barrie | X | ||
| AC McKenzie | X | ||
| AC Roblin | X | ||
| AC Superb | X | ||
| AC Walton | X | ||
| Ada | X | ||
| Batiscan | X | ||
| Cabernet | X | ||
| Faller | X | ||
| FBC Dylan | X | ||
| Glenn | X | ||
| Helios | X | ||
| Howard | X | ||
| HRS10181J | X | ||
| HRS10182J | X | ||
| HRS7001J | X | ||
| Kaffe | X | ||
| Kelse | X | ||
| Kinsey | X | ||
| Magog | X | ||
| Melbec | X | ||
| Nick | X | ||
| Oklee | X | ||
| RB07 | X | ||
| Red Fife | X | ||
| Sabin | X | ||
| SD7006J | X | ||
| Steele | X | ||
| Tom | X | ||
| Ulen | X |
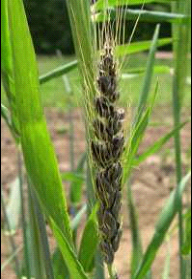
Loose smut caused by the fungus, Ustilago tritici, was observed at both locations. At the Alburgh location, six varieties; Steele, Sabin, Red Fife, AC Roblin, Glenn, and FBC Dylan infected plants were observed, and in Willsboro loose smut was found in the AC Roblin and Glenn plots. The loose smut fungus is carried as dormant mycelium within healthy-looking seed and is spread by planting infected seed. A smut-infected seed or plant cannot be distinguished from an uninfected one until the head starts to emerge. The disease is most obvious just after the time of heading by the characteristic dusty black appearance of diseased heads (Image 2). The spores are dispersed by the wind during wheat flowering and can infect healthy plants.
After the wheat reached physiological maturity, plant heights were measured. Plant heights and weed biomass are reported in Tables 5 and 6. Plant heights were significantly different among varieties. At both locations Red Fife was the tallest variety and the shortest vairety was SD7006J, a durum wheat. There was considerable variation in the amount of weed biomass in plots. This was mostly likely related to varying weed seed banks across the test area. Due to this variation in weed biomass we did not observe significant differences among treatments. The weed pressure at the Alburgh location was severe and there was uneven pressure across the field. There was no correlation between weed biomass and wheat height. We had predicted that taller wheat would be better able to suppress weed growth. However, we observed that some of shorter wheat varieties had the lowest weed biomass. Early season vigor may be another factor that has influence over weed biomass in our fields. In Willsboro there was far less weed pressure and for several varieties there was no weed biomass reported.
Table 5. Plant heights & weed biomass, Alburgh, VT
| Variety | Plant Height | Weed biomass |
|---|---|---|
| inches | lbs ac -1 | |
| AC Barrie | 36.2 | 1788 |
| AC McKenzie | 37.0 | 1350 |
| AC Roblin | 32.4 | 27.44 |
| AC Superb | 31.1 | 2164 |
| AC Walton | 37.1 | 1208 |
| Ada | 28.1 | 1524 |
| Batiscan | 39.4 | 1187 |
| Cabernet | 22.1 | 3048 |
| Faller | 32.4 | 1154 |
| FBC Dylan | 31.8 | 923 |
| Glenn | 32.4 | 1306 |
| Helios | 33.4 | 2523 |
| Howard | 27.0 | 1700 |
| HRS10181J | 30.8 | 1733 |
| HRS10182J | 28.9 | 2668 |
| HRS7001J | 37.0 | 1620 |
| Kaffe | 39.9 | 1570 |
| Kelse | 29.4 | 1378 |
| Kinsey | 41.1 | 1410 |
| Magog | 38.7 | 1353 |
| Melbec | 25.3 | 1844 |
| Nick | 25.7 | 1495 |
| Oklee | 30.6 | 2165 |
| RB07 | 27.2 | 567 |
| Red Fife | 44.7* | 1140 |
| Sabin | 29.6 | 2883 |
| SD7006J | 21.3 | 2009 |
| Steele | 30.3 | 1319 |
| Tom | 30.0 | 2812 |
| Ulen | 30.0 | 1008 |
| Trial Mean | 32.0 | 1720 |
| LSD (0.10) | 2.80 | NS |
| *Wheat varieties that are not significantly different than the top performing variety in a column are indicated with an asterisk. NS – None of the varieties were significantly different from one another. |
||
Table 6. Plant heights & weed biomass, Willsboro, NY
| Variety | Plant Height | Weed biomass |
|---|---|---|
| inches | lbs ac -1 | |
| AC Barrie | 36.3 | 132 |
| AC McKenzie | 34.9 | 28.8 |
| AC Roblin | 31.4 | 84.8 |
| AC Superb | 31.5 | 59.0 |
| AC Walton | 39.3 | 28.8 |
| Ada | 28.4 | 144 |
| Batiscan | 38.9 | 0.0 |
| Cabernet | 25.3 | 180 |
| Faller | 31.3 | 35.3 |
| FBC Dylan | 29.2 | 143 |
| Glenn | 30.6 | 0.00 |
| Helios | 35.5 | 0.00 |
| Howard | 28.9 | 39.0 |
| HRS10181J | 29.8 | 114 |
| HRS10182J | 29.2 | 121 |
| HRS7001J | 33.8 | 45.0 |
| Kaffe | 38.4 | 15.8 |
| Kelse | 29.2 | 42.8 |
| Kinsey | 38.3 | 156 |
| Magog | 36.1 | 0.00 |
| Melbec | 25.3 | 293 |
| Nick | 28.3 | 2.21 |
| Oklee | 29.3 | 21.5 |
| RB07 | 28.0 | 43.8 |
| Red Fife | 42.8* | 0.00 |
| Sabin | 28.8 | 8.75 |
| SD7006J | 23.6 | 0.00 |
| Steele | 29.8 | 0.00 |
| Tom | 30.7 | 75.3 |
| Ulen | 28.3 | 46.5 |
| Trial Mean | 31.7 | 62.0 |
| LSD (0.10) | 1.35 | NS |
| *Wheat varieties that are not significantly different than the top performing variety in a column are indicated with an asterisk. NS – None of the varieties were significantly different from one another. |
||
Spring Wheat Yield:
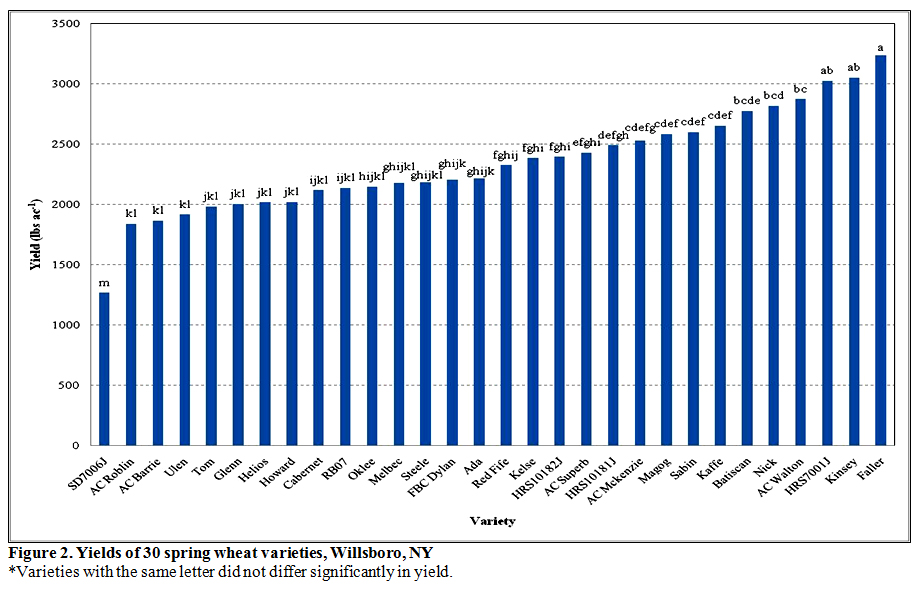
The highest yielding variety in Alburgh, 2078 lbs ac-1 was HRS7001J (Table 7 and Figure 1). Other top yielding varieties included Kaffe, Kinsey and Batiscan. The lowest yielding variety was SD7006J, a durum wheat, 271 lbs ac-1. Other low yielding varieties included Cabernet, AC Barrie, Howard, and Nick. Weed pressure at this location severely impacted grain yields. At the Willsboro location the highest yielding variety, 3,235 lbs ac-1 was Faller (Table 8 and Figure 2). The other top yielding varieties included Kinsey and HRS7001. Kinsey and HRS7001 were among the highest yielding varieties at both locations. At harvest Red Fife had the highest grain moisture and Nick had the lowest recorded grain moisture at both locations. In Alburgh, Tom had the highest test weight 58.3 lbs bu-1 and in Willsboro Ada had the highest test weight 59.6 lbs bu-1. It’s no surprise that the durum, SD7006J, had the lowest test weight at both locations. In general, most varieties reached the optimal 55 to 60 lb bu-1 test weight for wheat.
Table 7. Harvest data of the 30 spring wheat, Alburgh, VT
| Variety | Harvest moisture | Test weight | Yield@13.5% moisture |
|---|---|---|---|
| % | lbs bu-1 | lbs ac -1 | |
| AC Barrie | 16.7 | 54.5 | 845 |
| AC McKenzie | 13.6 | 56.0* | 1146 |
| AC Roblin | 12.0 | 51.3 | 1097 |
| AC Superb | 16.2 | 53.1 | 1297 |
| AC Walton | 19.3* | 51.6 | 1222 |
| Ada | 12.2 | 55.9* | 1011 |
| Batiscan | 16.5 | 55.3* | 1661* |
| Cabernet | 13.9 | 51.3 | 517 |
| Faller | 16.9 | 56.4* | 1580 |
| FBC Dylan | 13.5 | 55.6* | 1286 |
| Glenn | 11.1 | 55.3* | 1063 |
| Helios | 13.4 | 55.0* | 1148 |
| Howard | 16.1 | 51.0 | 911 |
| HRS10181J | 15.9 | 50.8 | 1241 |
| HRS10182J | 17.4* | 54.5 | 1345 |
| HRS7001J | 15.9 | 49.3 | 2078* |
| Kaffe | 15.0 | 56.3* | 2009* |
| Kelse | 13.2 | 54.9* | 1530 |
| Kinsey | 18.7* | 53.0 | 1794* |
| Magog | 15.3 | 52.6 | 1281 |
| Melbec | 12.6 | 47.0 | 1149 |
| Nick | 10.9 | 51.0 | 981 |
| Oklee | 14.2 | 55.9* | 1130 |
| RB07 | 15.8 | 57.0* | 1113 |
| Red Fife | 19.7* | 50.8 | 1083 |
| Sabin | 13.2 | 55.1* | 1247 |
| SD7006J | 16.5 | 39.0 | 271 |
| Steele | 16.3 | 55.5* | 1222 |
| Tom | 17.3* | 58.3* | 1298 |
| Ulen | 12.6 | 56.6* | 1277 |
| Trial Mean | 15.1 | 53.3 | 1228 |
| LSD (0.10) | 2.51 | 3.38 | 473 |
| *Wheat varieties that are not significantly different than the top performing variety in a column are indicated with an asterisk. |
|||
Table 8. Harvest data of the 30 spring wheat, Willsboro, NY
| Variety | Harvest moisture | Test weight | Yield@13.5% moisture |
|---|---|---|---|
| % | lbs bu-1 | lbs ac -1 | |
| AC Barrie | 15.1 | 55.3 | 1864 |
| AC McKenzie | 14.3 | 57.9 | 2527 |
| AC Roblin | 12.1 | 55.6 | 1838 |
| AC Superb | 16.4 | 56.4 | 2429 |
| AC Walton | 17.5 | 54.4 | 2872 |
| Ada | 13.2 | 59.6* | 2215 |
| Batiscan | 14.8 | 56.9 | 2774 |
| Cabernet | 10.9 | 56.3 | 2117 |
| Faller | 16.8 | 56.8 | 3235* |
| FBC Dylan | 13.0 | 57.0 | 2202 |
| Glenn | 16.2 | 58.8 | 2001 |
| Helios | 13.6 | 57.3 | 2013 |
| Howard | 14.3 | 58.5 | 2017 |
| HRS10181J | 13.9 | 56.8 | 2489 |
| HRS10182J | 15.0 | 57.5 | 2394 |
| HRS7001J | 17.8 | 54.0 | 3024* |
| Kaffe | 13.5 | 58.0 | 2653 |
| Kelse | 15.3 | 57.8 | 2383 |
| Kinsey | 17.0 | 56.6 | 3051* |
| Magog | 17.2 | 54.3 | 2582 |
| Melbec | 13.2 | 56.0 | 2175 |
| Nick | 11.3 | 58.0 | 2818 |
| Oklee | 15.1 | 58.1 | 2147 |
| RB07 | 12.4 | 58.3 | 2136 |
| Red Fife | 19.8* | 50.4 | 2325 |
| Sabin | 12.3 | 57.1 | 2599 |
| SD7006J | 13.6 | 49.0 | 1266 |
| Steele | 15.1 | 58.3 | 2183 |
| Tom | 13.9 | 57.9 | 1980 |
| Ulen | 12.7 | 56.6 | 1916 |
| Trial Mean | 14.6 | 56.5 | 2341 |
| LSD (0.10) | 1.60 | 1.36 | 352 |
| * Wheat that did not perform significantly lower than the top performing variety in a particular column are indicated with an asterisk. | |||
Figure 1. Yields of 30 spring wheat varieties, Alburgh, VT.
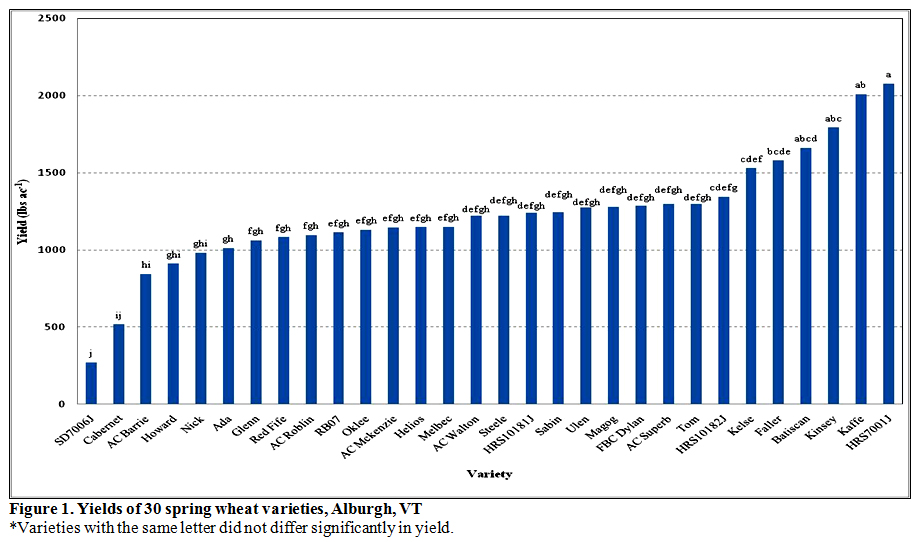
Figure 2. Yields of 30 spring wheat varieties, Willsboro, NY.
Spring Wheat Quality:
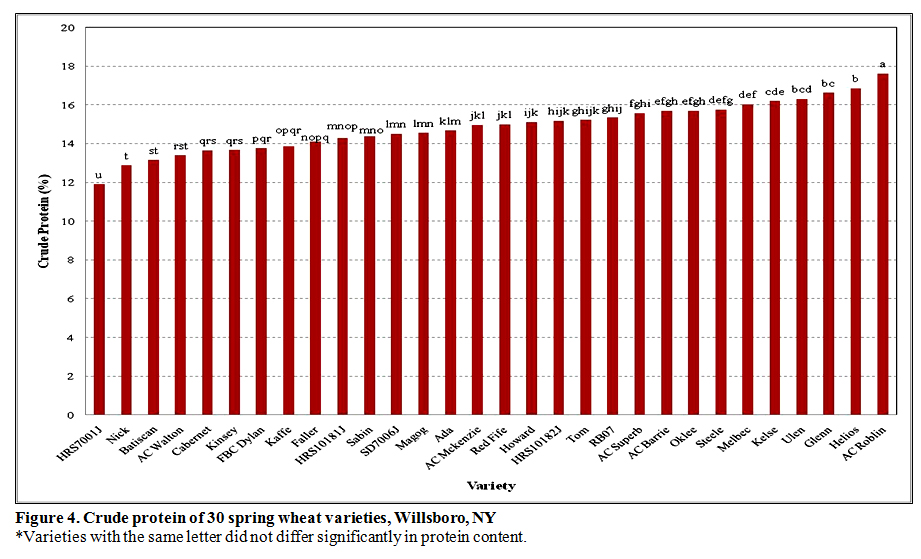
The common measures used by commerial mills to evaluate wheat quality are: grain protein, falling number, test weight, and mycotoxin (DON) content. In Alburgh, the varieties with the highest protein content were SD7006J, 17.5% and Melbec, 16.4% (Table 9 and Figure 3). At the Willsboro location AC Roblin had the highest protein level at 17.6% (Table 10 and Figure 4). The lowest protein content was HRS7001J in both locations. Interestingly the lowest protein content of the spring wheat was still 1.5% higher than the highest protein level of winter wheat trialed. Helios had the highest falling number at both locations. In Willsboro, the falling number of AC Barrie was statistically similar to Helios. Other varieties with high falling numbers included Ada and FBC Dylan. Almost every variety had acceptable protein and falling number levels based on mill standards. In the Northeast, Fusarium head blight is predominantly caused by the species Fusarium graminearum. This disease is very destructive and causes yield loss, low test weights, low seed germination and contamination of grain with mycotoxins. A vomitoxin called deoxynivalenol (DON) is considered the primary mycotoxin associated with FHB. The spores are usually transported by air currents and can infect plants at flowering through grain fill. Eating contaminated grain, >1ppm, poses a health risk to both humans and livestock. Unfortunately all of the spring wheat trialed at the Alburgh location had DON levels that exceeded the FDA’s 1ppm regulation. It was a relatively dry season, but a rainy period occurred during the spring wheat flowering stage resulting in ideal environmental conditions for disease infection. In addition, there was high weed pressure in all of the plots; most likely increasing humidity and creating an ideal environment for fungal growth. The Willsboro site had 10 varieties that exceeded the 1ppm limit.
Table 9. Quality analyses of the 30 spring wheat varieties, Alburgh, VT
| Variety | Crude protein @ 14% moisture | Falling number @ 14% moisture | DON |
|---|---|---|---|
| % | seconds | ppm | |
| AC Barrie | 16.4 | 394* | 3.28 |
| AC McKenzie | 15.0 | 377 | 2.18 |
| AC Roblin | 15.6 | 358 | 2.33 |
| AC Superb | 14.7 | 345 | 4.93 |
| AC Walton | 15.3 | 357 | 2.13 |
| Ada | 14.3 | 404* | 3.28 |
| Batiscan | 12.5 | 160 | 5.48 |
| Cabernet | 14.6 | 328 | 4.45 |
| Faller | 14.1 | 341 | 2.33 |
| FBC Dylan | 13.5 | 403* | 2.78 |
| Glenn | 15.6 | 334 | 2.03 |
| Helios | 15.6 | 414* | 2.30 |
| Howard | 13.4 | 318 | 3.28 |
| HRS10181J | 15.0 | 280 | 3.33 |
| HRS10182J | 14.1 | 326 | 3.98 |
| HRS7001J | 12.1 | 302 | 3.35 |
| Kaffe | 13.4 | 288 | 4.10 |
| Kelse | 15.8 | 315 | 4.53 |
| Kinsey | 13.8 | 377 | 3.65 |
| Magog | 15.5 | 384 | 3.05 |
| Melbec | 16.4* | 309 | 4.03 |
| Nick | 12.7 | 187 | 6.88 |
| Oklee | 15.2 | 362 | 3.75 |
| RB07 | 14.9 | 344 | 2.43 |
| Red Fife | 15.8 | 305 | 2.10 |
| Sabin | 16.5* | 351 | 1.63 |
| SD7006J | 17.5* | 321 | 8.88* |
| Steele | 14.9 | 319 | 3.40 |
| Tom | 13.3 | 381 | 1.68 |
| Ulen | 15.0 | 288 | 3.10 |
| Trial Mean | 14.7 | 332 | 3.49 |
| LSD (0.10) | 1.41 | 24.0 | 1.34 |
| * Wheat that did not perform significantly lower than the top performing variety in a particular column are indicated with an asterisk. | |||
Table 10. Quality analyses of the 30 spring wheat varieties, Willsboro, NY
| Variety | Crude protein @ 14% moisture | Falling number @ 14% moisture | DON |
|---|---|---|---|
| % | seconds | ppm | |
| AC Barrie | 15.7 | 461* | 0.43 |
| AC McKenzie | 15.0 | 379 | 0.45 |
| AC Roblin | 17.6* | 400 | 0.43 |
| AC Superb | 15.6 | 398 | 2.10 |
| AC Walton | 13.4 | 362 | 0.30 |
| Ada | 14.7 | 448* | 0.83 |
| Batiscan | 13.2 | 213 | 1.08 |
| Cabernet | 13.7 | 348 | 2.40 |
| Faller | 14.1 | 358 | 0.70 |
| FBC Dylan | 13.8 | 435* | 0.60 |
| Glenn | 16.6 | 335 | 0.58 |
| Helios | 16.9 | 461* | 0.63 |
| Howard | 15.1 | 366 | 1.23 |
| HRS10181J | 14.3 | 320 | 0.68 |
| HRS10182J | 15.2 | 396 | 1.75 |
| HRS7001J | 11.9 | 290 | 0.15 |
| Kaffe | 13.9 | 334 | 0.40 |
| Kelse | 16.2 | 329 | 2.35 |
| Kinsey | 13.7 | 400 | 0.30 |
| Magog | 14.6 | 419 | 0.38 |
| Melbec | 16.0 | 349 | 2.15 |
| Nick | 12.9 | 219 | 2.03 |
| Oklee | 15.7 | 408 | 0.88 |
| RB07 | 15.4 | 380 | 0.58 |
| Red Fife | 15.0 | 327 | 0.35 |
| Sabin | 14.4 | 428 | 0.33 |
| SD7006J | 14.5 | 327 | 5.90* |
| Steele | 15.8 | 371 | 1.28 |
| Tom | 15.2 | 434* | 0.80 |
| Ulen | 16.3 | 317 | 0.73 |
| Trial Mean | 14.9 | 367 | 1.09 |
| LSD (0.10) | 0.56 | 27.5 | 0.71 |
| * Wheat that did not perform significantly lower than the top performing variety in a particular column are indicated with an asterisk. | |||
Figure 3. Crude protein of 30 spring wheat varieties, Alburgh, VT.
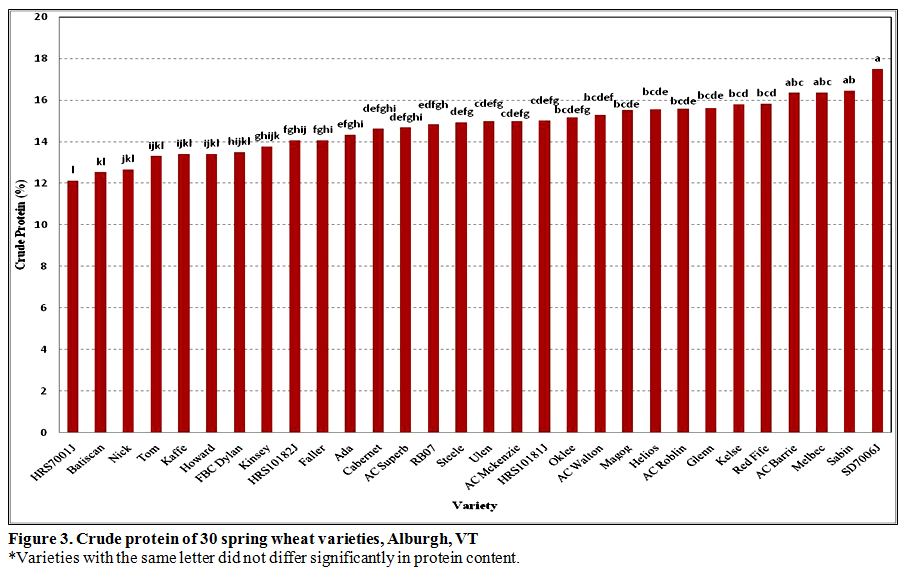
Figure 4. Crude protein of 30 spring wheat varieties, Willsboro, NY.
DISCUSSION
It is important to remember that the results only represent one year of data. However, a few generalizations can be made from this past season. At the Alburgh location the high weed pressure severely impacted both yield and quality of the wheat. In many cases varieties yielded half as much as compared to the same varieties in Willsboro. The weeds created an ideal micro environment for fungal growth and probably contributed to the high DON readings. It’s difficult to make any direct correlations between the two sites since the Alburgh plots were so severely impacted by weeds.
It is interesting to note however that the durum wheat, SD7006J at both locations, had the highest DON levels and the lowest yields. Durum wheat, not traditionally grown in the northeast, tends to thrive in drier climates which may explain the low yields and higher disease susceptibility. Across both sites, the variety Kinsey and 7001J were top yielding varieties but did not rank the highest in quality. There were many varieties that met the high baking quality standards.
Acknowledgements. The UVM Extension Crops and Soils Team would like to thank the Borderview Research Farm and the Willsboro Research Farm for their generous help with the trials and acknowledge the USDA OREI grants program for their financial support. Any reference to commercial products, trade names, or brand names is for information only, and no endorsement or approval is intended.
Published and distributed in furtherance of Acts of Congress of May 8 and June 30, 1914, by the University of Maine Cooperative Extension, the Land Grant University of the state of Maine and the U.S. Department of Agriculture cooperating. Cooperative Extension and other agencies of the U.S.D.A. provide equal opportunities in programs and employment. Call 800.287.0271 (in Maine) or 207.581.3188, for information on publications and program offerings from University of Maine Cooperative Extension, or visit extension.umaine.edu.