2011 Organic Spring Wheat Variety Trials – Maine & Vermont
2011 Maine & Vermont Organic Spring Wheat Variety Trial Results (PDF)
Ellen Mallory, Heather Darby, Thomas Molloy, Erica Cummings, Katherine McPhee
Note: 2011 proved to be a very challenging year, especially in Vermont, where unusually wet springs resulted in poor stands and plant vigor.
Bread wheat has emerged as a new crop to farmers in Northern New England as consumer demand for locally grown foods increases. In 2010, the University of Maine and University of Vermont began a series of trials evaluating varieties of hard red wheat to identify those that perform well in northern New England under organic production. This publication presents results for spring wheat varieties. A separate publication is available for winter wheat varieties. Separate publications are available for winter wheat varieties and 2010 trials.
In Maine, trials were established at two locations: the University of Maine Rogers Farm Forage and Crop Research Facility in Old Town and Rainbow Valley Farm, a commercial dairy farm in Sidney. For Vermont, one trial was established at the Borderview Research Farm in Alburgh and another at Cornell University’s Willsboro Research Farm in Willsboro, NY. This collaborative work was funded by a grant from the USDA Organic Agriculture Research and Extension Initiative to improve bread wheat production in our region.
TRIAL DESIGN AND VARIETIES
The experimental design was a randomized complete block with four replications, which means that each variety was planted in four separate plots at each location. The spring wheat varieties that were evaluated are listed in Table 1. All are hard red types except for two soft white types. Hard wheat varieties are preferred for bread flour.
Table 1. Spring wheat varieties planted in Maine, New York, and Vermont.
| Variety | Type† | Origin and Release Year‡ | Seed Source |
|---|---|---|---|
| AC Barrie | HR | AAFC§, Saskatchewan, 1994 | Farm-saved seed, ME |
| AC Walton | HR | AAFC, PEI, 1995 | Grand Falls Milling Co., Canada |
| Ada | HR | MAES, 2006 | Albert Lea Seed House, MN |
| Barlow | HR | NDAES, 2009 | NDSU |
| Batiscan | HR | Semican | Semican, Canada |
| Brick | HR | SDAES, 2000 | NDSU |
| Cabernet | HR | Resource Seed, PNW, 2001 | Tri-State Seeds, WA |
| Duo | HR | Canada | Grand Falls Milling Co., Canada |
| Faller | HR | NDAES, 2007 | NDSU |
| FBC Dylan | HR | NPSAS/FBC, 2006 | Farm-saved seed, ME |
| Glenn | HR | NDAES, 2005 | Johnny’s Selected Seeds, ME |
| Helios | HR | AAFC, Saskatchewan, 1996 | La Coop de Federee |
| Howard | HR | NDAES, 2006 | NDSU |
| Jenna | HR | Agripro Syngenta, 2009 | Albert Lea Seed House, MN |
| Kaffe | SW | Semican | Semican |
| Kelse | HR | WSU, 2008 | Farm-saved seed, ME |
| Kingsey | HR | Semican Inc. | Semican Atlantic Inc., Canada |
| Magog | HR | Semican Inc. | Semican Atlantic Inc., Canada |
| Malbec | HR | Agripro Syngenta, PNW | Tri-State Seeds, WA |
| McKenzie | HR | 1997 | Semican, Canada |
| Nick | SW | Western Plant Breeders, 2004 | WSU |
| 07SW04 | HR | Western Canada | Semican Atlantic Inc., Canada |
| Oklee | HR | MAES, 2003 | Univ. of MInnesota |
| RBO7 | HR | MAES, 2007 | Univ. of Minnesota |
| Red Fife | HR | Heritage var., ca. 1860 | Fedco Seeds, ME |
| Roblin | HR | ACRS, Winnipeg, 1986 | Farm-saved seed, ME |
| Sabin | HR | MAES, 2009 | Univ. of Minnesota |
| Steele-ND | HR | NDAES, 2004 | Albert Lea Seed House, MN |
| Superb | HR | AAFC, Winnipeg, 2001 | Oliver Seed Co., VT |
| Tom | HR | MAES, 2008 | Univ. of Minnesota |
| Ulen | HR | MAES, 2005 | Univ. of Minnesota |
| † HR = hard red , SW = soft white ‡ Year of release was not always available. § Abbreviations: ACRS = Agriculture Canada Research Station, AAFC = Agriculture and Agri-Food Canada, FBC = Farmer Breeder Club, MAES = Minnesota Agricultural Experiment Station, NDAES = North Dakota Agricultural Experiment Station, NDSU = North Dakota State University, NPSAS = North Plains Sustatinable Agriculture Society, PEI = Prince Edward Island, PNW = Pacific Northwest, SDAES = South Dakota Agricultural Experiment Station, WSU = Washington State Univ. |
|||
WEATHER DATA
Seasonal precipitation and temperature were recorded at or near field locations (Table 2). The Old Town and Willsboro location each had weather stations in close proximity to the trials. The nearest stations to the Alburgh and Sidney sites were located in South Hero and Waterville, respectively. Spring precipitation was higher than usual at all sites, particularly in Alburgh and Willsboro. Alburgh and Willsboro spring temperatures were also higher than usual. June and July precipitation levels were close to 30-year averages at all sites except Willsboro, which experienced a substantially drier than usual summer. Summer temperatures departed from normal somewhat at each site; Maine sites were slightly cooler than normal, while Alburgh and Willsboro sites were slightly warmer than usual.
Table 2. Temperature and precipitation summary for Old Town, ME, South Hero, VT, Waterville, ME, and Willsboro, NY, 2011.†
| Location | April | May | June | July | August | Total |
|---|---|---|---|---|---|---|
| Old Town, ME | ||||||
| Total Precipitation (in.) | 5.7 | 3.8 | 4.2‡ | 2.1 | 8.8 | 24.6 |
| Departure from Normal | 2.5 | 0.5 | 0.6 | -1.3 | 5.6 | 7.9 |
| Average Temperature (°F) | 41.8 | 53.9 | 60.6 | 69.2 | 66.2 | — |
| Departure from Normal | -0.2 | 0.0 | -2.1 | 0.8 | 0.1 | — |
| Growing Degree Days§ | 294 | 680 | 844 | 1127 | 1061 | 4006 |
| South Hero, VT | ||||||
| Total Precipitation (in.) | 7.9 | 8.7 | 3.5 | 3.7 | 10.2 | 34.0 |
| Departure from Normal | 5.0 | 5.4 | 0.1 | -0.3 | 6.4 | 16.6 |
| Average Temperature (°F) | 46.6 | 58.7 | 67.1 | 74.4 | 70.4 | — |
| Departure from Normal | 3.1 | 2.1 | 1.3 | 3.3 | 1.6 | — |
| Growing Degree Days§ | 465 | 826 | 1088 | 1314 | 1121 | 4814 |
| Waterville, ME | ||||||
| Total Precipitation (in.) | 4.3‡ | 4.3 | 1.8 | 3.6 | 6.3 | 20.3 |
| Departure from Normal | 0.9 | 0.6 | 2.0 | 0.0 | 2.9 | 6.4 |
| Average Temperature (°F) | 43.4 | 55.3 | 63.0 | 71.1 | 68.5 | — |
| Departure from Normal | 1.4 | 1.1 | -0.1 | 2.1 | 1.4 | — |
| Growing Degree Days§ | 340 | 723 | 930 | 1213 | 1134 | 4340 |
| Willsboro, NY | ||||||
| Total Precipitation (in.) | 6.6 | 7.8 | 2.8 | 1.8 | 5.8 | 24.8 |
| Departure from Normal | 5.3 | 4.6 | -5.3 | -1.6 | 1.7 | 4.7 |
| Average Temperature (°F) | 45.7 | 58.3 | 66.2 | 73.0 | 69.6 | — |
| Departure from Normal | 1.8 | 3.9 | 0.9 | 2.9 | 2.1 | — |
| Growing Degree Days§ | 423 | 809 | 1064 | 1277 | 1181 | 4754 |
| † Based on National Weather Service data from cooperative observer stations in close proximity to field trials available at http://www.ncdc.noaa.gov/crn/report. Historical averages are for 30 years (1971-2000) available at https://www.ncdc.noaa.gov/cdo-web/datatools/normals ‡ Values are incomplete due to missing or suspect data. § Base 32°F |
||||||
CULTURAL PRACTICES
Plots were managed following practices similar to those used by farmers in New England (see Table 3).
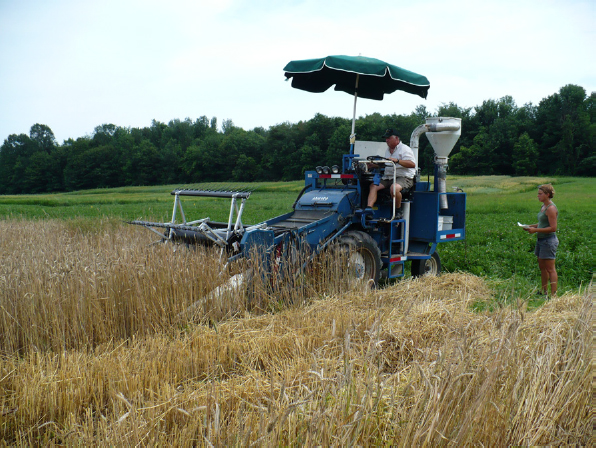
Rogers Research Farm – Old Town, ME – The trial was conducted on a field that was in silage corn in 2010. Primary tillage was done with a chisel plow on May 2. Solid dairy manure was spread at a rate of 24 ton/acre on May 8 and immediately incorporated with a Perfecta harrow. Plots were seeded on May 9 with an Almaco cone seeder. Weeds were managed with two separate spring tine cultivation events on June 3 and 6. The plots were harvested on August 19 with a Wintersteiger Classic plot combine. Harvest area was 4′ x 34′.
Rainbow Valley Farm – Sidney, ME – The previous crop in this field was high moisture ear corn. The site was moldboard plowed on May 2. Liquid manure was then applied at a rate of 6900 gallons/acre and immediately incorporated with a disk harrow. On May 3, the field was disk harrowed again and then plots were planted using an Almaco cone seeder. The plots were harvested on August 12 with a Wintersteiger Classic plot combine. Harvest area was 4′ x 34′.
Borderview Research Farm – Alburgh, VT – The previous crop was winter wheat. In September 2010, 2 tons/acre of Giroux’s composted poultry manure (2-3-2) was applied and incorporated. In April 2011, the field was disked and spike-tooth harrowed to prepare for planting. Plots were seeded with a Kincaid cone seeder on May 2. The plots were tine weeded with a 12 ft. Kovar Tine Weeder on May 27 and June 4. ‘Pro-Gro’ fertilizer (5-3-4), a blend of vegetable and animal meal, was applied as a topdressing on June 15 at a rate of 50 lbs of available N/acre. The plots were harvested on August 17 with an Almaco SPC50 plot combine. Harvest area was 5′ x 20′.
Willsboro Research Farm – Willsboro, NY – The previous crop was a third year of timothy/alfalfa sod. The field was plowed in August 2009 and fallowed prior to planting, which included dragging the field twice to eliminate any remaining alfalfa and perennial grasses. In April, the field was disked and spike-tooth harrowed to prepare for planting. The plots were seeded on May 13 with a custom made eight-row cone planter, and harvested on August 19 with a Hege plot combine. Harvest area was 4′ x 13′.
Table 3. General plot management of the 2011 spring wheat trials.
| Location | Rogers Research Farm Old Town, ME |
Rainbow Valley Farm Sidney, ME |
Borderview Farm Alburgh, VT |
Willsboro Research Farm Willsboro, NY |
|---|---|---|---|---|
| Soil type | Melrose & Elmwood fine sandy loam | Buxton silt loam | Benson rocky silt loam | Kingsbury silt clay loam |
| Previous crop | Silage corn | High moisture ear corn | Winter wheat | Timothy/Alfalfa sod |
| Fertility source | Solid dairy manure | Liquid dairy manure | Pro-Gro (5-3-4) | Pro-Gro (5-3-4) |
| Target nitrogen rate (lbs/ac) | 70 | 70 | 70 | 70 |
| Row spacing (in) | 6.5 | 6.5 | 6 | 6 |
| Seeding rate (seeds/ft2)† | 30 | 30 | 33 | 33 |
| Replicates | 4 | 4 | 4 | 4 |
| Planting date | 5-9-11 | 5-3-11 | 5-2-11 | 5-13-11 |
| Harvest date | 8-19-11 | 8-12-11 | 8-17-11 | 8-19-11 |
| Harvest area (ft2) | 4′ x 34′ | 4′ x 34′ | >5′ x 20′ | 4′ x 13′ |
| Tillage operations | Moldboard plow, seedbed conditioner | Moldboard plow, disk harrow, chisel plow | Fall plow, spring disk & spike-toothed harrow | Fall plow, spring disk & spike-toothed harrow |
| † The target seeding rate was calculated to achieve the same plant density for each variety. This translated to 70-140 lbs seed/acre (average 113), and depended on the seed weight of each variety. | ||||
MEASUREMENTS AND METHODS
Flowering date was recorded for each variety where possible. Once the wheat reached physiological maturity, plant height, number of tillers, and wheat and weed above-ground biomass were measured. Only tillers with filled grain heads (spikes) were counted. For biomass, plants were cut one inch above the soil surface. Prior to harvest, the incidence and severity of lodging was noted for each plot.
All varieties were harvested on the same day at each site once the latest maturing variety threshed free in hand tests, and weather and logistics allowed. Following harvest, grain was cleaned with a small Clipper cleaner and weights were recorded. Harvest moisture and test weights were determined using a DICKEY-john GAC 2100 grain moisture meter.
Subsamples were ground into flour using a Perten LM3100 Laboratory Mill. The ground material was then analyzed for crude protein, falling number, and mycotoxin levels. Protein content was determined using a Perten Inframatic 8600 Flour Analyzer. Most commercial mills target 12-15% protein. Falling number was determined on a Perten FN 1500 Falling Number Machine. The falling number is related to the level of sprout damage that has occurred in the grain due to enzymatic activity. It is measured as the time it takes, in seconds, for a plunger to fall through a slurry of flour and water to the bottom of the tube. Falling numbers less than 200 seconds indicate high enzymatic activity and poor wheat quality wheat. Concentrations of deoxynivalenol (DON), a mycotoxin produced by the fungus that causes Fusarium head blight, was determined using Veratox DON 2/3 Quantitative test from the NEOGEN Corp. This test has a detection range of 0.5 to 5 ppm. Samples with DON values greater than 1 ppm are considered unsuitable for human consumption.
All data were analyzed using mixed model Analysis of Variance (ANOVA) in which replicates were considered random effects. The LSD procedure was used to separate variety averages when the ANOVA F-test was significant (P<0.05). There were significant differences between the locations for most parameters, so results from each location are reported independently.
WHAT IS A SIGNIFICANT DIFFERENCE?Variations in yield and quality can occur not only due to genetics but also due to variability in soil, weather, and other growing conditions. Statistical analysis makes it possible to determine whether a difference between two varieties is real or whether it might have occurred due to other variability in the field. The Least Significant Difference (LSD) is the minimum difference needed between two averages to consider them statistically different. LSDs at the 5% level of probability are presented at the bottom of each table for each measure. Where the difference between two varieties within a column is equal to or greater than the LSD value, you can be sure in 19 out of 20 chances that there is a real difference between the two varieties. In the example below, variety A is significantly different from variety C because the difference between their yields (1454) is greater than the LSD value (889). Variety A is not significantly different from variety B because the difference between their yields (725) is less than the LSD value (889). Throughout this bulletin, the greatest value at each site for each measure is indicated with an underline and bold type. Varieties that are not significantly different from the greatest value are also in bold type. Using the example below, variety C had the highest measured yield (underlined and bolded) but it was not significantly different than the yield of variety B (bolded). Example Table
|
RESULTS
Growth and Development
Challenging conditions at planting time and during early crop growth due to a wet spring had major negative impacts on plant stands and overall vigor, especially in Alburgh and Willsboro. Weed pressure also was quite high at these locations. In general, minimal lodging and wildlife damaged was noted in Maine. Due to preventive measures (bird deterrents) wildlife damage was minimal at Alburgh, however in Willsboro damage was severe in some areas of the field due to wild turkeys.
Flowering started first at the Sidney site, with Brick and Roblin flowering on June 27. The Alburgh and Old Town site flowered during the first week of July, and the Willsboro site flowered a week later (Table 4). Brick and Roblin were two of the earliest varieties to flower at most sites, while Kingsey and Red Fife were two of the latest.
The number of spikes per unit area is influenced by tillering, which can be influenced by planting date, weather, fertility, and variety. The Old Town and Sidney sites had the highest average number of spikes per square foot, 49 and 47 respectively (Table 4). Spike numbers at the Alburgh site were low, 31 spikes per square foot, which might reflect poor initial stands as well as tillering. Brick and Glenn had consistently high spike numbers across sites. Other top spike-producing varieties were Ada, Barlow, Helios, Howard, RB07, and Superb. Logically, spike counts would seem to indicate final yield results. However, within each site, we found no correlations between spike number and yield among varieties.
Plant height ranged from 18 to 44 inches (Table 4). Batiscan, Kingsey, and Red Fife were the tallest varieties across sites, and Carbernet was consistently one of the shortest. Taller varieties are more susceptible to lodging, which was an issue with Batiscan at the Sidney site. It is thought that taller varieties may be more competitive with weeds, which could be helpful with spring wheat as annual weeds can be quite problematic. Weed pressure was low and nonuniform at the Maine locations, making it difficult to properly evaluate the relationship between plant height and weed competitiveness. In Maine, where weed biomass was collected (Table 5), there was no correlation between plant height and weed biomass. For example, Faller had average plant heights in Maine but also had the lowest weed biomass. Average weed biomass at the Old Town and Sidney sites, 180 and 212 lbs/acre respectively, were low enough that weeds probably did not impact yield. In Alburgh and Willsboro, weed severity was ranked by visual observation (Table 5). Alburgh’s weed pressure was quite high and most likely did negatively impact yield. Willsboro had low to moderate weed pressure.
Total above-ground wheat plant biomass was measured at the grain soft dough stage when plants are considered to have accumulated their greatest biomass (i.e. “peak biomass” stage). Cereals are sometimes harvested at this stage for animal forage. As well, peak biomass measurements may indicate varieties that could be good straw producers. Batiscan and Faller produced among the highest peak biomass at all of the locations (Table 5). Other high biomass producing varieties include Helios, Kingsey, Red Fife, and Superb. Overall, the Old Town and Sidney sites had substantially higher plant biomass values than the Alburgh and Willsboro sites, again reflecting difficult growing conditions in northern Vermont and New York.
Table 4. Estimated wheat flowering date, number of spikes, and plant height, ME, NY, and VT.
| Variety | Estimated Flowering Date | No. of Spikes (no./ft2) | Plant Height (inches) | ||||||||
|---|---|---|---|---|---|---|---|---|---|---|---|
| Old Town | Sidney | Alburgh | Willsboro | Old Town | Sidney | Alburgh | Willsboro | Old Town | Sidney | Alburgh | |
| ME | ME | VT | NY | ME | ME | VT | NY | ME | ME | VT | |
| AC Barrie | 7-Jul | >27-Jun | 5-Jul | <15-Jul | 53† | 42 | 31 | 40 | 36 | 35 | 33 |
| AC Walton | 8-Jul | >27-Jun | 1-Jul | <15-Jul | 41 | 32 | 22 | 26 | 38 | 37 | 36 |
| Ada | 7-Jul | >27-Jun | 5-Jul | <15-Jul | 52 | 53 | 29 | 45 | 29 | 30 | 28 |
| Barlow | 7-Jul | >27-Jun | 5-Jul | <8-Jul | 54 | 54 | 28 | 57 | 31 | 35 | 29 |
| Batiscan | 7-Jul | >27-Jun | 1-Jul | <8-Jul | 46 | 47 | 30 | 48 | 38 | 39 | 38 |
| Brick | 3-Jul | 27-Jun | 5-Jul | <8-Jul | 52 | 50 | 40 | 49 | 32 | 33 | 33 |
| Cabernet | 7-Jul | >27-Jun | 5-Jul | <15-Jul | 45 | 50 | 29 | 39 | 23 | 24 | 23 |
| Duo | 8-Jul | — | — | — | 48 | — | — | — | 34 | — | — |
| Faller | 7-Jul | >27-Jun | 5-Jul | <8-Jul | 54 | 50 | 33 | 39 | 32 | 33 | 28 |
| FBC Dylan | 7-Jul | >27-Jun | 5-Jul | <8-Jul | 42 | 42 | 27 | 35 | 33 | 32 | 29 |
| Glenn | 6-Jul | >27-Jun | 5-Jul | <8-Jul | 54 | 51 | 44 | 51 | 35 | 36 | 31 |
| Helios | — | — | 5-Jul | <8-Jul | — | — | 49 | 47 | — | — | 34 |
| Howard | 7-Jul | >27-Jun | 5-Jul | <8-Jul | 58 | 56 | 26 | 43 | 31 | 32 | 27 |
| Jenna | 7-Jul | >27-Jun | 5-Jul | <15-Jul | 53 | 43 | 31 | 47 | 27 | 27 | 25 |
| Kaffe‡ | — | — | 5-Jul | <15-Jul | — | — | 27 | 39 | — | — | 36 |
| Kelse | 7-Jul | >27-Jun | 5-Jul | <15-Jul | 48 | 48 | 25 | 34 | 29 | 29 | 29 |
| Kingsey | 8-Jul | >27-Jun | 5-Jul | <15-Jul | 47 | 43 | 31 | 46 | 37 | 40 | 38 |
| Magog | 7-Jul | >27-Jun | 5-Jul | <15-Jul | 51 | 44 | 35 | 48 | 34 | 38 | 35 |
| Malbec | 7-Jul | >27-Jun | 5-Jul | <15-Jul | 49 | 47 | 37 | 45 | 25 | 25 | 26 |
| McKenzie | 7-Jul | >27-Jun | 5-Jul | <15-Jul | 51 | 48 | 34 | 40 | 37 | 37 | 35 |
| Nick‡ | — | — | 1-Jul | <8-Jul | — | — | 24 | 48 | — | — | 26 |
| 07SW04 | 7-Jul | >27-Jun | 1-Jul | <15-Jul | 50 | 45 | 31 | 48 | 34 | 32 | 32 |
| Oklee | 6-Jul | >27-Jun | 5-Jul | <8-Jul | 47 | 45 | 32 | 38 | 32 | 30 | 28 |
| RB07 | 7-Jul | >27-Jun | 5-Jul | <8-Jul | 55 | 55 | 34 | 47 | 28 | 30 | 27 |
| Red Fife | 9-Jul | >27-Jun | 1-Jul | <15-Jul | 43 | 39 | 25 | 32 | 44 | 42 | 41 |
| Roblin | 3-Jul | >27-Jun | 5-Jul | <8-Jul | 42 | 48 | 26 | 37 | 36 | 36 | 32 |
| Sabin | 7-Jul | >27-Jun | 5-Jul | <8-Jul | 43 | 46 | 30 | 27 | 30 | 30 | 27 |
| Steele-ND | 7-Jul | >27-Jun | 1-Jul | <8-Jul | 52 | 49 | 35 | 35 | 29 | 33 | 28 |
| Superb | 6-Jul | >27-Jun | 5-Jul | <15-Jul | 55 | 51 | 35 | 53 | 31 | 34 | 29 |
| Tom | 7-Jul | >27-Jun | 5-Jul | <8-Jul | 48 | 53 | 34 | 50 | 29 | 32 | 31 |
| Ulen | 4-Jul | >27-Jun | 5-Jul | <8-Jul | 49 | 51 | 17 | 45 | 31 | 31 | 29 |
| Site Average | — | — | — | — | 49 | 47 | 31 | 42 | 32 | 33 | 31 |
| LSD (0.05) | — | — | — | — | 9 | 8 | 12 | 13 | 4 | — | 3 |
| † For all measures, bolded values are not significantly different from the highest value, which is indicated with underline. ‡ Variety is not a hard red type. |
|||||||||||
Table 5. Weed and wheat plant biomass, ME, NY, and VT.
| Variety | Weed Biomass (lbs/acre) | Weed Biomass(ranked 1-5)† | Wheat Plant Biomass (lbs/acre) | |||||
|---|---|---|---|---|---|---|---|---|
| Old Town | Sidney | Alburgh | Willsboro | Old Town | Sidney | Alburgh | Willsboro | |
| ME | ME | VT | NY | ME | ME | VT | NY | |
| AC Barrie | 137‡ | 257 | 4.75 | 1.50 | 8635 | 5772 | 3107 | 4734 |
| AC Walton | 142 | 267 | 4.50 | 2.38 | 9083 | 7117 | 3518 | 3281 |
| Ada | 205 | 174 | 4.63 | 1.00 | 7727 | 6858 | 2684 | 4747 |
| Barlow | 179 | 278 | 4.88 | 1.25 | 8331 | 7666 | 2582 | 4929 |
| Batiscan | 233 | 119 | 4.25 | 0.88 | 8486 | 9525 | 5174 | 6271 |
| Brick | 320 | 152 | 4.13 | 1.75 | 6550 | 6358 | 4944 | 4816 |
| Cabernet | 212 | 278 | 5.00 | 2.25 | 6055 | 7524 | 2132 | 3051 |
| Duo | 195 | — | — | — | 7238 | — | — | — |
| Faller | 99 | 95 | 4.50 | 2.00 | 8368 | 8909 | 4708 | 4140 |
| FBC Dylan | 110 | 161 | 4.00 | 1.75 | 7354 | 7635 | 3082 | 6328 |
| Glenn | 207 | 155 | 4.25 | 1.25 | 8608 | 7189 | 3877 | 4920 |
| Helios | — | — | 3.63 | 1.50 | — | — | 5026 | 5310 |
| Howard | 194 | 198 | 4.50 | 2.13 | 8104 | 7063 | 2960 | 3733 |
| Jenna | 216 | 176 | 4.25 | 1.63 | 7843 | 7463 | 3600 | 5042 |
| Kaffe‡ | — | — | 4.00 | 1.63 | — | — | 3758 | 4672 |
| Kelse | 96 | 154 | 4.75 | 2.50 | 8179 | 7429 | 3525 | 3129 |
| Kingsey | 182 | 208 | 4.00 | 1.88 | 8070 | 9095 | 4619 | 3990 |
| Magog | 202 | 182 | 4.00 | 1.88 | 6910 | 7398 | 4096 | 5106 |
| Malbec | 196 | 184 | 4.38 | 0.75 | 7144 | 6399 | 4118 | 4769 |
| McKenzie | 199 | 297 | 3.63 | 2.00 | 7745 | 6982 | 3348 | 4043 |
| Nick‡ | — | — | 5.00 | 1.88 | — | — | 3111 | 4610 |
| 07SW04 | 104 | 214 | 3.75 | 0.88 | 8093 | 5833 | 2894 | 5870 |
| Oklee | 126 | 231 | 5.00 | 2.13 | 7641 | 6217 | 2816 | 3645 |
| RB07 | 263 | 304 | 4.75 | 1.25 | 7329 | 6692 | 3031 | 4566 |
| Red Fife | 232 | 331 | 4.75 | 2.13 | 8363 | 8092 | 3669 | 3507 |
| Roblin | 161 | 135 | 4.88 | 1.75 | 7498 | 8165 | 2790 | 2675 |
| Sabin | 215 | 271 | 4.75 | 2.75 | 7318 | 6237 | 3428 | 2480 |
| Steele-ND | 176 | 235 | 4.75 | 3.25 | 7398 | 7803 | 3873 | 2562 |
| Superb | 111 | 193 | 4.25 | 1.75 | 8372 | 7164 | 4973 | 4446 |
| Tom | 168 | 147 | 4.63 | 1.50 | 7152 | 8498 | 3306 | 5128 |
| Ulen | 156 | 199 | 4.63 | 1.13 | 7536 | 6815 | 2226 | 5407 |
| Site Average | 180 | 212 | 4.44 | 1.74 | 7769 | 7320 | 3627 | 4397 |
| LSD (0.05) | — | NS¶ | 0.8 | NS¶ | 1516 | 1575 | 1638 | 2260 |
| † Severity based on 1-5 ranking, with 5 as most weeds. ‡ For all measures, bolded values are not significantly different from the highest value, which is indicated with underline. For weed biomass, the lowest values are indicated. ¶ No significant difference among varieties. § Variety is not a hard red type. |
||||||||
Yield
Yields for 2011 are presented in Table 6, as well as in Figure 1 in graphical form to easily compare varieties. Two-year averages (2010 and 2011) also are presented in Table 6 for both Maine locations to provide information about how the varieties perform over different seasons. Two-year averages were not presented for the Alburgh and Willsboro locations as weather in 2011 proved to be unusually challenging and led to poor performance at both locations.
A typical yield for organic hard red spring wheat grown in Maine is estimated to be about 2,000 to 2,500 lbs/acre (personal communication, Matt Williams, 2011). Yields in these trials were above that estimate for the locations in Maine but much lower for Vermont and New York (Table 6; Figs. 1). Varieties with consistently high yields at all sites were Faller, Jenna, RB07, and Tom. Varieties that were amongst the lowest yielding were AC Barrie, Red Fife, and Roblin. In Maine, Faller and Tom had high 2-year average yields at both sites. Other varieties that also yielded well over two years in Maine were FBC Dylan, RB07, Sabin, and Superb.
Grain test weights in 2011 were on the lower end of the acceptable range at all sites, varying from 55 to 59 lbs/bu (Table 6). In Maine, Glenn had the highest test weight at both locations (59 lbs/bu). There were no statistical differences among varieties for test weights at the Vermont and New York sites.
Table 6. Yield and test weight of spring wheat, ME, NY, and VT.
| Variety |
Yield at 13.5% Moisture (lbs/acre)†
|
Test Weight (lbs/bu) | |||||||||
|---|---|---|---|---|---|---|---|---|---|---|---|
| 2011 | 2 year averages (2010-2011) | 2010 | 2011 | ||||||||
| Old Town | Sidney | Alburgh | Willsboro | Old Town | Sidney | Alburgh | Old Town | Sidney | Alburgh | Willsboro | |
| ME | ME | VT | NY | ME | ME | VT | ME | ME | VT | NY | |
| AC Barrie | 2578 | 2606 | 711 | 736 | 2111 | 2296 | 845 | 56 | 58 | 55 | 57 |
| AC Walton | 2736 | 3001 | 847 | 534 | 2718 | — | 1222 | 53 | 56 | 55 | 56 |
| Ada | 2917 | 3030 | 992 | 1579 | 2449 | 2706 | 1011 | 58 | 58 | 56 | 57 |
| Barlow | 2922 | 3170‡ | 978 | 1604 | — | — | — | 58 | 59 | 56 | 57 |
| Batiscan | 2486 | 2901 | 1382 | 1864 | 2246 | 2639 | 1661 | 56 | 57 | 56 | 57 |
| Brick | 2748 | 2763 | 1102 | 1744 | — | — | — | 58 | 59 | 55 | 57 |
| Cabernet | 2393 | 3212 | 351 | 597 | 2591 | 2827 | 517 | 52 | 55 | 55 | 55 |
| Duo | 2267 | — | — | — | — | — | — | 57 | — | — | — |
| Faller | 3221‡ | 3653 | 965 | 1634 | 3398 | 3457 | 1580 | 57 | 57 | 55 | 56 |
| FBC Dylan | 2900 | 2945 | 796 | 1101 | 2958 | 2756 | 1286 | 56 | 58 | 56 | 57 |
| Glenn | 2644 | 2695 | 730 | 1863 | 2489 | 2448 | 1063 | 59 | 59 | 56 | 58 |
| Helios | — | — | 1353 | 1165 | — | — | 1148 | — | — | 56 | 58 |
| Howard | 2759 | 2966 | 708 | 1092 | 2785 | 2765 | 911 | 55 | 58 | 55 | 58 |
| Jenna | 3338 | 3355 | 1168 | 1437 | — | — | — | 55 | 56 | 56 | 57 |
| Kaffe§ | — | — | 1307 | 1153 | — | — | 2009 | — | — | 56 | 57 |
| Kelse | 2335 | 2911 | 834 | 1006 | 2236 | 2811 | 1530 | 53 | 58 | 56 | 58 |
| Kingsey | 2437 | 3312 | 1297 | 1243 | 2637 | 3079 | 1794 | 58 | 57 | 56 | 58 |
| Magog | 2695 | 3257 | 1013 | 500 | 2590 | 3011 | 1281 | 56 | 57 | 56 | 55 |
| Malbec | 2800 | 3203 | 979 | 1223 | 2877 | 2842 | 1149 | 52 | 56 | 56 | 55 |
| McKenzie | 2218 | 2508 | 847 | 1593 | — | — | 1146 | 57 | 57 | 55 | 57 |
| Nick§ | — | — | 830 | 876 | — | — | 981 | — | — | 56 | 56 |
| 07SW04 | 2560 | 2502 | 799 | 933 | — | — | — | 58 | 55 | 57 | |
| Oklee | 3134 | 2771 | 813 | 1190 | 3243 | 2857 | 1130 | 58 | 59 | 56 | 57 |
| RB07 | 3047 | 3281 | 695 | 1526 | 2906 | 2999 | 1113 | 56 | 57 | 55 | 58 |
| Red Fife | 2278 | 2529 | 788 | 477 | 2172 | 2261 | 1083 | 55 | 56 | 56 | 55 |
| Roblin | 2289 | 2793 | 758 | 686 | 2406 | 2432 | 1097 | 54 | 56 | 55 | 57 |
| Sabin | 2692 | 3058 | 940 | 863 | 2839 | 2989 | 1247 | 57 | 58 | 56 | 57 |
| Steele-ND | 2759 | 3110 | 749 | 882 | 2794 | 2876 | 1222 | 56 | 58 | 56 | 57 |
| Superb | 2650 | 2996 | 1226 | 1536 | 2909 | 2902 | 1297 | 55 | 57 | 55 | 57 |
| Tom | 3087 | 3179 | 1267 | 1627 | 3430 | 3115 | 1298 | 58 | 58 | 56 | 58 |
| Ulen | 2816 | 2755 | 900 | 1532 | 2893 | 3717 | 1277 | 56 | 57 | 55 | 57 |
| Site Average | 2697 | 2980 | 937 | 1193 | 2712 | 2800 | 1228 | 56 | 57 | 55 | 57 |
| LSD (0.05) | 417 | 561 | 359 | 525 | 411 | 550 | 473 | 0.7 | 0.8 | — | — |
| † All varieties at each site were harvested on the same day. ‡ For all measures, bolded values are not significantly different from the highest value, which is indicated with an underline. § Variety is not a hard red type. |
|||||||||||
Figure 1. Yield of spring wheat varieties, 2011.
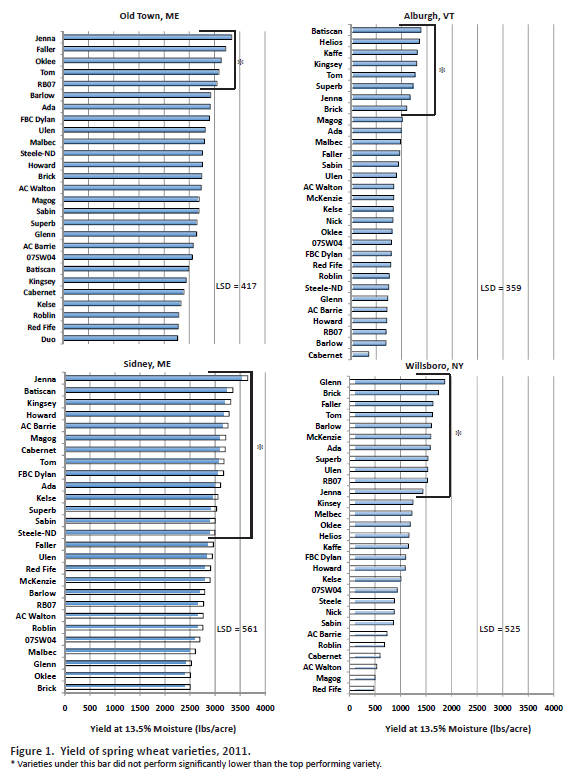
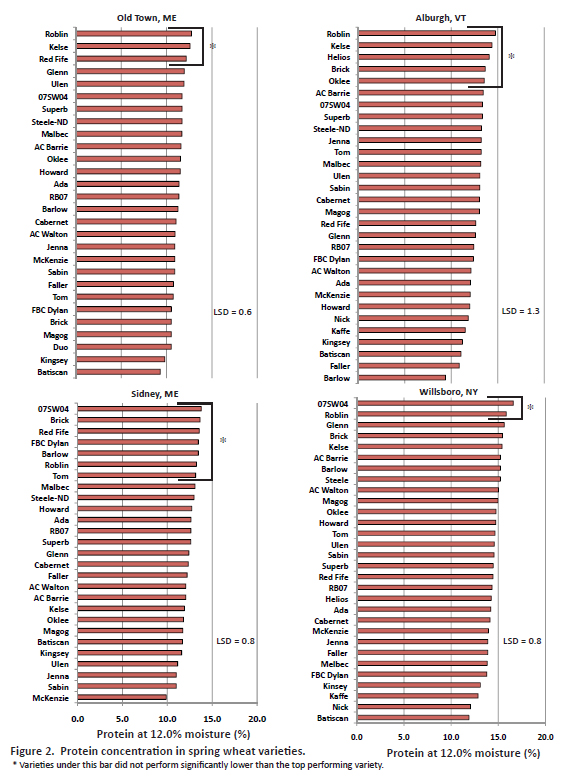
Table 7. Protein concentration and falling number of spring wheat, ME, NY, and VT.
| Variety | Crude Protein at 12% Moisture (%) | Falling Number at 14% Moisture (seconds) | ||||||||||
|---|---|---|---|---|---|---|---|---|---|---|---|---|
| 2011 | 2 year averages (2010-2011) | 2010 | ||||||||||
| Old Town | Sidney | Alburgh | Willsboro | Old Town | Sidney | Alburgh | Old Town | Sidney | Alburgh | Willsboro | ||
| ME | ME | VT | NY | ME | ME | VT | ME | ME | VT | NY | ||
| AC Barrie | 11.5 | 13.1† | 13.3 | 15.3 | 13.9 | 13.8 | 16.4 | 358 | 417 | 379 | 441 | |
| AC Walton | 10.9 | 11.0 | 12.3 | 15.5 | 12.9 | — | 15.3 | 368 | 364 | 312 | 386 | |
| Ada | 11.4 | 12.6 | 12.3 | 14.2 | 13.4 | 13.0 | 14.3 | 366 | 419 | 409 | 473 | |
| Barlow | 11.2 | 13.5 | 13.0 | 15.3 | — | — | — | 261 | 372 | 305 | 390 | |
| Batiscan | 9.3 | 9.9 | 11.3 | 11.9 | 12.0 | 10.6 | 12.5 | 254 | 293 | 228 | 315 | |
| Brick | 10.5 | 12.1 | 13.8 | 15.5 | — | — | — | 326 | 385 | 282 | 353 | |
| Cabernet | 11.1 | 11.7 | 13.0 | 14.1 | 13.4 | 12.5 | 14.6 | 292 | 337 | 287 | 373 | |
| Duo | 10.5 | — | — | — | — | — | — | 252 | — | — | — | |
| Faller | 10.8 | 11.0 | 11.0 | 13.9 | 13.6 | 11.6 | 14.1 | 358 | 371 | 332 | 393 | |
| FBC Dylan | 10.6 | 11.2 | 12.3 | 13.8 | 13.4 | 11.4 | 13.5 | 306 | 343 | 345 | 460 | |
| Glenn | 12.0 | 13.8 | 12.5 | 15.6 | 13.8 | 14.6 | 15.6 | 329 | 401 | 323 | 386 | |
| Helios | — | — | 13.8 | 14.3 | — | — | 15.6 | — | — | 384 | 473 | |
| Howard | 11.5 | 12.2 | 11.8 | 14.7 | 13.6 | 12.7 | 13.4 | 288 | 365 | 344 | 378 | |
| Jenna | 10.9 | 11.7 | 13.0 | 13.9 | — | — | — | 290 | 360 | 232 | 401 | |
| Kaffe‡ | — | — | 11.3 | 12.9 | — | — | 13.4 | — | — | 235 | 233 | |
| Kelse | 12.6 | 13.6 | 14.3 | 15.4 | 13.9 | 13.9 | 15.8 | 282 | 363 | 319 | 394 | |
| Kingsey | 9.8 | 11.6 | 11.3 | 13.1 | 12.5 | 12.1 | 13.8 | 404 | 344 | 379 | 405 | |
| Magog | 10.5 | 12.1 | 13.0 | 15.0 | 13.7 | 12.3 | 15.5 | 388 | 471 | 362 | 432 | |
| Malbec | 11.7 | 12.3 | 13.0 | 13.8 | 13.5 | 12.7 | 16.4 | 264 | 309 | 296 | 410 | |
| McKenzie | 10.9 | 11.8 | 11.8 | 14.7 | — | — | 15.0 | 360 | 401 | 375 | 412 | |
| Nick‡ | — | — | 11.8 | 12.1 | — | — | 12.7 | — | — | 66 | 132 | |
| 07SW04 | 11.7 | 13.6 | 13.3 | 16.6 | — | — | — | 391 | 444 | 413 | 431 | |
| Oklee | 11.6 | 12.6 | 13.5 | 14.8 | 13.6 | 13.1 | 15.2 | 319 | 374 | 310 | 387 | |
| RB07 | 11.4 | 12.7 | 12.5 | 14.3 | 13.1 | 13.5 | 14.9 | 330 | 300 | 298 | 398 | |
| Red Fife | 12.2 | 12.4 | 12.8 | 14.4 | 13.9 | 13.3 | 15.8 | 317 | 333 | 300 | 359 | |
| Roblin | 12.8 | 13.5 | 15.0 | 15.8 | 14.3 | 14.1 | 15.6 | 210 | 268 | 265 | 381 | |
| Sabin | 10.9 | 11.9 | 13.0 | 14.5 | 13.4 | 12.0 | 16.5 | 389 | 478 | 332 | 437 | |
| Steele-ND | 11.7 | 12.6 | 13.3 | 15.2 | 13.8 | 13.2 | 14.9 | 293 | 399 | 310 | 378 | |
| Superb | 11.7 | 13.0 | 13.5 | 14.5 | 14.0 | 13.2 | 14.7 | 358 | 400 | 343 | 415 | |
| Tom | 10.7 | 13.1 | 13.3 | 14.7 | 13.0 | 13.2 | 13.3 | 374 | 480 | 380 | 445 | |
| Ulen | 11.9 | 13.2 | 13.0 | 14.6 | 13.8 | 13.8 | 15.0 | 264 | 335 | 372 | 372 | |
| Site Average | 11.2 | 12.4 | 12.7 | 14.5 | 13.5 | 12.9 | 14.7 | 321§ | 373§ | 314 | 388 | |
| LSD (0.05) | 0.6 | 0.8 | 1.3 | 0.8 | 0.9 | 1.1 | 1.4 | — | — | — | 30 | |
| † For all measures, bolded values are not significantly different from the highest value, which is indicated with an underline. ‡ Variety is not a hard red type. § Average value taken from one sample per variety instead of four |
||||||||||||
Figure 2. Protein concentration in spring wheat varieties.
Wheat Quality

Commercial mills use a variety of measurements to determine if a particular lot of wheat is suitable for bread flour, including grain protein, falling number, test weight, and mycotoxin (DON) concentration. For grain protein, Willsboro had the highest site average at 14.5%. (Table 7 and Figure 2) Alburgh and Sidney were near 12% and Old Town was the lowest at 11.2%. Wet weather early in the season may have reduced nitrogen availability and overall protein levels at the Old Town site in 2011 as compared with 2010. Kelse and Roblin are two varieties that performed well at all four locations, with Roblin having the highest protein level at Old Town and Alburgh. Varieties that had good protein levels over two years at the Maine sites are AC Barrie, Glenn, Kelse, Roblin, and Ulen.
Despite wet conditions at harvest, falling number values were well above the acceptable level (250 seconds) for almost all of the varieties grown at each location. In Alburgh and Willsboro, Kaffe and Nick were two exceptions, but are soft white varieties.
Fusarium head blight, which produces the mycotoxin deoxynivalenol (DON), is a disease of major concern for wheat growers in northern New England. It primarily infects the plant during flowering and is favored by cool, humid weather. The United States Food and Drug Administration has established a maximum DON guideline of 1 ppm for finished human products. Millers may accept grain with slightly higher DON levels because, through cleaning, they can remove some of the infected grain and reduce DON levels. In 2011, the Alburgh and Willsboro sites had very low DON levels, with nearly all of the varieties testing below 0.5 ppm. In Sidney, despite wet weather during flowering, most varieties also had fairly low DON levels, below 1 ppm. Exceptions were Batiscan, Cabernet, Kelse, Malbec, Red Fife, and Superb. In Old Town, DON levels were quite high with all varieties testing above 1 ppm. Varieties that have consistently tested high for DON when DON has been a problem include Cabernet, Kelse, Malbec, and Superb. Varieties that consistently have shown lower than average DON levels in these trials include Faller, Glenn, Red Fife, Sabin, and Tom.
DISCUSSION
Wheat grain sold for bread flour can receive up to twice the pay price as grain sold for livestock feed, but the grain must meet higher quality standards. Therefore, when choosing which varieties to plant, it is important to consider their potential to produce grain with acceptable protein, test weight, falling number, and DON levels, as well as to produce high yields.
The 2011 growing season proved to be a challenging year for spring cereals for much of the Northeast, not only for organic growers, but conventional as well. In Maine, the 2011 average conventional barley crop yield was 40% lower than average yields in the previous two years (USDA-NASS Small Grains 2011 Summary, September 2011). Wet weather delayed planting, led to poor plant stands and poor growth, and exacerbated disease issues, especially on heavier soils. The Willsboro and Alburgh sites were particularly impacted by wet weather early on. Weed pressure and low nitrogen availability also could have been a contributing factor to poor yields at these sites. In Maine, yields of all varieties at both sites were at or above an estimated historical average of 2,000 to 2,500 lb/acre. However, DON levels at the Old Town site were above the acceptable level for all varieties, ranging from 1.1 to above 5 ppm, and protein levels were on average lower than the desired 12% level. The Sidney site had more favorable protein and DON levels. Weeds were not a major problem at either of the Maine sites.
In Alburgh and Willsboro, no variety yielded above 2,000 lbs/acre. Under this year’s difficult conditions, Batiscan, Jenna, Superb, and Tom were top yielders at both of those sites. Varieties that yielded well across all Maine and Vermont sites were Jenna and Tom. Faller and RBO7 also yielded well at three out of the four locations. Most commercial mills want a minimum of 12% grain protein for bread wheat, although some buyers have accepted a minimum of 10.5 to 11% when supplies of locally grown wheat were limited. With adequate nitrogen, high yielding spring wheat varieties can still meet protein levels. For example, Tom is one of the higher yielding varieties and had protein levels above 12% at three of the four locations. However, if nitrogen could be a limiting factor to your production system, you may want to choose varieties that are known to have higher protein levels, even if they are not among the highest yielding varieties. For example, in Old Town, where nitrogen may have been lacking as evidenced by below average protein levels, Kelse, Red Fife, and Roblin stood out as achieving acceptable protein levels, but their yields were average or below average.
Fusarium head blight is a major limiting factor in achieving wheat quality for human grade markets. Options for managing the disease are limited and include rotating with non-grain crops (i.e. avoid planting wheat after wheat, corn, barley and rye), burying any disease-carrying debris, and variety choice. While no current wheat varieties are resistant to Fusarium head blight, some have better tolerance to the disease than others. In other trials where disease and moisture levels were controlled, Glenn has shown to have the best tolerance to Fusarium. In both years of our trials, DON levels for Glenn always have been among the lowest for any site and year. Varieties to avoid would be those that consistently show among the highest DON levels at sites and years where DON is a problem. For our trials this includes Batiscan, Cabernet, Kelse, Melbec, and Superb. Choosing a tolerant variety may provide some protection against Fusarium, but conditions at flowering drive infection and may still result in high DON levels. Therefore, another management strategy is to plant two or three tolerant varieties with different maturity dates and hence flowering dates.
It also may be helpful to compare these results from Maine and Vermont to variety trails from other regions. Ultimately, though, it is important to evaluate data from test sites that are similar to your farm and region when deciding which varieties to grow. Full reports of the 2010 results are available as a separate publication.
WHAT IS A SIGNIFICANT DIFFERENCE?
Variations in yield and quality can occur not only due to genetics but also due to variability in soil, weather, and other growing conditions. Statistical analysis makes it possible to determine whether a difference between two varieties is real or whether it might have occurred due to other variability in the field. The Least Significant Difference (LSD) is the minimum difference needed between two averages to consider them statistically different. LSDs at the 5% level of probability are presented at the bottom of each table for each measure. Where the difference between two varieties within a column is equal to or greater than the LSD value, you can be sure in 19 out of 20 chances that there is a real difference between the two varieties.
In the example below, variety A is significantly different from variety C because the difference between their yields (1454) is greater than the LSD value (889). Variety A is not significantly different from variety B because the difference between their yields (725) is less than the LSD value (889).
Throughout this bulletin, the greatest value at each site for each measure is indicated with an underline and bold type. Varieties that are not significantly different from the greatest value are also in bold type. Using the example below, variety C had the highest measured yield (underlined and bolded) but it was not significantly different than the yield of variety B (bolded).
Acknowledgements: The UVM Extension Crops and Soils Team would like to thank the Borderview Research Farm and the Willsboro Research Farm for their generous help with the trials. We would also like to thank Savanna Kittell-Mitchell, Amber Domina, Chantel Cline, and Katie Blair for their assistance with data collection and entry. The University of Maine Sustainable Agriculture team thanks Jeff Bragg of Rainbow Valley Farm for providing his assistance and field in Sidney, the University of Maine Rogers Research Farm, and Joe Cannon, Hannah Griffin, Chris Illingsworth, Michael Correll, Jess Richards, and Aaron Englander for their technical help. Information in this publication is provided purely for educational purposes. No responsibility is assumed for any problems associated with the use of products or services mentioned. No endorsement of products or companies is intended, nor is criticism of unnamed products or companies implied.
This research is supported by the U.S. Department of Agriculture, National Institute of Food and Agriculture, Organic Research and Extension Initiative under Award No. 2009-01366, “Enhancing farmers’ capacity to produce high quality organic bread wheat.”
Published and distributed in furtherance of Acts of Congress of May 8 and June 30, 1914, by the University of Maine Cooperative Extension, the Land Grant University of the state of Maine and the U.S. Department of Agriculture cooperating. Cooperative Extension and other agencies of the U.S.D.A. provide equal opportunities in programs and employment. Call 800.287.0271 (in Maine), or 207.581.3188, for information on publications and program offerings from University of Maine Cooperative Extension.