AgEye Weather Report KEY

UCT = Universal Coordinate Time (i.e. aka Greenwich Mean Time) of the Global Forecast System update cycle and other databases used as data sources.
UCT = Eastern Daylight Savings Time + 4 hours from mid-March to early-November, or Eastern Standard Time + 5 hours from early-November to mid-March.
F = degrees Fahrenheit; mph = miles per hour; W/m2, = Watts per square meter, KW/m2 = Kilowatts per square meter
* Air Temperature
– Temperature as measured by a thermometer at the standard measurement height over short grass, shielded from the sun, and open to air movement. Standard measurement height is called “2-meter”, but is actually within a range of 1.5 to 2 meters (4.9 to 6.6 feet). The values at 3-hour intervals in the 48-hour forecast table are the temperature expected at the start of the specified hour.
* MAX and Min Air Temperatures
– The forecast maximum daytime temperature is the highest temperature (in degrees F) reached even for a short time, during the Daytime hours defined as 7am to 7pm Local Standard Time, = 8am to 8pm during Daylight Savings Time.
– The forecast daily minimum temperature in the daily forecast is defined as the lowest temperature expected — even for a short time — during 7pm to 8am Local Standard Time, = 8pm to 9am Daylight Savings Time, into the next calendar day.
– The one-hour overlap between the Daytime and Nighttime forecast hours helps cover situations when minimum temperature is forecast to occur just after sunrise.
– The maximum and minimum temperatures for both forecast and observation are the values that would be recorded on a max-min thermometer.
– The observed Min air temperature usually occurs during the overnight hours into the morning of the next calendar day.
– The OBSERVED daily Min and Max temperatures, are summarized for the 24 hours of 1am to 12am/midnight for each calendar day.
* Apparent Temperature
– The apparent temperature is the air temperature combined with other factors to estimate how the temperature feels to a human body.
– For air temperature between 51 and 80 F, the apparent Temperature is the same as the air temperature.
– For air temperature over 80F, the apparent temperature measures the heat index by accounting for the effect of relative humidity. The heat index estimates what the temperature feels like to the human body when standing in the shade. Exposure to direct sunlight can increase the heat index by up to 15 degrees F.
– For air temperature below 50F, the apparent temperature measures the wind chill.
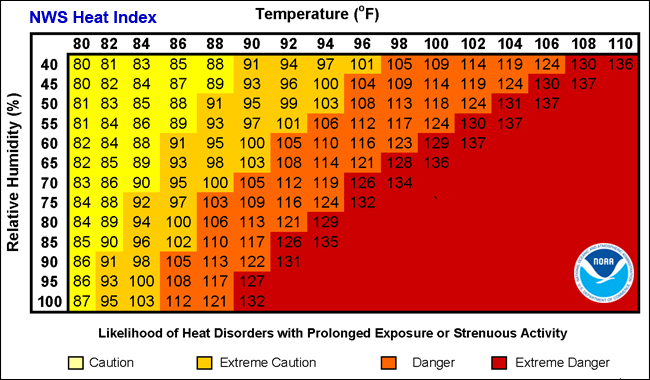
| Classification | Heat Index | Effect on the body |
| Caution | 80°F – 90°F | Fatigue possible with prolonged exposure and/or physical activity |
| Extreme Caution | 90°F – 103°F | Heat stroke, heat cramps, or heat exhaustion possible with prolonged exposure and/or physical activity |
| Danger | 103°F – 124°F | Heat cramps or heat exhaustion likely, and heat stroke possible with prolonged exposure and/or physical activity |
| Extreme Danger | 125°F or higher | Heat stroke highly likely |
Credit: NOAA, What is the heat index? https://www.weather.gov/ama/heatindex
Credit: NOAA, Wind chill. https://www.weather.gov/ama/WindChill
* Minimum Dewpoint and Minimum Wet-Bulb temperatures are the lowest hourly values within a 3-hour, 24-hour, or 7-day period.
– Dewpoint is the temperature to which air must be cooled for saturation to occur at 2-meter height.
– The wet-bulb temperature (WBT) is the temperature read by a thermometer covered in water-soaked cloth over which air is passed. At 100% relative humidity, the wet-bulb temperature is equal to the air temperature (aka the “dry-bulb” temperature). At less than 100% relative humidity, the wet-bulb temperature is lower than the air temperature. Wet Bulb temperature is useful for frost and freeze prediction as a measure of how cold the air could get before more lowering is resisted by condensation of moisture out of the air.
* Min 4-inch temperature
– The estimated minimum temperature in the middle of a short crop canopy at 4 inches above ground level. The 4-inch temperature is based on measurements taken in the middle of lowbush blueberry plant canopies. It is presumably applicable for cranberry canopy temperature. It may also be applicable as a relative indicator for temperatures experienced by low growing vegetables and strawberries in soil without plastic mulch. It is not applicable for crops grown in black plastic mulch or underneath a row cover.
– In the 48-hour forecast, the Min 4-inch temperature is the lowest value in each 3-hour period ending at the specified hour. In the 10-day forecast and 7-day observation tables, it is the lowest 4-inch temperature within each 24-hour period. The 4-inch temperature is calculated for use in models to estimate fungal disease low-canopy crops. It may also serve as an alternate measure of frost risk to those crops. However, growers are cautioned to put more emphasis on frost/freeze risk estimates developed from standard height measurements and then validated in field trials for application to low-canopy crops. An example is the Poling (2008) frost/freeze model provided in Ag-Radar.
– The Min 4-inch temperature is estimated from a combination of 2M air temperature, relative humidity, wind speed, and solar radiation.
* Soil Temperature
“2-inch”= Average temperature from the surface down to 4-inch soil depth.
“10-inch” = Average temperature from 4-inch depth down to 16-inches.
* Relative Humidity (RH)
– The amount of water vapor in the air relative to the amount that the air can carry before becoming saturated at the current temperature and pressure. RH is expressed as a percentage. At RH of 100% the air is saturated and at its dewpoint, which is the temperature at which moisture condenses out of the air.
* PRECIPITATION
– Amount of liquid water equivalent received as rain, snow, or ice.
* PRECIP PROB = Probability of receiving at least 0.01 inch of precipitation during a 3, 12, or 24-hour period (3-hr Precip Prob, 12-hr Precip Prob, 24-hr Precip Prob).
* Precip Hrs/Day = Number of hours per day with observed or expected new measurable precipitation (over 0.01″). Values range from 0 hours (i.e. no precipitation during that 24-hour period), up to a maximum of 24 hours.
* Precip Hours E/M/L = Number of hours with precipitation arriving in the Early(1am-8am), Mid(9am-4pm), or Late(5pm-12am) hours of the day.
Thus the values range from 0 to a maximum of 8 hours, i.e. each of the hours in the 8-hour period showed measurable precipitation.
A single “0” means that the values for all three periods, (i.e. the Early, Middle & Late hours), were all = 0
* Precip Type = Type of precipitation that is predominant during the time period. If there is no precipitation, a null value “—” is shown.
The different types of precipitation are:
– R = Rain: Droplets larger than 0.5mm diameter. Moderate rain fall rate is 0.10 to 0.30 inches per hour. Rain is water in liquid form. Rain usually refers to precipitation from some type of flat stratus cloud formed by the two overlapping air masses with different temperature or moisture characteristics called a weather front. Frontal clouds may stretch for hundreds of miles. Frontal rain usually has a duration of several hours up to one or more days.
– RS = Rain showers. Rain showers consist of rain from convective puffy cumulus. These clouds are much narrower than a weather front, and the rain they produce comes from individual clouds. Thus, rain showers are more localized, affecting smaller and separate areas at any specific point in time. Showers from cumulus clouds tend to be sudden and brief, lasting from minutes to hours, whereas frontal rain can last for days.
– D = Drizzle. Drizzle is liquid precipitation in drops smaller than 0.5mm diameter. Because of the small droplet size, the accumulation rate from drizzle is much less than from rain. Accumulation from a moderate drizzle is only 0.01 to 0.02 inches per hour.
– T = Thunderstorm = A rain-bearing cloud that also produces lightning. Thunderstorms typically produce heavy rain for a brief period, anywhere from 30 minutes to an hour. They develop in warm, humid conditions. Lightning often strikes outside the area of heavy rain, as far as 10 miles away from any rainfall. That is about the distance you can hear thunder from the storm. Whether or not you can see the actual lightning flash, if you can hear thunder, you are at risk of being struck. The National Weather Service recommends “When Thunder Roars, Go Indoors . . .and stay there at least 30 minutes after the last clap of thunder.”
– T+ = Severe Thunderstorms. A thunderstorm that produces a tornado, winds of at least 58 mph, or hail at least 1″ in diameter (the size a Quarter coin). A severe thunderstorm creates risk of structural wind damage. A thunderstorm with wind speed >= 40 mph or hail of >= ½” diameter (> than pea-sized) is defined as approaching severe.
– S = Snow. Frozen water vapor that falls in flakes. The Snow category indicates longer duration of snowfall and higher accumulation than Snow Showers.
– SS = Snow showers. A short duration of moderate snowfall. Some accumulation is possible.
– WM = Wintry Mix of rain & snow. The weather phenomenon that almost nobody likes.
– Z = Sleet. Rain drops that freeze into pellets of ice before reaching the ground. Sleet usually bounces when hitting a surface and does not stick to objects. However, it can accumulate and cause dangerous driving conditions.
– ZR = Freezing rain. Rain that falls onto a surface where the temperature is below freezing. This causes the rain to freeze on contact with trees, power lines, cars and roads. This coating or glaze of ice causes serious travel problems, even with very small accumulations.
* WIND Speed
– Sustained wind speed in miles per hour at 6.5 feet (2 meters) above ground. The value is derived as a fixed ratio (0.748) of the standard 10-meter wind speed. Wind speed values do not account for local topography and wind breaks. In the 48-hour forecast, wind speed is the value expected at the start of the indicated hour. For the 10-day forecast and 7-day day observations, the wind speed is the average of 24 hourly values from midnight to midnight on each date.
* Max Gust = Maximum wind speed lasting for at least several seconds during a 3-hour (48-hour forecast) or 24-hour period (10-day forecast and 7-day observations). Wind gust duration is usually less than 20 seconds.
* Wind Direction = Compass direction from which wind is coming. Tables show the average direction for a 3-hour or 24-hour period.
* CLOUD Cover = Portion of the sky covered by clouds.
CLE = Clear 0-10%
FEW = Few 11-30%
SCT = Scattered 31-60%
CDY = Mostly Cloudy 61-90%
OVC = Overcast 91-100%
* SOLAR Radiation
– In the 48-Hour Forecast, the “3-hr Solar Rad” = Watts per square meter of shortwave radiation received at ground level in 3 hours.
– In the 10-Day Forecast and 7-Day Observation tables, Solar Rad = Kilowatts square meter in 24 hours.
* Solar Radiation Pct = Percent of the total potential clear-sky downward shortwave radiation (for that date and location) forecast or observed at ground level.
* EVAPOTRANS
– Amount of water in inches of rain equivalent removed by evapotranspiration (ET) by short-crop plants with an approximate height of 5 inches similar to full cover grasses; with full sun and wind exposure; and with well-watered soil such that ET is not limited by availability of soil moisture. ET is determined by temperature, wind, relative humidity. Both evaporation and transpiration are presumably zero for days on which maximum temperature is below freezing, but values are still shown to represent possible soil moisture losses. Those small ET values may not be agronomically or horticulturally meaningful.
* ET vs. Normal = The difference in the amount of daily evapotranspiration compared to the climatic average normal amount of ET for that date and location. Measured in 0.01 inch increments.
* Soil Moisture
– Volumetric water content, which is the total volume of water in the soil divided by the total volume of all soil components. The maximum value is often around 50%, but ranges from 40 to 60% depending on the porosity of the predominant soil type used for a location.
– The values shown are general estimates that do not account for soil type variation within a site. Thus, they serve as a relative, but not an absolute indicator. On-site soil moisture measurement is essential for managing crop water needs. With experience gained by comparing the weather report values to on-site measurements, it may be possible to use the forecast soil moisture values to estimate future soil moisture. But observed soil moisture values should only be considered a rough approximation and should be replaced by actual on-site measurements in making water use decisions.
– 2-inch = Average percent by volume of soil moisture from the surface down to 4-inch soil depth.
– 10-inch = Average percent by volume soil moisture from 4-inch depth down to 16-inches.
* LEAF WETNESS (LW)
– LW is a measure for free moisture on the surface of foliage. LW is categorized as either “Wet” or “Dry” by the CART/SLD/Wind model as defined in Kim et al. 2002. That model was validated by comparison to on-site measurements by painted leaf wetness sensors placed at 0.3 meter (12 inches) above turfgrass. The model was adjusted to match on-site measurements where an hour was defined as “Wet” if the sensor detected free moisture for more than 30 minutes, otherwise the hour was categorized as “Dry”. The CART/SLD/Wind model serves as a standardized measure to provide LW values that are independent of any particular plant canopy, and have been applied to disease models for apples, tomatoes, and other crops. As an estimate for the number of leaf wetness hours, it is considered more accurate than proxies for leaf wetness such as the number of hours above 90% relative humidity. As a measure based on standardized meteorological values, it avoids the substantial and frequent error inherent in using analog sensors subject to variation caused by placement, orientation, mechanical disruption, sensor surface contamination, calibration, and other sources of sensor to sensor variation. The use of standardized weather input values to estimate leaf wetness also makes possible leaf wetness forecasts, whereas analog sensors can only record what has already happened.
– Even though CART/SLD/Wind model is more accurate than 90+% RH hours at estimating leaf wetness duration, 90+% RH hours have been correlated with growth of some fungal pathogens. Fore that reason, 90+% RH hours are used as a predictor for those fungi instead of LW hours.
* GDD = Growing degree days
– GDD calculated by the simple “(max T + min T) / 2 – 50F” method.
See AgRadar Tools for other degree-days calculated and accumulated for different base temperatures and methods for use in species-specific crop and pest development models.
* LIVESTOCK STRESS
– The combined effects of air temperature, relative humidity, wind speed, and solar radiation on animal health, comfort, behavior, maintenance, and productivity. Similar to Apparent Temperature described above for humans to estimate heat and cold stress, but tuned for animals instead of humans. The livestock stress ratings are targetted for dairy and beef cattle, but also applicable to other domestic livestock species.
– The values
- SEN = Sensitive animals. Newborn or young animals. Mature animals that have been raised in sheltered or managed environments. Animals that are not adapted to the outside environment.
- RST = Resistant animals. Mature animals that have had time to acclimate to outdoor conditions by additional tissue or insulation or both; and are receiving nutrient supplies compatible with the level of environmental exposure.
– Animal characteristics that influence animal sensitivity include the amount of prior time for adaptation to hot or cold temperatures, age, size, genetics, body condition, body fat, coat insulation. Access to shade, moving air, and water reduce heat stress. Access to direct sun, protection from wind, and feed reduce cold stress.
– Wetting of animal coats works to suppress overheating. Wetting exacerbates cold stress. In cold conditions, excessive moisture contributes greatly to poor drying of the animal and increases energy requirements. The Livestock Temperature values and ratings do not account for the effect of wet hair coats and wet surface conditions.
– For livestock reared in uncovered outside facilities, pen and barn floor surfaces can act as significant heat emitters or heat sinks.
Unshaded sealed surfaces or packed soil in high traffic areas can radiate a significant amount of heat.
Vegetative or shaded surfaces tend to remain near ambient air temperature.
– Within enclosures, floor and wall temperatures, and lighting can affect temperature stress.
– For well-acclimated or heat-tolerant species (such as crossbred Bos Taurus x Bos indicus), threshold values would shift clown 1 or 2 categories. The heat stress ratings shown have not been adjusted downward, are as published by Mader et al. 2010, and are presumably the best fit for livestock in the northeastern U.S.
– The “livestock temperature” estimates used to assign ratings are based on the most extreme of two values: the CCI (Comprehensive Comfort Index) as per Mader et al. 2010, and the THI (Temperature Humidity Index) as per Gaughan et al. 2008. Additional heat stress measures as per Chen et al. 2020 and interpretation of livestock stress values for effect on DMI and productivity will be displayed in AgRadar Tools (Livestock).
- Livestock stress ratings (adapted from Mader et al. 2010)
XXX = Extreme-Danger from heat or cold stress.
EXT = Extreme heat or cold stress
SEV = Severe heat or cold stress
Mod = Moderate heat or cold stress
low = Low heat stress or cold stress.
0 = No environmental stress.
The 48-hour forecast table shows the highest livestock stress rating within each 3-hour interval.
The 10-Day Forecast and 7-Day Observation tables show the highest livestock stress rating for each 24 hour period.
- Livestock stress impacts
XXX: Extreme-Danger heat stress – High probability for livestock deaths, particularly for animals being finished, unless mitigation strategies are implemented such as increasing water availability, providing shade, or sprinkling.
EXT: Extreme heat stress – Serious risk of livestock deaths. All domestic livestock display significant dry matter intake (DMI) reduction.
SEV: Severe heat stress – Livestock deaths due to heat stress possible.
low heat stress – Possible decline of DMI or productivity for mature domestic livestock, including cattle, sheep, swine, and poultry.
low cold stress – Most species increase DMI due to mild cold stress.
Mod: Moderate cold stress – Most species display a significant increase in DMI.
- Livestock Temp. F Sensitive Resistant
Heat stress
113 + XXX XXX
104 — 113 EXT EXT
95 — 104 SEV SEV
86 — 95 Mod Mod
77 — 86 low low
72 — 77 low 0
50 — 72 0 (see note) 0
Cold stress
32 — 50 low 0
23 — 32 Mod low
14 — 23 SEV low
5 — 14 EXT Mod
-4 — 5 XXX Mod
-22 — -4 XXX SEV
-40 — -22 XXX EXT
< -40 XXX XXX
Note: Newborn and very young animals may experience cold stress at livestock temperatures as high as 59F.
DRYING and SPRAYING Index = Rough indicators for suitability of conditions for hay drying or sprayer application.
0…..1…..2…..3…..4…..5…..6…..7…..8…..9…..10
Less favorable More favorable
* Drying Index – A rough measure of the drying potential for cut hay and other materials due to surface evaporation. It is based on vapor pressure deficit, wind speed, and solar radiation. The drying index differs from ET evapotranspiration because it only includes physical evaporation does not include metabolically-driven transpiration.
– Values are scored from 0 (no drying) to 10 (very high drying potential).
– The values shown are the average for each 3-hour or 24-hour period.
* Spraying Index – A rough measure of the suitability of weather conditions for making airblast sprayer applications.
– Optimum wind speed at 2 meters above ground is defined as between 3 and 9 miles per hour. Lower or higher wind speeds are scored progressively lower. (Lower speeds score low because of potential for inversion conditions that can trap and carry spray drift long horizontal distance.)
– Optimum temperature is between 40 and 80 F. Optimum humidity is 40 to 80 %. Lower or higher values score progressively lower.
– Values are scored from 0 (conditions not suitable for spraying) to 10 (ideal spraying conditions in every category). The lowest indicator value constrains the combined rating for each hour.
– The values shown are the average hourly values for each 3-hour or 24-hour period.
Download hourly data files:
Each site has Excel-compatible CSV data files with hourly values for each variable.
https://mco.umaine.edu/wxag/