US Drought Monitor Categories
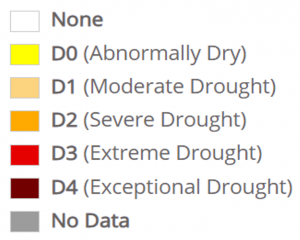
D0 Abnormally dry. 20-30th percentile Expected frequency is once every 3-5 years. Slower plant growth. Lawns brown early, gardens begin to wilt. Surface water levels fall.
D1 Moderate drought. 10-20th percentile. Expected frequency is once every 5-10 years. Possible crop damage. Hay and grain yields reduced. Trees, landscaping, and fish stressed. Honey production declines. Irrigation use and wildfires increase. Lower stream and pond levels. Water shortages expected. Voluntary water use restrictions.
D2 Severe drought. 5-10th percentile Expected frequency is once every 10-20 years. Significant chance of damage to crops or pastures. Fruit crop size and yield reduced. Hay prices increase. Fish kills occur, wildlife comes to farms for water. Irrigation ponds depleted. Outdoor water use restrictions enacted.
D3 Extreme drought. 2-5th percentile Expected frequency is once in 20-50 years. Widespread crop and pasture losses. Water shortages and restrictions widespread. Dug wells run dry. River flow much reduced and water temperature warmed, some streams run dry. Wildlife disease increases.
D4 Exceptional drought. 0-2nd percentile Expected frequency is less than once in 50 years. Water shortages at emergency levels. Low, empty, or depleting streams, ponds, reservoirs, and aquifers.
The USDM tracks drought over a 6-12 month or longer period from a blend of several indicators including precipitation and temperature anomalies, satellite-derived vegetation productivity, and modeled soil moisture. It is designed to serve multiple audiences not just agriculture, and responds more slowly to emerging dryness or recent precipitation than the Crop Moisture Index or other shorter term soil moisture measures . Some drought relief programs are tied to USDM ratings.