2021 Maine Farm Worker Compensation Survey
2021 Maine Farm Worker Compensation Survey
March 1 to April 2, 2021
INCLUDED DATA:
- Introduction
- Demographics
- Employer Data and Salaries
- Worker Pay Rates by Position, Year, and Experience Level
- Piece Work Data
- Types of Labor: Unpaid Family, H2A and Apprentices
- Paid Time Off
- Bonuses and Benefits
- Conclusion
Introduction
A survey was sent to farmers in March of 2021 requesting participation in a statewide survey about wages, pay, and benefits for farmers and employees. The survey was developed through a collaboration between the Maine Vegetable and. Small Fruit Growers Association and University of Maine Cooperative Extension. It was distributed through mailing lists of these two groups as well as other agricultural service provider agencies and grower associations. No similar report detailing Maine farmworker compensation exists, and the results of this survey are an initial snapshot. Although the turnaround was fast, with the survey closed just 1 month after it was released, we hope that the findings will be helpful for farmers and annual data from many more farms will be collected in future years.
Demographic Information
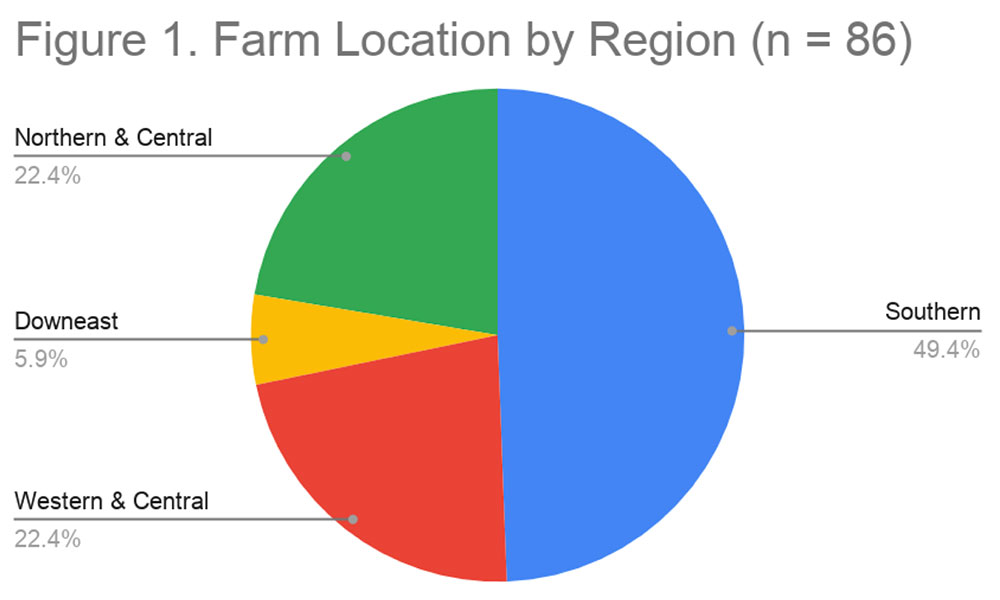
Surveys were returned from 86 farmers (n = 86) with paid employees who provided wage data. For location, the survey provided farmers with a selection of four geographic “regions” to select from. The regions included: “Southern Maine” (York, Cumberland, Androscoggin, Sagadahoc, Knox, Lincoln counties), “Western & Central Maine” (Kennebec, Oxford, Franklin, Waldo counties), “Downeast Maine” (Washington, Hancock counties), and “Northern & Central Maine” (Aroostook, Somerset, Penobscot, Piscataquis counties). The greatest number of responses came from farmers in the Southern Maine region (42 respondents, 49.1%, Figure 1).
Business Structure
Most responses came from family-owned farms using the structure of “Sole Proprietorship, LLC, General Partnership, etc.” (n = 78, 88.9%), with other farms “Non-Profit or L3C” (n = 5, 5.75%), “Corporately Owned” (n = 3, 3.45%), or “Cooperatively Owned” (n = 1, 15%).
Production Type and Acres of Production
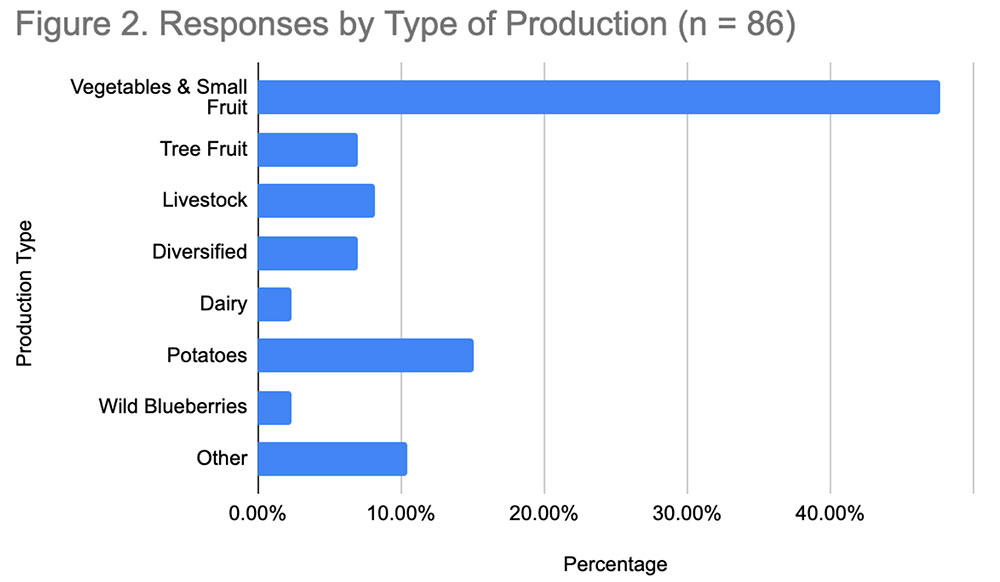
The greatest number of responses came from vegetable and small fruit producers (n = 41, 47.7% Figure 2). Detail of production type for the response of “other” was not provided.
Acres in production (excluding woodlot) ranged from less than 2 acres to over two hundred acres, see Table 1. Nearly 20% of responses (19.8%) were from farms with 21-80 acres in production.
| Acreage | Responses (n = 86) |
Percent of Responses |
|---|---|---|
| < 2 acres | 10 | 11.6% |
| 2-5 acres | 16 | 18.6% |
| 6-10 acres | 10 | 11.6% |
| 11-20 acres | 10 | 11.6% |
| 21-80 acres | 17 | 19.8% |
| 81-200 acres | 8 | 9.3% |
| > 200 acres | 15 | 17.4% |
Owner Pay and Annual Income
The survey included the question, “How do you, as the owner of your farm, pay yourself?” There were 84 responses to this question. One-third of respondents said “other” (n = 26, 30.1%), which for some farms included the comment “I don’t get paid at all,” but not all “other” responses provided detail about the pay type. Slightly less than one-quarter of respondents (n = 20, 23.8%) receive a “set weekly or monthly draw.” Some owners receive a “salary” (n= 15, 17.9%), and some receive a “percentage of revenue at the end of the season” (n = 13, 15.5%). The fewest number of respondents pay themselves an “hourly wage” (n = 10, 11.9%).
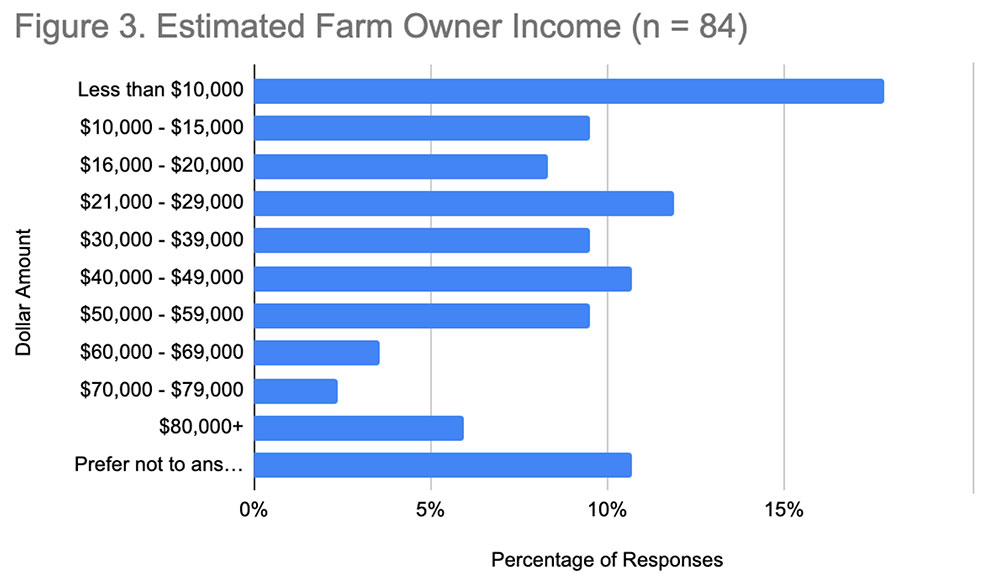
Farmers were asked how much income they received annually from the farm. Nine farm income categories were provided ranging from less than $10,000 to over $80,000. 11% of respondents (n = 9) chose not to answer. Figure 3 illustrates the farm owner incomes.
Number and Type of Employees
Multiple survey questions asked about the number and types of employees on the farm.
H2A Workers. One question asked, “do you hire H2A workers?” Nine responded “yes” (10% of respondents), 77 responded “no” (90% of respondents).
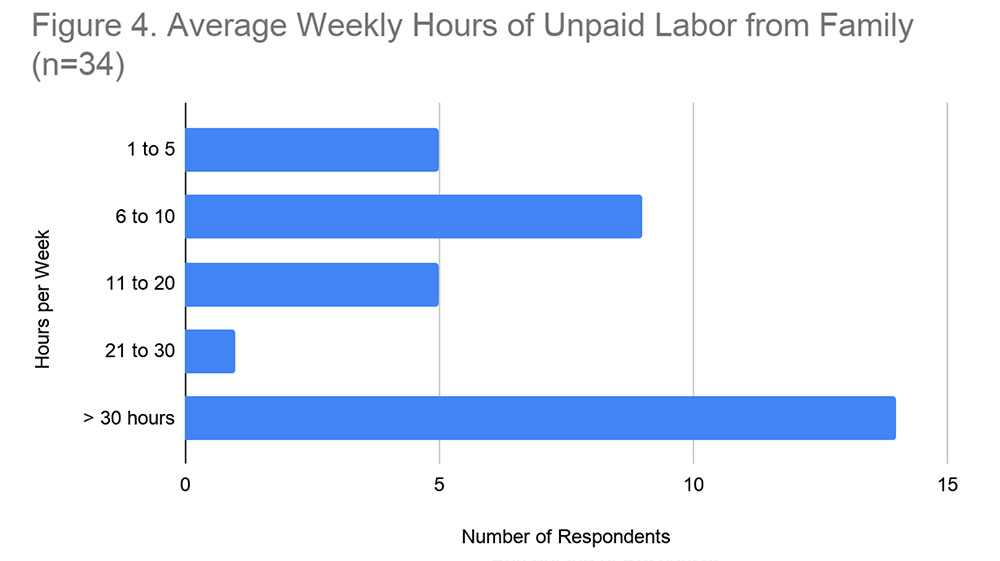
Unpaid Family Labor. Another question asked farmers “do you rely on any unpaid labor from family members to operate your farm?” 40.1% (n=34) responded “yes.” Of these responses, the number of hours of unpaid labor provided by family members is illustrated in Figure 4.
Paid Employees. Farmers were asked, “How many people do you employ at the peak of your season and year-round? (Please do not include yourself or any owners.)” Response categories were provided. Nearly half of respondents (n = 40, 47%) have no year-round employees. These figures include all types of employees. Figure 5 illustrates the number of employees at both peak and year-round.

Compensation for Farm Employees
The two tables in this section summarize hourly and salary (if applicable) pay in both 2020 and 2021 as reported by farmers about their farms in the March survey. Averages, highest and lowest dollar amounts (range), and the number of responses under each category are reported.
| *ND = No Data. No respondents gave information related to these categories. From that, we can infer that there are very few farms paying employees in those categories in that way. (Ex. There were no respondents who are paying prep pack workers a salary.) | |||||||
| 2020 | 2021 | ||||||
|---|---|---|---|---|---|---|---|
| Student | Entry Level Adult | Experienced | Student | Entry Level Adult | Experienced | ||
| Manager (Hourly) | Average | $13.38 | $14.75 | $17.06 | $13.30 | $15.01 | $17.73 |
| Range | $12 to $15 | $13 to $18 | $14 to $24 | $12.15 to $14.75 | $13.15 to $17.50 | $15 to $22 | |
| # of Responses | 4 | 12 | 26 | 3 | 13 | 22 | |
| Manager (Salary) | Average | $34,000.00 | $44,500.00 | $34,000.00 | $46,391.67 | ||
| Range | ND* | $34K | $28.6K to $68K | ND* | $34K | $31.2K to $68.5K | |
| # of Responses | 1 | 8 | 1 | 12 | |||
| Equipment Operator (Hourly) | Average | $12.88 | $14.25 | $16.15 | $13.50 | $14.89 | $16.95 |
| Range | $12.15 to $14 | $13 to $16.75 | $13.75 to $20 | $13 to $15 | $13 to $17 | $14 to $21 | |
| # of Responses | 3 | 11 | 20 | 4 | 11 | 21 | |
| Farm Laborer (Hourly) | Average | $12.52 | $13.30 | $14.59 | $12.84 | $13.57 | $15.03 |
| Range | $10 to $15 | $8 to $20 | $9 to $20 | $10 to $15 | $8 to $20 | $9 to $20 | |
| # of Responses | 29 | 52 | 49 | 25 | 45 | 51 | |
| Prep/Pack (Hourly) | Average | $12.69 | $13.93 | $14.99 | $12.80 | $13.93 | $15.30 |
| Range | $8 to $15 | $12 to $18 | $12.25 to $20 | $10 to $15 | $12 to $16 | $12.25 to $20 | |
| # of Responses | 8 | 15 | 20 | 6 | 14 | 21 | |
| Prep/Pack (Salary) | ND* | – | – | – | – | – | – |
| Farm Stand Manager (Hourly) | Average | $12.90 | $13.81 | $15.26 | $12.43 | $14.14 | $15.63 |
| Range | $12 to $15 | $12 to $17 | $13 to $18 | $12.15 to $13 | $12.50 to $17 | $13.5 to $18 | |
| # of Responses | 5 | 13 | 18 | 3 | 12 | 18 | |
| Farm Stand Manager (Salary) | Average | $45,000.00 | $37,500.00 | $43,250.00 | |||
| Range | ND* | $45K | $37.5K | ND* | ND* | $37.5K to $49K | |
| # of Responses | 1 | 1 | 2 | ||||
| Truck Driver (Hourly) | Average | $14.33 | $15.85 | $17.20 | $14.00 | $16.25 | $17.60 |
| Range | $13 to $15 | $13 to $25 | $14.25 to $28 | $13 to $15 | $13 to $25 | $14.25 to $28 | |
| # of Responses | 3 | 10 | 14 | 2 | 8 | 12 | |
| Apprentice or Intern (Hourly) | Average | $12.70 | $13.10 | $13.75 | $12.79 | $14.08 | $13.75 |
| Range | $12 to $14 | $12 to $15 | $13 to $14.5 | $12 to $14 | $12 to $19 | $13 to $14.50 | |
| # of Responses | 5 | 5 | 2 | 7 | 6 | 2 | |
Table 3 is a summary of the pay rates by geographic region. Due to lower responses in each region and to ensure farm anonymity, only information for “Hourly Farm Laborer” is reported by region. The regions were defined as Downeast (Hancock and Washington counties), North Central (Aroostook, Somerset, Penobscot, Piscataquis counties), Southern (York, Cumberland, Androscoggin, Sagadahoc, Knox, Lincoln counties), and Western Central (Kennebec, Oxford, Franklin, Waldo counties).
| 2020 | 2021 | |||||||
|---|---|---|---|---|---|---|---|---|
| Student | Entry Level Adult | Experienced | Student | Entry Level Adult | Experienced | |||
| Farm Laborer (Hourly) | Down East | Average | $13.33 | $15.33 | $14.50 | $13.38 | $15.38 | $15.08 |
| Range | $12 to $15 | $13 to $20 | $14 to $15 | $12.15 to $15 | $13 to $20 | $15 to $15.15 | ||
| # of Responses | 3 | 3 | 2 | 3 | 3 | 2 | ||
| North Central | Average | $12.36 | $13.10 | $14.61 | $12.78 | $13.77 | $15.12 | |
| Range | $11 to $14 | $11 to $16 | $13.5 to $16 | $12 to $14.50 | $12 to $17 | $14 to $17 | ||
| # of Responses | 7 | 11 | 10 | 6 | 9 | 8 | ||
| Southern | Average | $12.14 | $12.84 | $14.31 | $12.47 | $13.26 | $14.82 | |
| Range | $10 to $15 | $8 to $15 | $9 to $17 | $10 to $15 | $8 to $16 | $9 to $20 | ||
| # of Responses | 15 | 25 | 24 | 12 | 25 | 26 | ||
| Western Central | Average | $13.17 | $13.79 | $15.18 | $13.17 | $13.43 | $15.33 | |
| Range | $12 to $15 | $12 to $15 | $13 to $20 | $12 to $15 | $12 to $15 | $13 to $20 | ||
| # of Responses | 3 | 12 | 11 | 3 | 7 | 12 | ||
There were enough responses from vegetable and small fruit producers (n=41) to create a separate vegetable and small fruit-specific compensation table in Table 4.
| *ND = No Data. No respondents gave information related to these categories. From that, we can infer that there are very few farms paying employees in those categories in that way. Ex. There were no respondents who are paying prep pack workers a salary.
** ID= Insufficient data. ID refers to categories in which only one respondent provided data. |
|||||||
| 2020 | 2021 | ||||||
|---|---|---|---|---|---|---|---|
| Student | Entry Level Adult | Experienced | Student | Entry Level Adult | Experienced | ||
| Manager (Hourly) | Average | $15.20 | $16.14 | $15.07 | $17.39 | ||
| Range | ID | $13 to $15 | $14 to $18.50 | ID | $14 to $17 | $15 to $21 | |
| # of Responses | 5 | 14 | 7 | 14 | |||
| Manager (Salary) | Average | $40,000.00 | |||||
| Range | ND | ND | ID | ND | ND | $37K to $43K | |
| # of Responses | 2 | ||||||
| Equipment Operator (Hourly) | Average | $14.94 | $15.43 | $13.00 | $15.46 | $17.00 | |
| Range | ID | $13 to $16.75 | $14 to $16 | $13 | $15 to $16.75 | $15 to $18 | |
| # of Responses | 4 | 7 | 2 | 6 | 8 | ||
| Farm Laborer (Hourly) | Average | $12.53 | $13.10 | $14.40 | $12.95 | $13.28 | $14.65 |
| Range | $10 to $15 | $8 to $15 | $9 to $17 | $10 to $15 | $8 to $15 | $9 to $17 | |
| # of Responses | 15 | 27 | 27 | 13 | 22 | 29 | |
| Prep/Pack (Hourly) | Average | $12.42 | $14.00 | $14.93 | $12.93 | $14.02 | $15.10 |
| Range | $8 to $15 | $12 to $18 | $14 to $16.75 | $10 to $15 | $12.15 to $15 | $14 to $16.75 | |
| # of Responses | 6 | 9 | 10 | 5 | 9 | 12 | |
| Prep/Pack (Salary) | ND | – | – | – | – | – | – |
| Farm Stand Manager (Hourly) | Average | $12.50 | $13.88 | $15.42 | $12.58 | $14.44 | $15.88 |
| Range | $12 to $13 | $12 to $17 | $13 to $18 | $12.15 to $13 | $13 to $17 | $13.50 to $18 | |
| # of Responses | 3 | 8 | 9 | 2 | 8 | 10 | |
| Farm Stand Manager (Salary) | ND | – | – | – | – | – | – |
| Truck Driver (Hourly) | Average | $14.67 | $15.75 | $15.00 | $15.88 | ||
| Range | ID | $13 to $17 | $15 to $17 | ID | $13 to $17 | $15 to $17 | |
| # of Responses | 3 | 4 | 3 | 4 | |||
| Apprentice or Intern (Hourly) | Average | $13.00 | $13.67 | $13.00 | $13.67 | ||
| Range | $12 to $14 | $12 to $15 | ND | $12 to $14 | $12 to $15 | ND | |
| # of Responses | 3 | 3 | 3 | 3 | |||
There were enough responses from potato producers (n=13) to create a separate potato-specific compensation table in Table 5.
| *ND = No Data. No respondents gave information related to these categories. From that we can infer that there are very few farms paying employees in those categories in that way. Ex. There were no respondents who are paying prep pack workers a salary.
** ID= Insufficient data. ID refers to categories in which only one respondent provided data. |
||||||||
| 2020 | 2021 | |||||||
|---|---|---|---|---|---|---|---|---|
| Student | Entry Level Adult | Experienced | Student | Entry Level Adult | Experienced | |||
| Manager (Hourly) | Average | $19.30 | $18.63 | |||||
| Range | ND | ID | $16 to $24 | ND | ID | $16.5 to $21.5 | ||
| # of Responses | 5 | 4 | ||||||
| Manager (Salary) | Average | |||||||
| Range | ND | ND | ID | ND | ND | ID | ||
| # of Responses | ||||||||
| Equipment Operator (Hourly) | Average | $14.83 | $17.79 | $15.50 | $18.08 | |||
| Range | ID | $14 to $16 | $14 to $20 | ID | $14 to $17 | $15 to $21 | ||
| # of Responses | 3 | 7 | 2 | 6 | ||||
| Farm Laborer (Hourly) | Average | $12.50 | $13.03 | $14.93 | $13.17 | $13.65 | $15.60 | |
| Range | $11 to $14 | $11 to $15 | $14 to $16 | $12 to $14.5 | $12 to $15 | $14 to $17 | ||
| # of Responses | 3 | 6 | 6 | 3 | 5 | 5 | ||
| Prep/Pack (Hourly) | Average | |||||||
| Range | ND | ND | ID | ND | ND | ID | ||
| # of Responses | ||||||||
| Prep/Pack (Salary) | ND | – | – | – | – | – | – | |
| Farm Stand Manager (Hourly) | ND/ID | – | – | – | – | – | – | |
| Farm Stand Manager (Salary) | ND | – | – | – | – | – | – | |
| Truck Driver (Hourly) | Average | $15.00 | $16.70 | $15.00 | $16.85 | |||
| Range | ID | $14 to $16 | $14.5 to $20 | ID | $14 to $16 | $15 $20 | ||
| # of Responses | 3 | 5 | 2 | 4 | ||||
| Apprentice or Intern (Hourly) | ND | – | – | – | – | – | – | |
Piece Work
The survey included the question, “do you pay any workers for piece work?” Of 86 respondents, 9 (10%) reported paying workers for piece work. Table 4 provides pay rates for both 2020 and 2021 for strawberries, blueberries, apples, and peas as reported by farmers in the March survey.
| Unit | 2020 Rates | 2021 Rates | |
|---|---|---|---|
| Strawberries | Quart | $0.75 to $1.50 | $1.50 |
| Pound | $1.00 | $1.00 | |
| Blueberries | Pint | $1.50 to $2.20 | $1.50 to $2.40 |
| Apples | Bushel | $1.43 | $1.50 |
| Peas | Pound | $1.00 to $1.10 | $1.00 |
Room and Board
The survey included the question “Do you provide housing as part of the compensation package for any of your employees? (Please do not include H2A workers, apprentices, or interns here.)” Excluding H2A workers, apprentices, or interns, 11.63% of respondents (n=10) provide housing for employees as part of their compensation package.
A follow-up question asked, “Do you provide free room and board for apprentices or interns?”
9.6% (n=8) of respondents offer free room and board for apprentices or interns.
PTO, Benefits, and Bonuses
The survey included questions about PTO, types of benefits, and bonuses.
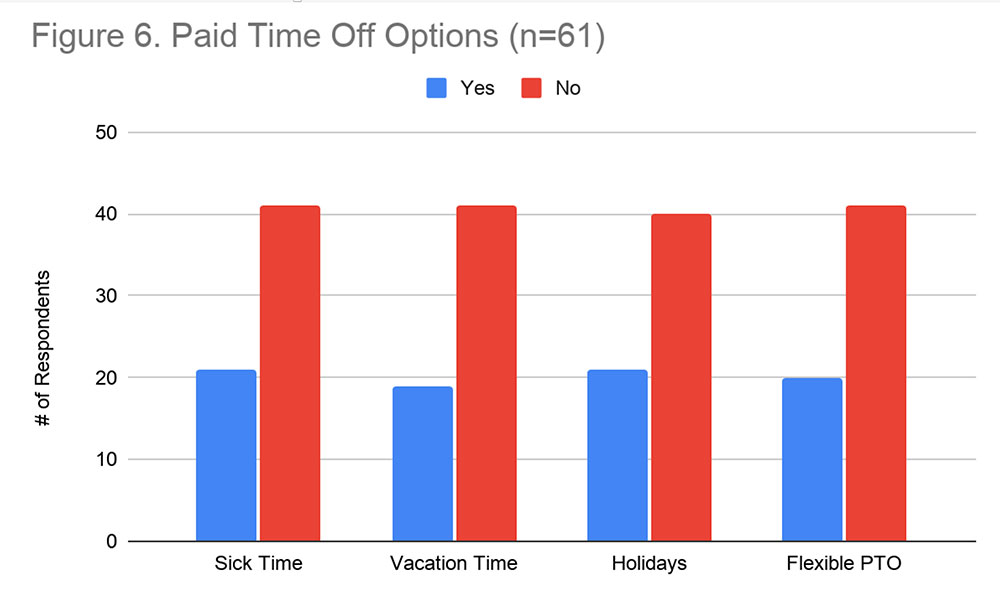
Respondents were provided with choices: sick, vacation, holidays, flexible PTO to answer the question “Please tell us about any paid time off (PTO) you offer – How do you determine when this is appropriate to offer?”
Figure 6 illustrates the types of PTO that are offered by the 61 respondents who do offer PTO. Of those offering PTO, 95% offer paid sick leave, 85% offer paid vacation, 71% offer paid holidays, and 89% offer flexible paid time off for their seasonal employees.
For year-round employees, 86% are offered paid sick time, 70% receive paid vacation, 77% have paid holidays, and 86% are given flexible time off.
There was a wide variation in how farm owners approach determining paid time off (PTO) policies for employees.
Sick Time (n=61). 34% offer sick time. Some have no prerequisites or waiting period, while others reserve paid sick leave for managers or long-term employees only. Most allow employees to accrue time, ranging from 2-18 days per season.
Vacation Time (n=61). 32% offer vacation time. This benefit generally required long-term employment. Some required it not be taken during the busiest part of the season.
Holidays (n= 61). 34% offer paid holidays off. Ten farmers (17%) described their paid holiday policies, with about half offering them to all employees from the beginning of employment and half offering this benefit only to salaried and long-term employees. Some offer holidays off with no pay in the summer.
Flexible Paid Time Off (n=61). 33% offer some form of flexible paid time off. Thirteen farms (19%) offered flexible time off, which included vacation time in some cases. A majority of respondents allow employees to accrue this time from the day they begin work, and some offer this to full-time employees only. Each described a policy they have come up with and some said that they include this in their employee handbook.
Other Benefits (n=61). Thirteen farms (19%) report offering health insurance to year-round employees with nine (15%) also offering retirement accounts such as a 401k or IRA. Many farms reported offering free farm products and or discounts to their employees.
Raises (n=86). 48.8% (n=41) reported offering raises during the season, while 51.2% (n=43) do not. Of those offering raises, they ranged from .25/hour to $2.00/hour with 28% of respondents offering .50/hour raises, while 35% offer raises of $1.00/hour. Raises are based on performance, competency laid out in the employee manual, and generally evaluated mid-season or some other regular interval. A typical response was “When an employee is working faster, taking initiative and contributing to the farm without being asked.”
Bonuses (n=86). 55% (n = 45) reported offering bonuses, which are primarily based on quality of work, tenure at the farm, and whether the farm is having a particularly successful season. Many also mentioned Christmas bonuses for year-round staff.
Conclusion
The 2021 Maine Farm Worker Compensation Survey was created in response to numerous, unsolicited comments from farm operators throughout the state, concerned and uncertain about how their worker wage rates compared to other farms in their areas.
The data from the survey is a snapshot of the current farm worker compensation practices on Maine farms. While the respondents represented a wide diversity of regions and production types, the majority of respondents were vegetable and small fruit producers (49.4%) from Southern Maine (47.7%). There was a fairly even and wide representation of acreages farmed and farm owner incomes.
The data in the worker compensation tables will assist farm managers to make informed decisions about pay rates and benefits to offer based on comparable positions within their regions and production types. Through the review of this data, we hope that farmers will be more confident and competitive in setting their wage rates, and better able to attract and retain a reliable workforce during this time of a tight labor market.