Bulletin #1162, 2023 Maine Agricultural Operations Labor and Compensation Practices

By Jason S. Entsminger, Ph.D., State Extension Specialist for Small Business and Assistant Professor of Entrepreneurship and Innovation, University of Maine Cooperative Extension
Morgan Bui, Graduate Research Assistant, University of Maine
Jason Lilley, Sustainable Agriculture and Maple Industry Educator and Assistant Extension Professor, University of Maine Cooperative Extension
Leslie Forstadt, Ph.D., State Extension Specialist for Human Development and Extension Professor in Human Development, University of Maine Cooperative Extension
For information about UMaine Extension programs and resources, visit extension.umaine.edu.
Find more of our publications and books at extension.umaine.edu/publications/.
Table of Contents
- Introduction
- Characteristics of Agricultural Operations
- Labor Use: Sources, Employees and Roles
- Compensation Practices
- Demographics
- Conclusion
- Gallery of Figures
- Gallery of Tables
- Full Descriptions of Figures and Tables
Introduction
This bulletin reports selected results of a statewide monitoring survey to understand the labor and compensation practices of agricultural operations. Data was collected in 2023 during March and April, with survey questions covering the calendar years of 2022 and 2021. Invitation to participate in the questionnaire was open to all agricultural operations in Maine. This invitation was shared via direct emails, over listservs for the state’s agricultural community, and announcements published in digital newsletters, targeting operators of farms, ranches, aquaculture facilities, and other agricultural operations in the state. Industry and government partners were asked to share the invitation through email and via a presentation to the Agricultural Council of Maine by the Project Director.
The study was entitled the 2023 New England Agricultural Operations Labor and Compensation Practices Survey. It was reviewed and cleared as a research protocol by the University of Maine’s Institutional Review Board, within the Office of Research Compliance. The 2023 version of the survey represented an update and revision to a prior data collection effort employed in 2021 by University of Maine Extension personnel in collaboration with the Maine Vegetable and Small Fruit Growers’ Association (MVSFGA). For the 2023 version, the MVSFGA was not involved in survey instrument design. The revised and updated questionnaire maintained many of the core items in the 2021 survey.
In total, 84 individuals from Maine indicated they would be willing to participate. As of the 2017 Census of Agriculture—the most recent agricultural census for which public data is available—there were an estimated 7,600 farms in Maine. This is the effective population size of agricultural operations in the state. To have a statistically representative sample of this population (within the 95% confidence interval), a total of 366 completed surveys would be needed. Not all respondents offered information for all questions; valid responses across items typically numbered 50 or less. Data presented in this bulletin should be used with care, only as a decision guide for managers. Other use, including to inform public policy, is not recommended.
Key Definitions
Agricultural Operation. The combined set of land, equipment, crops, animals, labor, and practices which form a business whose primary activity is the production of food, fiber, and related goods and services. This term encompasses farms, ranches, cultivated aquaculture facilities, and facilities for the growing and harvesting of plants and animals indoors.
Operators. Those people involved in management and/or decision-making within an agricultural operation. Typically included are those who make business decisions which allocate resources, such as production practices, directing labor, marketing, and financing.
Respondents. Refers to those persons who provided information on the survey questionnaire form. Typically, these were operators.
Characteristics of Agricultural Operations
Location by Region
Respondents were asked to identify the state and county where their operation primarily engages in production. Sixty-two (62) valid responses identifying the primary county were provided. Based on primary counties, responses were grouped by the research team into four regions. These included: the Southern region (York, Cumberland, Androscoggin, Sagadahoc, Knox, and Lincoln counties), the Western-Central region (Kennebec, Oxford, Franklin, and Waldo counties), the Downeast regions (Washington, Hancock counties), and the North-Central region (Aroostook, Somerset, Penobscot, and Piscataquis counties). The region with the largest number of respondents was the Southern region with 52% of responses. Figure 1 presents data for the percent of valid responses by region.
Business Organizational Structure
Respondents were asked about the organizational structure of their operations. Of the 50 responses, 62% reported that they do business as a registered corporation. An additional 30% reported they operate as an unregistered individual or family enterprise, such as a sole proprietorship. None of the respondents indicated that their business is a cooperative. Additionally, 92% of respondents indicated that a majority of their business (50% or more) is owned by members of their household or family, regardless of organizational form. Figure 2 presents data for the percent of valid responses by organizational structure.
Production Types and Product Mix
To understand the types of revenue sources within their agricultural operations, respondents were asked to provide information about the types of products their operations produce and their participation in other on-farm activities. Respondents were asked to indicate all production types and activities in the operation by selecting all provided choices that apply to their business. In total, 61 respondents offered this information. Figure 3 reports the number of operations with each product type, while Figure 4 reports the number of operations engaging in other on-farm activities.
A plurality of operations include the production of “other vegetables and small fruits” (37 respondents). Sixteen respondents noted they produce tree fruit and nuts and 14 indicated they produce potatoes. Notably, 17 indicated they produce other agricultural products not listed by the researchers; they noted in free responses a broad array of products including apiary products (honey and beeswax), live plants, herbs, and floral products. The mean number of different production types within an operation was 1.9, with 52.5% of respondents indicating only one product type in the operation and 26.2% indicating two types.
In addition to product types, notable numbers of respondents indicated they engage in direct marketing practices (33 responses), on-farm value-added activities (26 responses), and agritourism (25 responses).
Acres in Active Production
Acres in active production (excluding woodlot) within operations ranged from less than 2 acres to more than 200 acres. Of the 50 responses, 26% (13 respondents) reported that their operations hold 21-80 acres in production and 24% (12 respondents) reported that they hold less than 2 acres in production. Table 1 reports the number and percentage of responses for different acreage categories.
Value of Sales
This survey also inquired about the gross value of sales by the operation in 2022. Of the 44 responses to this question, the gross value of sales ranged from less than $1,000 up to $1,000,000. Figure 5 presents the number of operations by sales category.
An equal number of respondents (9 each) indicated their operation’s 2022 gross value of sales was within the ranges of $10,000 to $49,999 and $100,000 to $249,999. There were also eight (8) respondents each whose sales category fell within the ranges of $250,000 to $499,999 and $500,000 to $999,999.
Labor Use: Sources, Employees and Roles
Labor Sources
Respondents were asked about sources of labor on the farm for calendar year 2022. Table 2 reports key statistics about the number of respondents (N) who provided information about the sources or types of labor they employ within their operations and the mean and median number of workers of these backgrounds. There were three labor sources investigated: seasonal versus year-round paid employees, paid and unpaid labor from household and family members, and those who are migrant workers.
A total of 40 respondents indicated their operations employed seasonal labor, while 36 employed year-round labor that are not operators or managers. Seasonality was defined in line with USDA surveying practices as those workers employed for less than 150 days in the year. Those employed for 150 or more days in the year are considered year-round workers. The mean number of seasonal workers (less than 150 days) employed by the sample is 13.88, while the median was 5. With the mean being higher than the median by a significant amount, this indicates a broad range of response values with the potential for some outliers, such as those who employ large amounts of seasonal labor. Conversely, the mean number of year-round workers was 5.47, and the median was 3.
Managerial Labor
The survey asked producers about the total number of people involved in management and/or decision-making in 2022. Figure 6 reports the percent of valid responses by number of operators within the firm. There were 58 people who responded to this question. These responses indicated that most operations are managed by either one or two operators (74.1%). Approximately one-quarter (25.7%) of the respondents indicated their operations had three or more people managing the business. On average, respondents’ businesses had 2.36 operators (median of 2 operators) managing the firm.
Non-Managerial Roles
In addition to managerial labor, most operations employ workers to perform a variety of activities such as production, sales, transportation, and other business functions. Figure 7 presents the percentage of respondents indicating that various worker roles were employed by their operation in 2021 or 2022.
Compensation Practices
Owner, Operator, and Manager Compensation
The questionnaire asked about the manner in which the respondent is compensated (i.e. the structure of their) and their compensation level (i.e. how much they are compensated). Virtually all respondents are operators; of the 54 respondents, 48 said they were owner-operators, five (5) said they were non-owner managers/operators, and one (1) indicated their role as other. These 54 respondents provided information about their compensation structure (see Figure 8 for data) and level (see Figure 9 for data).
One-third of respondents (33%) indicated that they have a compensation style not listed by the research team. Thirty-two percent (32%) noted that they receive some type of fixed allotment, either as an annual salary (17%) or periodic draw (15%). An additional 28% said they are compensated via a set share of profit at the end of the season. Earnings for responding operators from their role in the operations are low. Of the 54 respondents, 37% earned less than $10,000 from their farm in 2022 and another 37% earned between $10,000 and $40,000.
Operations with 2 or more operators were asked to identify the average compensation level in 2022 for all other managers, excluding the respondent. Results indicate those other managers compensated via salary had average earnings of $35,944 (n=17), those paid an hourly wage earned $16.35 per hour (n=12), and those compensated via profit share received on average 22.43% of operation profit (n=7).
Worker Compensation
Respondents were asked to indicate the types of pay structures used for each of the worker types they had previously indicated being employed within their operation. Three pay type options were given: (a) salary; (b) hourly wage; and (c) piecework. A total of 41 respondents offered information for this question. Salary and piecework pay types are used less among the respondents. Salaried compensation is provided for farm workers by four (4) operations; three (3) use this structure for farm machinery and equipment operators and office and other business workers; two (2) use it for apprentices and interns; and one (1) for customer service and sales personnel. Only three (3) respondents indicated they use the piecework pay structure for any worker type. Most respondents indicated that they employ an hourly wage pay structure across types of workers. Table 3 presents the number of responding operations that utilize hourly wages by worker type as well as the proportion of operations with these kinds of workers that use hourly wages.
Along with pay structures, respondents were asked to indicate the average compensation rates they offered based on both worker type and level of experience. They were asked to report these numbers for both 2021 and 2022 calendar years. Given the low number of responses for salaried and piecework pay structures, we do not report data for those types. Similarly, we do not report data for the “student” experience level for any worker type. Table 4 reports the mean wages and total responses for selected worker types and experience levels for both years.
Among those who completed the survey, average wage rates increased between the 2021 and 2022 calendar years. Average hourly wages for many of the worker type-experience level combinations in 2022 were at or above the commonly identified minimum wage target of $15 per hour – the exception being entry-level farm laborers for whom operator reports indicated a mean hourly wage of $14.40 per hour. Readers are reminded to exercise caution in the use of this data; while this survey data is helpful as a decision tool for operation managers, the sample sizes are too small to be statistically representative of the population of Maine farms and ranches.
In addition to monetary compensation, respondents were also asked about other benefits provided to workers in their operation. Respondents could select more than one response for this question. Here, we summarize data aggregated at the operation level across all worker types. Of the 28 respondents who provided information on these items, a majority (71%) of their operations offer bonuses to workers. Fewer than half offer established holidays (46%) and vacation time (43%).
Twelve respondents indicated they offer rooming/housing to at least one worker type, and four (4) offer board (i.e. meals).
Demographics
In line with the University of Maine Cooperative Extension’s obligations under Civil Rights reporting standards and best practices in social scientific research, respondents were also provided the opportunity to report on several demographic items at the end of the survey. These included one question about the number of operators in their business who identify with a series of historically underserved groups, as well as a series of questions about the respondent’s identification with various groups.
In total, 30 firms have at least one operator who identifies as a woman, four (4) firms have at least one operator who is a veteran, and four (4) firms have at least one operator who is Black, Indigenous, or a person of color. One firm indicated it has at least one LGBT+-identifying operator, and one firm indicated it has at least one “new American” (immigrants, refugees, or asylum seekers) operator.
In terms of survey respondents themselves, 43 respondents indicated that they identify as White/Caucasian, two (2) as Asian, two (2) as Native American, one (1) as Black or African American, and one (1) as of Hispanic or Latino origin. Along gender lines, the respondent pool included 25 participants identifying as female and 23 identifying as male. A total of two (2) respondents identified with some portion of the Lesbian, Gay, Bisexual, or Transgender community.
Conclusion
The 2023 New England Agricultural Operations Labor and Compensation Practices Survey was implemented to continue monitoring of changes in labor use and compensation rates and types in the wake of the COVID-19 pandemic. The initial monitoring survey in 2021, the 2021 Maine Farm Worker Compensation Survey, responded to “numerous, unsolicited comments from farm operations throughout the state.” Amid data collection efforts in Spring of 2023, several state policy changes were proposed that had or have the potential to impact agricultural operations’ practices including pay and benefits for agricultural employees.
Unfortunately, due to the small response rates, the use of this data should be limited to informational purposes for operation decision makers. A lack of coverage means that data is not reported beyond state-level aggregation. Accounting for the limitations noted, the information collected in 2023 for the two prior calendar years does provide preliminary support to indicate that operators in Maine may be responding to market forces. For example, the mean hourly wage for entry-level and experienced farm laborers reported for 2022 in this survey is higher than those for 2020 reported in the previous survey.
Gallery of Figures
- Click on the figure to enlarge its view.
- Full descriptions of figures may be found at the bottom of the page: Gallery of Figures Full Descriptions or by clicking on the chart caption’s ‘Full Description’ link.
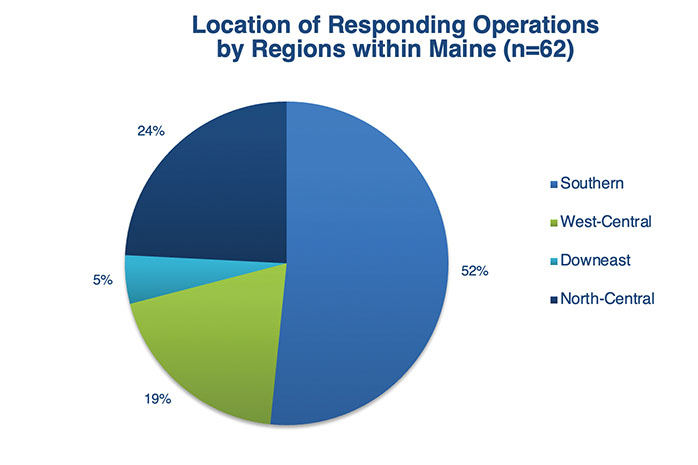
Figure 1 Full Description, Below
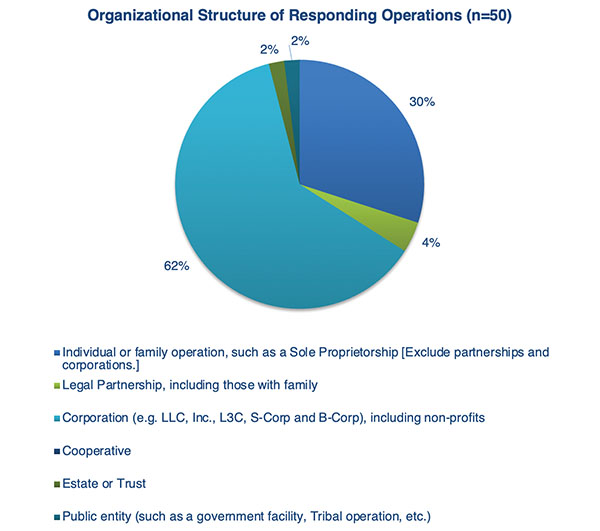
Figure 2 Full Description, Below
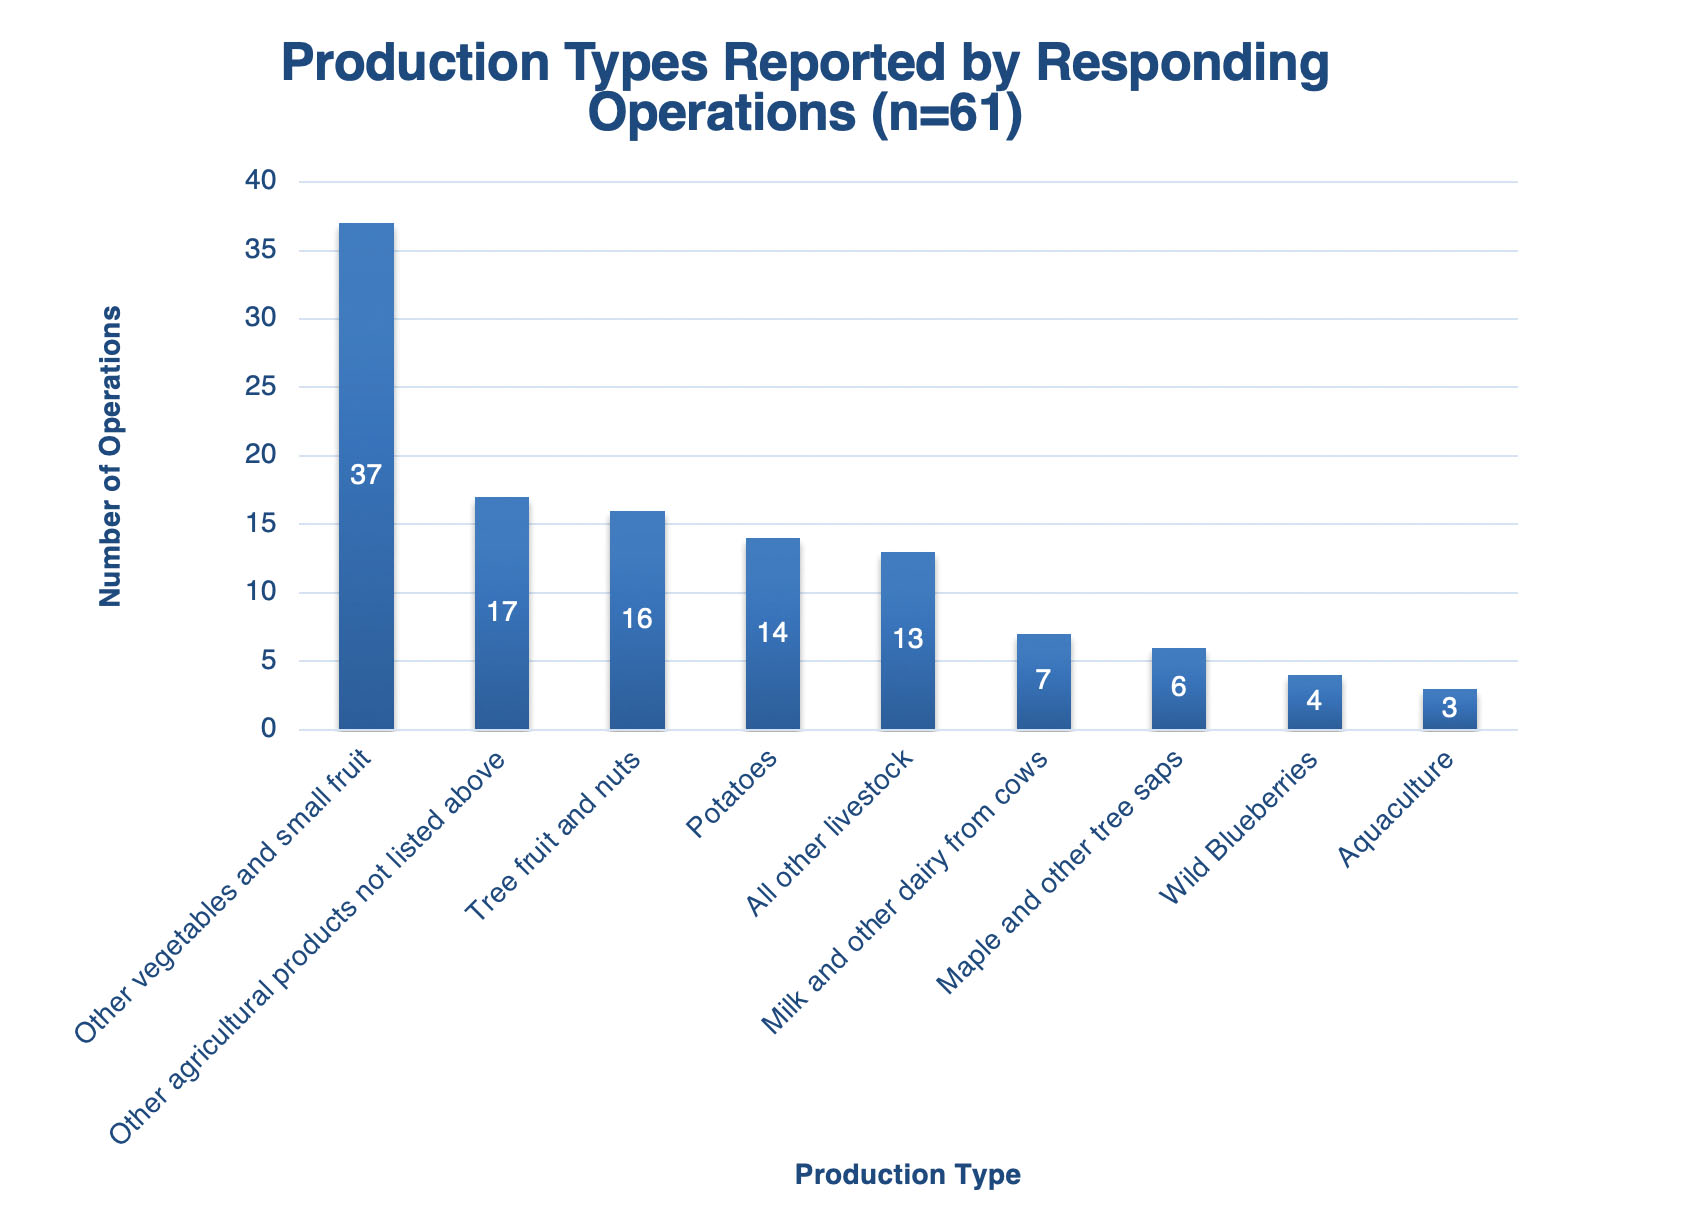
Figure 3 Full Description, Below
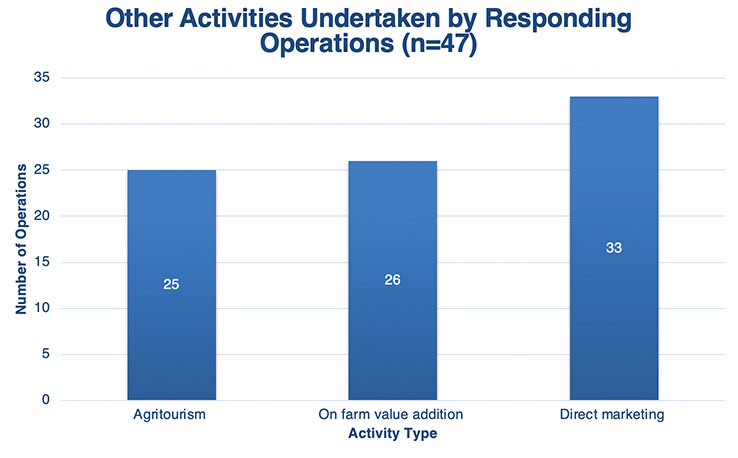
Figure 4 Full Description, Below
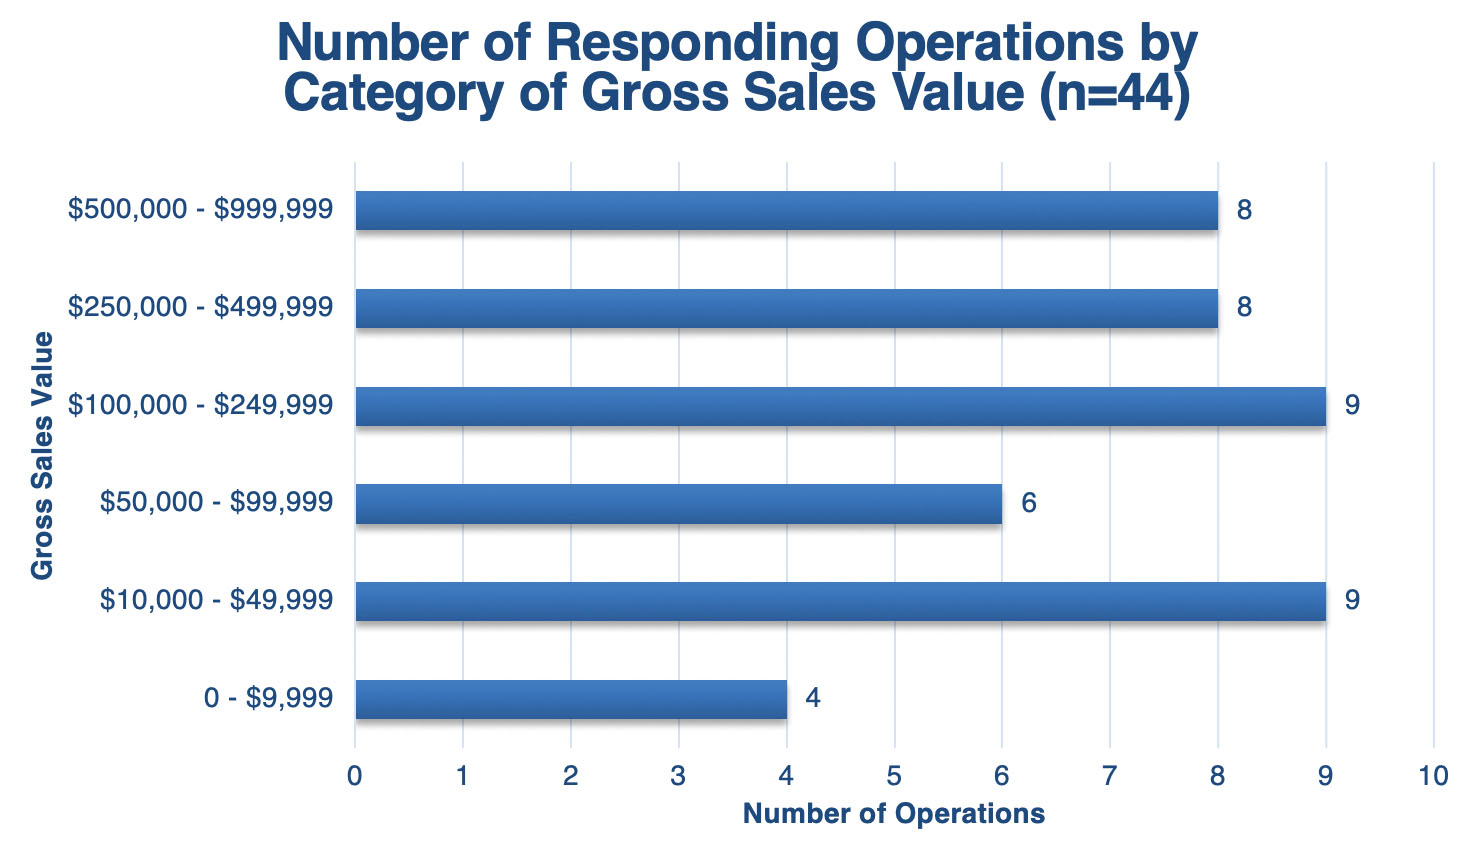
Figure 5 Full Description, Below
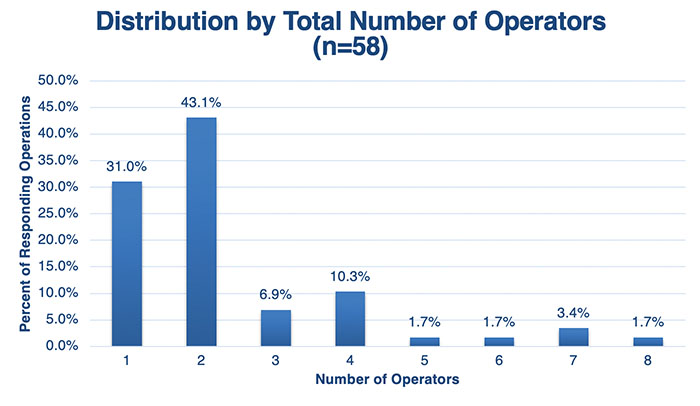
Figure 6 Full Description, Below
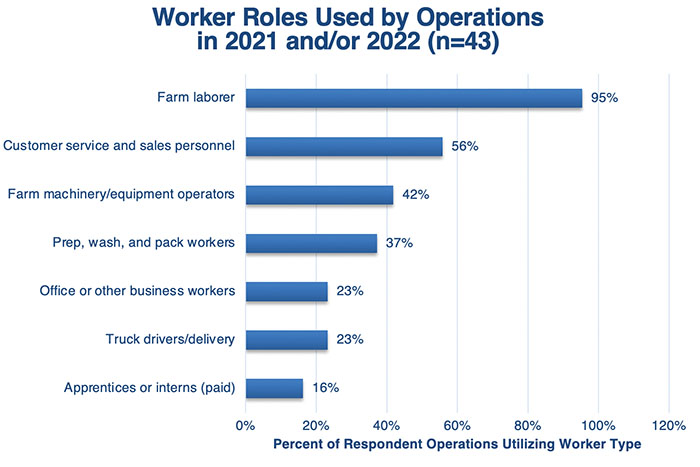
Figure 7 Full Description, Below
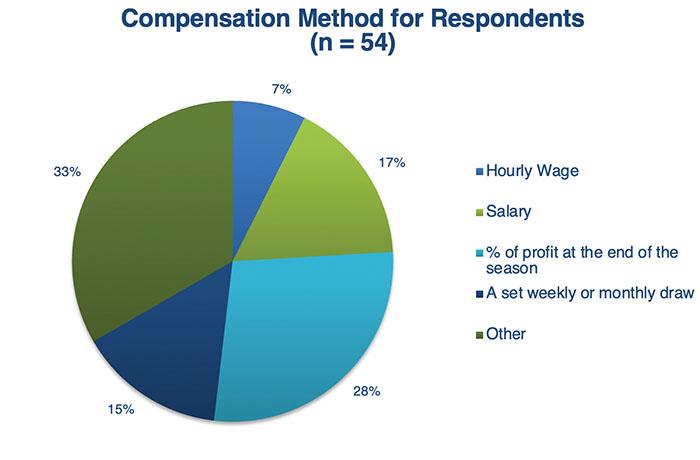
Figure 8 Full Description, Below
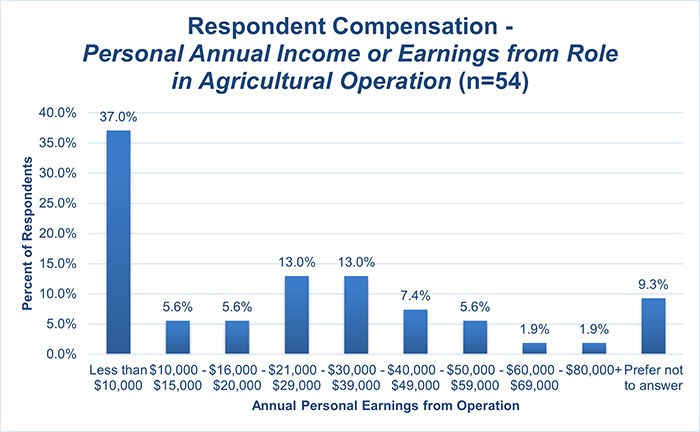
Figure 9 Full Description, Below
Gallery of Tables
- Click on the table to enlarge its view.
- Full descriptions of tables may be found at the bottom of the page: Gallery of Tables Full Descriptions or by clicking on the chart caption’s ‘Full Description’ link.
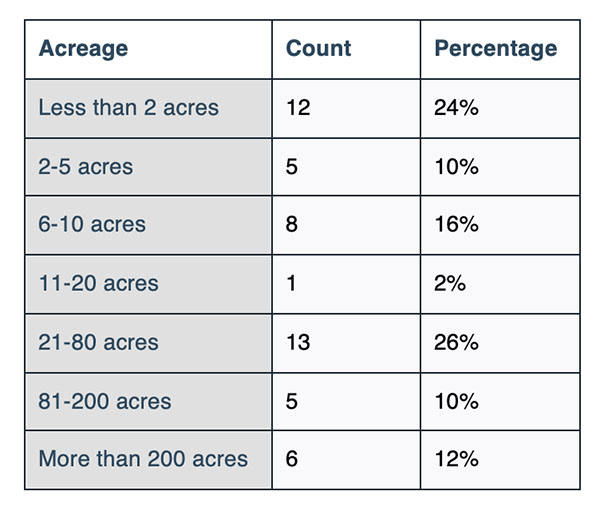
Table 1 Full Description, Below
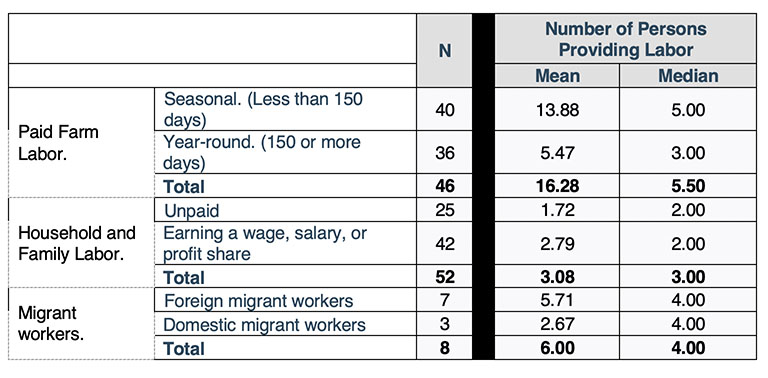
Table 2 Full Description, Below
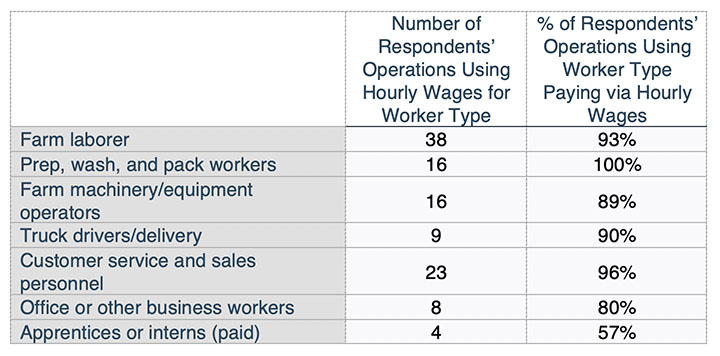
Table 3 Full Description, Below
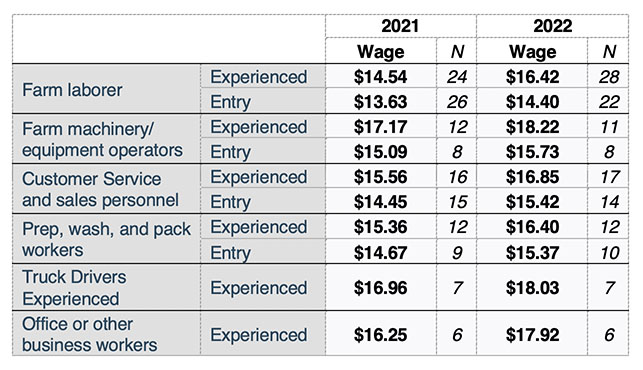
Table 4 Full Description, Below
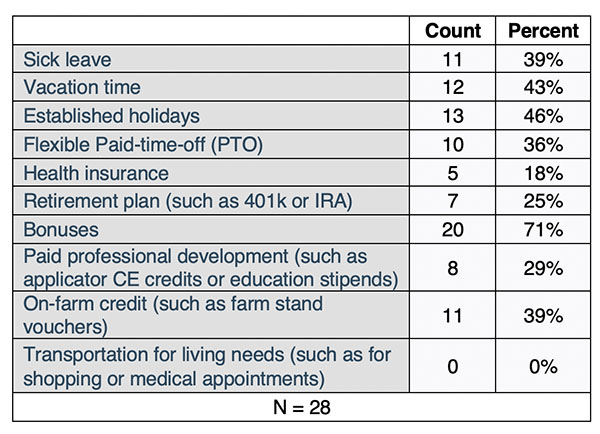
Table 5 Full Description, Below
Full Description of Figures and Tables
Figure 1. Pie chart showing the percentage distribution of responding operations by regions within Maine, based on a sample size of 62. 35% Southern, 25% Central, 20% Coastal, 15% Western, 5% Northern.
Figure 2. Pie chart showing the percentage distribution of responding operations by their organizational structure, based on a sample size of 50. 62% corporation, 30% individual or family operation such as a sole proprietorship, 4% legal partnership, 2% estate or trust, 2% public entity, 0% cooperative.
Figure 3. Bar chart showing the number of operations indicating different production types, based on a sample size of 61. Other vegetables and small fruit – 61 operations; Other agricultural products not listed – 17 operations; Tree fruit and nuts—16 operations; Potatoes – 14 operations; All other livestock—13 operations; Milk and dairy from cows—7 operations; Maple and other tree saps—6 operations; Wild blueberries—4 operations; Aquaculture —3 operations.
Figure 4. Bar chart showing the number of operations indicating other activities undertaken, based on a sample size of 47. Direct marketing—33 operations; On-farm value addition—126 operations; Agritourism—125 operations.
Figure 5. Bar chart showing the number of operations by category of their gross value of sales, based on a sample size of 44. $500,000 to $999,999—8 operations; $250,000 to $499,999—8 operations; $100,000 to $249,999—9 operations; $50,000 to $99,999—6 operations; $10,000 to $49,999—9 operations; Less than $9,999 —4 operations.
Figure 6. Bar chart showing the proportion distribution of responding operations by the number of total operators managing the farm, based on a sample size of 58. 31% have one operator, 43.1% have two operators, 6.9% have three operators, 10.3% have four operators, 1.7% have five operators, 1.7% have six operators, 3.4% have seven operators, 1.7% have eight operators.
Figure 7. Bar chart showing the proportion distribution of responding operations indicating that a different worker role was used in 2021 and/or 2022, based on a sample size of 43.95% farm laborer, 56% customer service and sales personnel, 42% farm machinery or equipment operators, 37% prep, wash, and pack workers, 23% office or other business workers, 23% truck drivers or delivery, 16% apprentices or interns (paid).
Figure 8. Pie chart showing the percentage distribution of respondents by compensation method, based on a sample size of 54. 33% Other, 28% profit share (percent of profit at the end of the season), 17% salary, 15% a set weekly or monthly draw, 7% hourly wage.
Figure 9. Bar chart showing the proportion of respondents by category of their personal annual income or earnings from their role in the agricultural operation, based on a sample size of 54. Less than $10,000—37%; $10,000 to $15,000—5.6%; %; $16,000 to $20,000—5.6%; %; $21,000 to $29,000—3%; $30,000 to $39,000—13%; $40,000 to $49,000—7.4%; $50,000 to $59,000—5.6%; $60,000 to $69,000—1.9%; more than $80,000—1.9%; prefer not to answer—9.3%.
Table 1. Three columns, titled “Acreage”, “Count”, and “Percentage”, present data on the number and proportion of respondents by farm acreage category. Less than 2 acres—12 operations, 24%; 2 to 5 acres—5 operations, 10%; 6 to 10 acres—8 operations,16%; 11 to 20 acres—1 operation, 2%; 21 to 80 acres—13 operations, 26%; 81 to 200 acres—5, 10%; More than 200 acres —6 operations, 12%.
Table 2. A table presenting data on the mean and median number of persons providing labor to the operation within different categories and the number of operations reporting labor by category. Paid Farm Labor, Seasonal (Less than 150 days) —40 reporting, mean of 13.88 and median of 5.00; Paid Farm Labor, Year-round. (150 or more days)—36 reporting, mean of 5.47 and median of 3.00; Paid Farm Labor Total (all categories)— 46 reporting, mean of 16.28 and median of 5.50; Household and Family Labor, Unpaid—25 reporting, mean of 1.72 and median of 2.00; Household and Family Labor, Earning a wage, salary, or profit share—42 reporting, mean of 2.79 and median of 2.00; Household and Family Labor Total (all categories)—52 reporting, mean of 3.08 and median of 3.00; Foreign migrant workers—7 reporting, mean of 5.71 and median of 4.00; Domestic migrant workers—3 reporting, mean of 2.67 and median of 4.00; Migrant Workers Total (all categories)—8 reporting, mean of 6.00 and median of 4.00.
Table 3. A table presenting data in two columns “Number of respondent operations using hourly wages for worker type” and “percent of respondent operations using worker type paying via hourly wages”. Farm laborer—38 operations, 93%; Prep, wash, and pack workers – 16 operations, 100%; Farm machinery/equipment operators—16 operations, 89%; Truck drivers/delivery—9 operations, 90%; Customer service and sales personnel—23, 96%; Office or other business workers—8, 80%; Apprentices or interns (paid)—4 operations, 57%.
Table 4. A table presenting data on the average hourly wage and sample size by worker role and experience level, presented in two panels – one panel for 2021 and one panel for 2022. Data for the year 2021: Farm laborer—Experienced, average wage $14.54 over 24 observations; Farm Laborer—Entry average wage $13.63 over 26 observations; Farm machinery/ equipment operators—Experienced, average wage $17.17 over 12 observations; Farm machinery/ equipment operators—Entry, average wage $15.09 over 8 observations; Customer service and sales personnel—Experienced, average wage $15.56 over 16 observations; Customer service and sales personnel—Entry, average wage $14.45 over 15 observations; Prep, wash, and pack workers—Experienced, average wage $15.36 over 12 observations; Prep, wash, and pack workers—Entry, average wage $14.67 over 9 observations; Truck drivers—Experienced, average wage $16.96 over 7 observations; Office or other business workers—Experienced, average wage $16.25 over 6 observations. Data for the year 2022: Farm laborer—Experienced, average wage $16.42 over 28 observations; Farm laborer—Entry, average wage $14.40 over 22 observations; Farm machinery/ equipment operators—Experienced, average wage $18.22 over 11 observations; Farm machinery/ equipment operators—Entry, average wage $15.73 over 8 observations; Customer Service and sales personnel—Experienced, average wage $16.85 over 17 observations; Customer Service and sales personnel—Entry, average wage $15.42 over 14 observations; Prep, wash, and pack workers—Experienced, average wage $16.40 over 12 observations; Prep, wash, and pack workers—Entry, average wage $15.37 over 10 observations; Truck Drivers—Experienced, average wage $18.03 over 7 observations; Office or other business workers—Experienced, average wage $17.92 over 6 observations.
Table 5. A table presenting data on the number and proportion of respondent operations indicating they offer different worker benefit types, based on a sample size of 28. Sick leave 11 operations, 39%; Vacation time 12 operations, 43%; Established holidays 13 operations, 46%; Flexible Paid-time-off (PTO) 10 operations, 36%; Health insurance 5 operations, 18%; Retirement plan (such as 401k or IRA) 7 operations, 25%; Bonuses 20 operations, 71%; Paid professional development (such as applicator CE credits or education stipends) 8 operations, 29%; On-farm credit (such as farm stand vouchers) 11 operations, 39%; Transportation for living needs (such as for shopping or medical appointments) 0 operations, 0%.
Information in this publication is provided purely for educational purposes. No responsibility is assumed for any problems associated with the use of products or services mentioned. No endorsement of products or companies is intended, nor is criticism of unnamed products or companies implied.
© 2024
Call 800.287.0274 (in Maine), or 207.581.3188, for information on publications and program offerings from University of Maine Cooperative Extension, or visit extension.umaine.edu.
In complying with the letter and spirit of applicable laws and pursuing its own goals of diversity, the University of Maine System does not discriminate on the grounds of race, color, religion, sex, sexual orientation, transgender status, gender, gender identity or expression, ethnicity, national origin, citizenship status, familial status, ancestry, age, disability physical or mental, genetic information, or veterans or military status in employment, education, and all other programs and activities. The University provides reasonable accommodations to qualified individuals with disabilities upon request. The following person has been designated to handle inquiries regarding non-discrimination policies: Director of Equal Opportunity, 5713 Chadbourne Hall, Room 412, University of Maine, Orono, ME 04469-5713, 207.581.1226, TTY 711 (Maine Relay System).