2012 Organic Spring Wheat Variety Trials – Maine & Vermont
2012 Organic Spring Wheat Variety Trial Results — Maine & Vermont (PDF)
Ellen Mallory, Heather Darby, Thomas Molloy, Erica Cummings, Hannah Griffin
Bread wheat is a new crop option for farmers in Northern New England due to increasing consumer demand for locally grown food. In 2010, the University of Maine and University of Vermont began a series of trials evaluating varieties of hard red wheat to identify those that perform well in northern New England under organic production. This publication presents results for spring wheat varieties tested in 2012, and for select data, results from 2010 and 2011, as well. Separate publications of prior years’ full results are available for spring and winter wheat.
This collaborative work was funded by a grant from the USDA Organic Agriculture Research and Extension Initiative to improve bread wheat production in our region.
Table 1. Spring wheat varieties planted in ME, VT, and NY in 2012.
| † HR = hard red, SW = soft white, AD = amber durum ‡Year of release not always available § To be released in 2013 under the name “Yorkton” # Abbreviations: AAFC = Agric. & Agri-Food Canada, ACRS = Agric. Canada Rsrch. Station, FBC = Farmer Breeder Club, MAES – Minnesota Agric. Expt. Station NDAES = North Dakota Agric. Expt. Station, NDSU – North Dakota State Univ., NPSAS = North Plains Sustainable Agric. Society, PEI = Prince Edward Island, SDAES = South Dakota Agric. Expt. Station, WSU = Washington State Univ. |
|||
| Variety | Type† | Origin and Year of Release‡ | Seed Source |
|---|---|---|---|
| 07SW04§ | HR | Semican, Canada, 2013 | Semican, Canada |
| Ada | HR | MAES, 2006 | Albert Lea Seed House, MN |
| Barlow | HR | NDAES, 2009 | ND Foundation Seed |
| AC Barrie | HR | AAFC#, Saskatchewan, 1994 | Semences RDR, Quebec |
| Brick | HR | SDAES, 2000 | ND Foundation Seed |
| Faller | HR | NDAES, 2007 | Albert Lea Seed House, MN |
| FBC Dylan | HR | NPSAS/FBC, 2006 | Research farm saved seed |
| Fortuna | HR | NDSU, 1966 | O.J. Lougheed, WA |
| Glenn | HR | NDAES, 2005 | ND Foundation Seed |
| Helios | HR | AAFC, Saskatchewan, 2007 | Research farm saved seed |
| Jenna | HR | Agripro Syngenta, 2009 | Research farm saved seed |
| Kaffé | SW | Semican, Canada | Research farm saved seed |
| Kyle | AD | AAFC, Saskatchewan, 1984 | O.J. Lougheed, WA |
| McKenzie | HR | SWP/ARD, 1997 | Semican, Canada |
| Magog | HR | Semican, Canada, 2009 | Semican, Canada |
| Oklee | HR | MAES, 2003 | MN Foundation Seed |
| RB07 | HR | MAES, 2007 | MN Foundation Seed |
| Red Fife | HR | Heritage var., ca. 1860 | Ehnes Org. Seed Cleaning Ldt |
| Roblin | HR | ACRS, Winnipeg, 2001 | Research farm saved seed |
| Sabin | HR | MAES, 2009 | MN Foundation Seed |
| Steele | HR | NDAES, 2004 | Albert Lea Seed House, MN |
| Superb | HR | AAFC, Winnipeg, 2001 | Oliver Seeds, VT |
| Sy Soren | HR | Agripro Syngenta, 2011 | Albert Lea Seed House, MN |
| Tom | HR | MAES, 2008 | MN Foundation Seed |
| Ulen | HR | MAES, 2005 | MN Foundation Seed |
| AC Walton | HR | AAFC, PEI, 1995 | Grands Falls Milling, NB |
TRIAL DESIGN AND VARIETIES
Trials were established at four locations in the Northeast: the University of Maine Smith Farm in Old Town, ME; Rainbow Valley Farm, a commercial organic dairy farm in Sidney, ME; the Borderview Research Farm in Alburgh, VT; and Willsboro Research Farm in Willsboro, NY. The experimental design was a randomized complete block with four replications, which means that each variety was planted in four separate plots at each location. The spring wheat varieties that were evaluated are listed in Table 1. All but two are hard red types. Hard red wheat is preferred for bread flour.
WEATHER CONDITIONS
Seasonal precipitation and temperature were recorded at or near trial locations (Table 2). The Alburgh, Old Town, and Willsboro locations had weather stations in close proximity to the trial sites, while the Sidney location had a weather station within 8 miles. Early spring conditions (March and April) were substantially warmer and drier than normal for all locations, allowing for early planting. The VT and NY locations also experienced above average temperatures during the middle and later part of the growing season. The two ME sites had above average precipitation prior to and during wheat flowering (June) and experienced drier and warmer than average conditions during grain fill and harvest (July to early August).
Table 2. Precipitation, temperature, and growing degree days at the test sites. †
| Location | March | April | May | June | July | August | Total |
|---|---|---|---|---|---|---|---|
| Old Town, ME | |||||||
| Total Precipitation (in.) | 1.95 | 3.68 | 4.30 | 6.03 | 0.99 | 2.81 | — |
| Departure from Normal (in.) | -2.10 | -0.07 | 0.46 | 1.98 | -2.57 | -0.50 | — |
| Average Temperature (°F) | 36.1 | 43.9 | 54.8 | 60.9 | 67.9 | 68.5 | — |
| Departure from Normal (°F) | 6.6 | 2.4 | 2.3 | -0.6 | 0.4 | 3.0 | — |
| Growing Degree Days§ | 126 | 356 | 707 | 867 | 1114 | 1096 | 4266 |
| Waterville, ME | |||||||
| Total Precipitation (in.) | 1.71 | 3.34 | 3.48 | ‡ | 0.57 | 3.69 | — |
| Departure from Normal (in.) | -1.75 | -0.14 | -0.31 | — | -2.98 | 0.24 | — |
| Average Temperature (°F) | 37.3 | 45.6 | 56.7 | 62.8 | 71.6 | 70.7 | — |
| Departure from Normal (°F) | 5.3 | 2.6 | 2.2 | -1.2 | 2.1 | 2.7 | — |
| Growing Degree Days§ | 162 | 408 | 766 | 924 | 1227 | 1202 | 4689 |
| Alburgh, VT | |||||||
| Total Precipitation (in.) | 1.5 | 2.64 | 3.90 | 3.22 | 3.78 | — | — |
| Departure from Normal (in.) | -0.8 | -0.18 | 0.45 | -0.47 | -0.37 | — | — |
| Average Temperature (°F) | 39.7 | 44.9 | 60.5 | 67.0 | 71.4 | — | — |
| Departure from Normal (°F) | 8.60 | 0.10 | 4.10 | 1.20 | 0.80 | — | — |
| Growing Degree Days§ | 331 | 396 | 884 | 1046 | 1221 | — | 3878 |
| Willsboro, NY | |||||||
| Total Precipitation (in.) | 1.0 | 2.8 | 4.4 | 3.2 | 3.8 | 2.9 | — |
| Departure from Normal (in.) | -1.2 | 0.0 | 0.9 | -0.5 | -0.4 | -1.0 | — |
| Average Temperature (°F) | 43.2 | 46.1 | 61.6 | 67.8 | 73.0 | 72.0 | — |
| Departure from Normal (°F) | 12.1 | 1.3 | 5.2 | 2.0 | 2.4 | 3.2 | — |
| Growing Degree Days§ | 411 | 411 | 435 | 917 | 1072 | 1271 | 4517 |
| † Based on National Weather Service data from cooperative observer stations in close proximity to field trials available at http://www.ncdc.noaa.gov/crn/report. Historical averages are for 30 years (1981-2010) available at http://cdo.ncdc.gov/cgi-bin/climatenormals.pl ‡ Monthly average not availble due to missing data points. § Base 32°F |
|||||||
CULTURAL PRACTICES
Plots were managed following practices similar to those used by farmers in New England (see Table 3).
University of Maine Smith Farm – Old Town, ME – The previous crop in this field was silage corn. The site was moldboard plowed on April 4. Solid dairy manure was spread at a rate of 25 tons/acre on April 10 and immediately incorporated with a Perfecta harrow. Plots were planted on April 12 with an Almaco cone seeder at a rate of 51 live seeds/ft2. The plots were top-dressed on June 8 with 100 lbs/acre of Chilean nitrate. The plots were harvested on August 7 with a Wintersteiger Classic plot combine. Harvest area was 4′ x 33′.
Rainbow Valley Farm – Sidney, ME – The previous crop in this field was high moisture ear corn. The site was moldboard plowed on April 5. Solid dairy manure was then applied at a rate of 20 ton/acre and immediately incorporated with a disk harrow. On April 13, the field was spring-tooth harrowed and planted on April 14 with an Almaco cone seeder at a rate of 51 seeds/ft2. The plots were harvested on July 31 with a Wintersteiger Classic plot combine. Harvest area was 4′ x 33′.
Borderview Research Farm – Alburgh, VT – The previous crop in this field was no-till sunflowers/grass sod. The field was disked and spike-tooth harrowed in March prior to planting. Plots were seeded on April 6 using a Kincaid Cone Seeder at a rate of 33 live seeds/ft2. The plots were harvested on July 31 with an Almaco SPC50 plot combine. Harvest area was 5′ x 20′.
Willsboro Research Farm – Willsboro, NY – The previous crop in this field was winter wheat. A 3-year old timothy/alfalfa sod was plowed in August 2010 prior to planting of the winter wheat. In April 2012, the field was disked and spike-tooth harrowed. Plots were seeded on April 13 using a custom eight-row cone seeder. The plots were seeded at a rate of 33 live seeds/ft2. The plots were harvested on August 8 with a Hege plot combine. Harvest area was 4′ x 13′.
Table 3. General plot management of the 2012 spring wheat trials.
| University of Maine Smith Farm Old Town, ME | Rainbow Valley Farm Sidney, ME | Borderview Research Farm Alburgh, VT | Willsboro Research Farm Willsboro, NY | |
|---|---|---|---|---|
| Soil type |
Stetson fine sandy loam, |
Buxton silt loam | Benson rocky silt loam |
Kingsbury silt clay loam |
| Previous crop |
Silage corn |
High moisture ear corn | Sunflowers/Grass sod |
Winter wheat |
| Tillage operations |
Moldboard plow, perfecta harrow |
Moldboard plow, disk harrow, spring tooth harrow | Fall plow, spring disk & spike-toothed harrow |
Fall plow, spring disk & spike-toothed harrow |
| Fertility source |
Solid dairy manure (25 tons/acre) |
Solid dairy manure (20 tons/acre) | Grass sod |
Timothy/Alfalfa sod |
| Estimated available nitrogen (lbs/acre) | 90 | 55‡ | 65-75 |
65-75 |
| Seeding rate (live seeds/ft2)† | 51 | 51 | 33 |
33 |
| Planting date | 4/12/12 | 4/14/12 | 4/6/12 |
4/13/12 |
| Harvest date | 8/7/12 | 7/31/12 | 7/31/12 |
8/8/12 |
| Row spacing (in) | 6.5 | 6.5 | 6 |
6 |
| Harvest area |
4′ x 33′ |
4′ x 33′ | 5′ x 20′ |
4′ x 13′ |
| † The target seeding rate was calculated to achieve the same plant density for each variety. This translated to 150-273 lbs seed/acre (average 191), and depended on the seed weight and germination of each variety. ‡ The intended rate of N application was about 70 lbs/acre but the N content of the manure used was lower than usual for this farm. |
||||
MEASUREMENTS AND METHODS
Flowering date was recorded for each variety where possible. Plant heights were measured at physiological maturity in ME and at harvest in VT and NY. Prior to harvest, the incidence and severity of lodging was noted for each variety.
All varieties were harvested on the same day at each site once the latest maturing variety threshed free in hand tests and weather and logistics allowed. Following harvest, grain was cleaned with a small Clipper cleaner and weights were recorded. Harvest moisture and test weights were determined using DICKEY-john GAC 2100 grain moisture meters.
Subsamples were ground into flour using a Perten LM3100 Laboratory Mill. The ground material was then analyzed for crude protein, falling number, and mycotoxin levels. Protein content was determined using a Perten Inframatic 8600 Flour Analyzer. Most commercial mills target 12-14% protein. Falling number was determined on a Perten FN 1500 Falling Number Machine. The falling number is related to the level of sprout damage that has occurred in the grain due to enzymatic activity. It is measured as the time it takes, in seconds, for a plunger to fall through a slurry of flour and water to the bottom of the tube. Falling numbers less than 200 seconds indicate high enzymatic activity and poor quality wheat. Concentrations of deoxynivalenol (DON), a mycotoxin produced by the fungus that causes Fusarium head blight, were determined using the Veratox DON 2/3 Quantitative test from the NEOGEN Corp. This test has a detection range of 0.5 to 5 ppm. Samples with DON values greater than 1 ppm are considered unsuitable for human consumption.
All data were analyzed using mixed model Analysis of Variance (ANOVA) in which replicates were considered random effects. The LSD procedure was used to detect whether differences among variety averages were statistically significant and was only conducted if the ANOVA F-test was significant (P<0.05) (see below for an explanation of significant difference). There were significant differences between the locations for most parameters, so results from each location are reported independently.
What Is a Significant Difference?
Variations in yield and quality can occur not only due to genetics but also due to variability in soil, weather, and other growing conditions. Statistical analysis makes it possible to determine whether a difference between two varieties is real or whether it might have occurred due to other variability in the field. The Least Significant Difference (LSD) is the minimum difference needed between two averages to consider them statistically different. LSDs at the 5% level of probability are presented at the bottom of each table for each measure. Where the difference between two varieties within a column is equal to or greater than the LSD value, you can be sure in 19 out of 20 chances that there is a real difference between the two varieties.
In the example below, variety A is significantly different from variety C because the difference between their yields (1454) is greater than the LSD value (889). Variety A is not significantly different from variety B because the difference between their yields (725) is less than the LSD value (889).
Throughout this bulletin, the greatest value at each site for each measure is indicated with an underline and bold type. Varieties that are not significantly different from the greatest value are also in bold type. Using the example below, variety C had the highest measured yield (underlined and bolded) but it was not significantly different than the yield of variety B (bolded).
Example Table
| Variety | Yield | ||||||
|
|
||||||
| LSD | 889 |
RESULTS
Growth and Development
Due to the warm, dry weather in March, all locations were planted two to three weeks earlier than what is considered normal for the region. This allowed for good early growth, limited weed pressure, and good to excellent yields and overall quality.
Flowering occurred early in 2012 (Table 4), on average two weeks earlier than in 2011. Brick and Roblin were the first varieties to flower at all three locations; AC Walton was one of the latest.
Plant heights ranged from 28 to 51 inches (Table 4). Red Fife was the tallest variety, while RB07, Jenna and Sabin were the shortest. Ada and Sy Soren, planted at the Alburgh and Willsboro sites, were also among the shortest varieties.
Lodging occurred in some varieties. Helios and Sabin had some of the highest lodging rates at the Alburgh site, while Fortuna and Kyle experienced lodging at the Willsboro location. At Old Town, Red Fife experienced lodging, which may have been exacerbated by high fertility rates.
Table 4. Estimated wheat flowering date and plant height at Old Town, ME, Alburgh, VT, and Willsboro, NY.
| Variety | Estimated Flowering Date | Plant Height (inches) | ||||
|---|---|---|---|---|---|---|
| Old Town, ME | Alburgh, VT | Willsboro, NY | Old Town, ME | Alburgh, VT | Willsboro, NY | |
| 07SW04 | 21-Jun | <18-Jun | <22-Jun | 40 | 41 | 38 |
| Ada | — | <18-Jun | <22-Jun | — | 30 | 31 |
| Barlow | 21-Jun | <18-Jun | <13-Jun | 38 | 36 | 35 |
| AC Barrie | 21-Jun | <25-Jun | <22-Jun | 41 | 40 | 37 |
| Brick | 19-Jun | <11-Jun | <13-Jun | 40 | 39 | 36 |
| Faller | 21-Jun | <18-Jun | <22-Jun | 38 | 34 | 34 |
| FBC Dylan | 20-Jun | <18-Jun | <22-Jun | 40 | 37 | 32 |
| Fortuna | — | <18-Jun | <22-Jun | — | 37 | 41 |
| Glenn | 20-Jun | <18-Jun | <22-Jun | 41 | 38 | 36 |
| Helios | — | <18-Jun | <22-Jun | — | 39 | 40 |
| Jenna | 23-Jun | <25-Jun | <22-Jun | 34 | 32 | 28 |
| Kaffé† | — | <25-Jun | <22-Jun | — | 45 | 38 |
| Kyle† | — | <18-Jun | <22-Jun | — | 42 | 41 |
| McKenzie | 22-Jun | <18-Jun | <22-Jun | 44 | 36 | 38 |
| Magog | 22-Jun | <25-Jun | <22-Jun | 44 | 42 | 40 |
| Oklee | 22-Jun | <18-Jun | <13-Jun | 38 | 34 | 31 |
| RB07 | 20-Jun | <18-Jun | <22-Jun | 32 | 33 | 32 |
| Red Fife | 24-Jun | <25-Jun | <22-Jun | 51 | 47 | 42 |
| Roblin | 19-Jun | <11-Jun | <13-Jun | 44 | 41 | 38 |
| Sabin | 21-Jun | <18-Jun | <22-Jun | 35 | 35 | 30 |
| Steele | 21-Jun | <18-Jun | <22-Jun | 38 | 35 | 32 |
| Superb | 21-Jun | <25-Jun | <22-Jun | 37 | 38 | 35 |
| Sy Soren | — | <18-Jun | <22-Jun | — | 31 | 29 |
| Tom | 20-Jun | <18-Jun | <22-Jun | 37 | 34 | 33 |
| Ulen | 21-Jun | <11-Jun | <13-Jun | 38 | 35 | 31 |
| AC Walton | 24-Jun | <25-Jun | <28-Jun | 45 | 43 | 39 |
| † Variety is not a hard red type. | ||||||
Yield
Yields for 2012, 2011, and 2010 are presented in Table 5. Yields from 2012 are also presented in graphical form in Figure 1 to easily compare varieties.
A typical yield for organic hard red spring wheat grown in this region is about 2,000 to 2,500 lbs/acre (Matt Williams, personal communication, 2011). Alburgh, Old Town, and Willsboro all produced yields well above average while yields at the Sidney location were more in line with typical yields. Over all of the locations in 2012, Faller, Jenna, Magog, Tom, and AC Walton were among the highest yielding varieties, whereas Red Fife, Roblin, and Glenn were among the lowest yielding varieties. Faller and Tom have been among the higher yielding varieties for all sites over the three years of trialing.
Table 5. Yield of spring wheat, ME, VT, and NY.
| Variety | Yield at 13.5% Moisture (lbs/acre)† | |||||||||||
|---|---|---|---|---|---|---|---|---|---|---|---|---|
| Old Town, ME | Sidney, ME | Alburgh, VT | Willsboro, NY | |||||||||
| 2012 | 2011 | 2010 | 2012 | 2011 | 2010 | 2012 | 2011 | 2010 | 2012 | 2011 | 2010 | |
| 07SW04 | 3963 | 2560 | — | 2140 | 2502 | — | 3592 | 799 | — | 3263 | 933 | — |
| Ada | — | 2917 | 2098 | — | 3030 | 2382 | 3733 | 992 | 1011 | 3488 | 1579 | 2215 |
| Barlow | 4324 | 2922 | — | 2530 | 3170 | — | 3609 | 978 | — | 3989 | 1604 | — |
| AC Barrie | 3796 | 2578 | 2077 | 2221 | 2606 | 1987 | 3022 | 711 | 845 | 2755 | 736 | 1864 |
| Brick | 4450 | 2748 | — | 2143 | 2763 | — | 3578 | 1102 | — | 3582 | 1744 | — |
| Faller | 5086 | 3221 | 3575 | 2166 | 3653 | 3260 | 3998 | 965 | 1580 | 3981 | 1634 | 3235 |
| FBC Dylan | 4588 | 2900 | 2987 | 2587 | 2945 | 2566 | 3168 | 796 | 1286 | 3227 | 1101 | 2202 |
| Fortuna | — | — | — | — | — | — | 2706 | — | — | 3319 | — | — |
| Glenn | 3948 | 2644 | 2334 | 1860 | 2695 | 2200 | 3260 | 730 | 1063 | 3864 | 1863 | 2001 |
| Helios | — | — | — | — | — | — | 3156 | 1353 | 1148 | 3976 | 1165 | 2016 |
| Jenna | 4781 | 3338 | — | 2861 | 3355 | — | 3865 | 1168 | — | 3453 | 1437 | — |
| Kaffé§ | — | — | — | — | — | — | 3919 | 1307 | 2009 | 3568 | 1153 | 2653 |
| Kyle§ | — | — | — | — | — | — | 2843 | — | — | 3687 | — | — |
| McKenzie | 4135 | 2218 | — | 2127 | 2508 | — | 2191 | 847 | 1146 | 3472 | 1593 | 2527 |
| Magog | 4779 | 2695 | 2396 | 2849 | 3257 | 2765 | 4048 | 1013 | 1281 | 3351 | 500 | 2582 |
| Oklee | 4361 | 3134 | 3353 | 2291 | 2771 | 2943 | 3131 | 813 | 1130 | 2757 | 1190 | 2147 |
| RB07 | 4115 | 3047 | 2766 | 2303 | 3281 | 2716 | 3776 | 695 | 1113 | 3774 | 1526 | 2136 |
| Red Fife | 3368 | 2278 | 2036 | 2119 | 2529 | 1993 | 2604 | 788 | 1083 | 2937 | 477 | 2325 |
| Roblin | 3921 | 2289 | 2523 | 2065 | 2793 | 2071 | 3026 | 758 | 1097 | 3455 | 686 | 1838 |
| Sabin | 4393 | 2692 | 2986 | 1911 | 3058 | 2920 | 2666 | 940 | 1247 | 2882 | 863 | 2599 |
| Steele | 4653 | 2759 | 2829 | 1777 | 3110 | 2643 | 3367 | 749 | 1222 | 3260 | 882 | 2183 |
| Superb | 4440 | 2650 | 3168 | 2190 | 2996 | 2807 | 3658 | 1226 | 1297 | 3363 | 1536 | 2429 |
| Sy Soren | — | — | — | — | — | — | 4294 | — | — | 3513 | — | — |
| Tom | 4488 | 3087 | 3684 | 3082 | 3179 | 3050 | 4159 | 1267 | 1298 | 3600 | 1627 | 1980 |
| Ulen | 4358 | 2816 | 2969 | 2142 | 2755 | 2679 | 3755 | 900 | 1277 | 2817 | 1532 | 1916 |
| AC Walton | 4919 | 2736 | 2699 | 2377 | 3001 | — | 3339 | 847 | 1222 | 3669 | 534 | 2872 |
| Site Average | 4343 | 2773 | 2780 | 2287 | 2950 | 2599 | 3402 | 945 | 1229 | 3423 | 1213 | 2301 |
| LSD (0.05) | 588 | 417 | 453 | 661 | 561 | 515 | 592 | 359 | 473 | 489 | 525 | 352 |
| † All varieties at each site were harvested on the same day. ‡ For all measures, bolded values are not significantly different from the highest value, which is indicated with an underline. § Variety is not a hard red type. |
||||||||||||
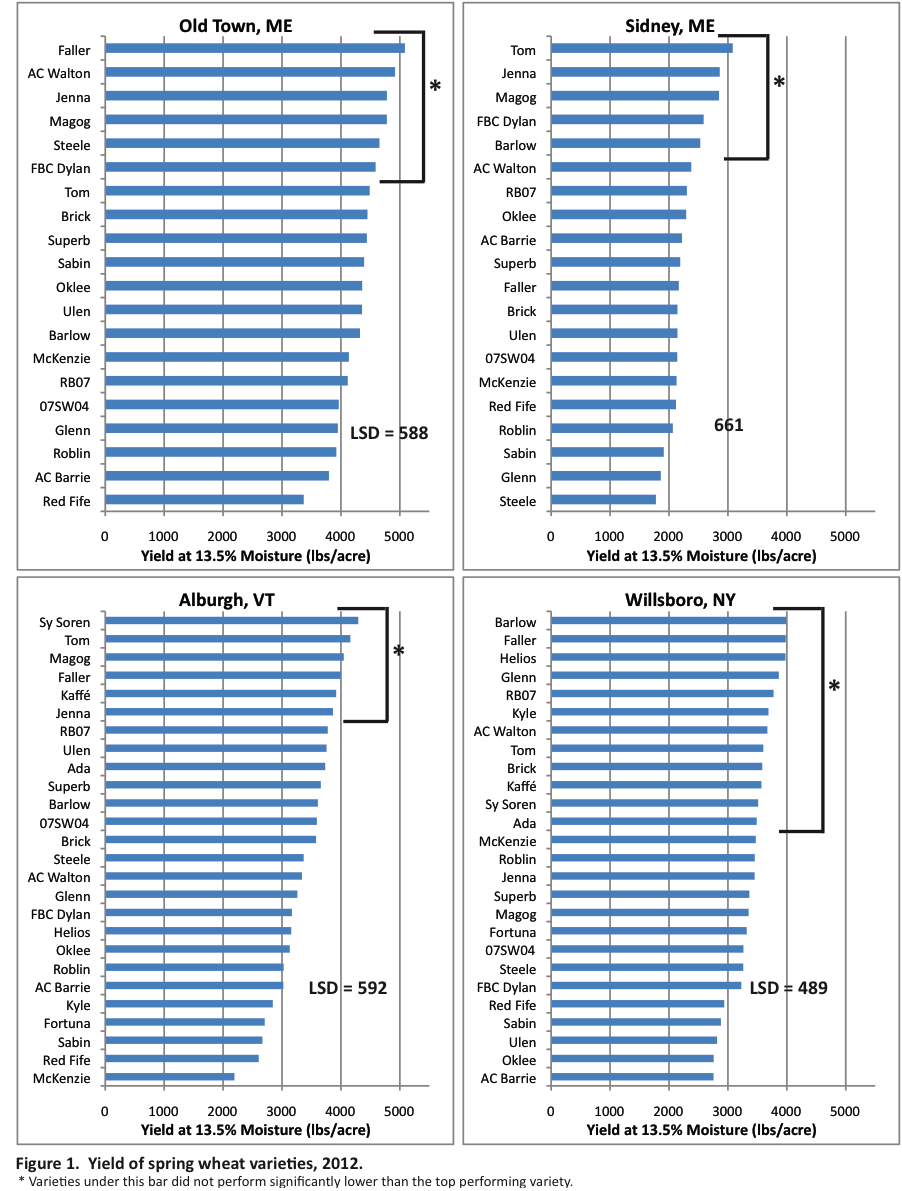
Figure 1 Alternative Text (Word)
Wheat Quality
Commercial mills use a variety of measurements to determine if a particular lot of wheat is suitable for bread flour, including grain protein, test weight, falling number, and mycotoxin (DON) concentration.
Crude protein levels were good in 2012, with levels at or above 12% at all sites (Table 7 and Figure 2). Roblin, Glenn, and the experimental variety 07SW04 had the highest protein levels across all locations. AC Walton, FBC Dylan, and Faller had the lowest protein levels in ME, in NY and VT, Kaffé had the lowest protein levels.
The standard test weight for wheat is 58 lbs/bushel, with an acceptable range of 56-60 lbs/bushel. In 2012, most varieties had good to excellent test weights, with the exception of Red Fife and AC Walton in Sidney. Glenn, Brick, Barlow, and Tom had the highest test weights across locations (Table 6).
Falling number values were well above the acceptable level (250 seconds) for all of the varieties grown at each location with the exception of Ulen at the Old Town site (Table 6).
Fusarium head blight, which produces the mycotoxin deoxynivalenol (DON), is a disease of major concern for wheat growers in northern New England. It primarily infects the plant during flowering and is favoredby cool, humid weather. The United States Food and Drug Administration has established a maximum DON guideline of 1 ppm for finished human products. Millers may accept grain with slightly higher DON levels because, through cleaning, they can remove some of the infected grain and reduce DON levels. DON levels were low at the Alburgh and Willsboro locations (Table 8), with only one variety, Kyle, testing at 1 ppm. In Maine, DON levels were moderate compared to previous years, with half of the varieties testing below 1 ppm, and variety performance being fairly consistent among locations. The varieties Jenna and Superb had the highest levels in 2012 at both Maine sites, as well as in prior years. Varieties that have consistently shown lower than average DON levels over the three years of these trials include AC Barrie, Faller, Glenn, Sabin and the experimental variety 07SW04.
Table 6. Test weight and Falling number of spring wheat in ME, VT, and NY.
| Variety | Test Weight (lbs/bu) | Falling Number at 14% Moisture (seconds) | ||||||
|---|---|---|---|---|---|---|---|---|
| Old Town, ME | Sidney, ME | Alburgh, VT | Willsboro, NY | Old Town, ME | Sidney, ME | Alburgh, VT | Willsboro, NY | |
| 2012 | 2012 | |||||||
| 07SW04 | 61 | 59 | 61 | 59 | 479 | 500 | 461 | 462 |
| Ada | — | — | 62 | 60 | — | — | 464 | 481 |
| Barlow | 64 | 60 | 61 | 60 | 398 | 371 | 399 | 395 |
| AC Barrie | 61 | 59 | 61 | 59 | 491 | 461 | 453 | 447 |
| Brick | 63 | 60 | 62 | 59 | 423 | 437 | 410 | 357 |
| Faller | 62 | 58 | 61 | 58 | 453 | 440 | 432 | 417 |
| FBC Dylan | 62 | 59 | 61 | 59 | 456 | 486 | 479 | 476 |
| Fortuna | — | — | 59 | 59 | — | — | 408 | 440 |
| Glenn | 64 | 60 | 64 | 60 | 422 | 403 | 379 | 393 |
| Helios | — | — | 60 | 58 | — | — | 485 | 465 |
| Jenna | 61 | 57 | 61 | 58 | 472 | 411 | 422 | 371 |
| Kaffé§ | — | — | 60 | 57 | — | — | 374 | 322 |
| Kyle§ | — | — | 60 | 59 | — | — | 467 | 452 |
| McKenzie | 61 | 58 | 61 | 57 | 470 | 442 | 421 | 407 |
| Magog | 61 | 58 | 61 | 59 | 520 | 520 | 464 | 474 |
| Oklee | 63 | 59 | 61 | 58 | 474 | 475 | 425 | 432 |
| RB07 | 61 | 59 | 60 | 57 | 394 | 421 | 401 | 377 |
| Red Fife | 60 | 54 | 61 | 59 | 372 | 383 | 377 | 359 |
| Roblin | 60 | 58 | 59 | 58 | 467 | 434 | 389 | 382 |
| Sabin | 61 | 58 | 59 | 57 | 458 | 496 | 468 | 483 |
| Steele | 62 | 58 | 62 | 58 | 392 | 423 | 410 | 408 |
| Superb | 60 | 58 | 61 | 58 | 395 | 501 | 433 | 400 |
| Sy Soren | — | — | 62 | 59 | — | — | 432 | 430 |
| Tom | 62 | 59 | 62 | 59 | 445 | 449 | 450 | 448 |
| Ulen | 60 | 58 | 61 | 59 | 295 | 340 | 393 | 375 |
| AC Walton | 60 | 54 | 57 | 57 | 444 | 430 | 434 | 431 |
| Site Average | 61 | 58 | 61 | 58 | 436 | 441 | 428 | 419 |
| LSD (0.05) | 0.49 | 1.24 | 0.9 | 1.3 | — | — | 29.0 | 31.8 |
| † All varieties at each site were harvested on the same day. ‡ For all measures, bolded values are not significantly different from the highest value, which is indicated with an underline. §Variety is not a hard red type. |
||||||||
Table 7. Protein concentration of spring wheat in ME, VT, and NY.
| Variety | Crude Protein at 12% Mositure (%) | |||||||||||
|---|---|---|---|---|---|---|---|---|---|---|---|---|
| Old Town, ME | Sidney, ME | Alburgh, VT | Willsboro, NY | |||||||||
| 2012 | 2011 | 2010 | 2012 | 2011 | 2010 | 2012 | 2011 | 2010 | 2012 | 2011 | 2010 | |
| 07SW04 | 14.1 | 11.7 | — | 14.7 | 13.6 | — | 15.0 | 13.3 | — | 14.3 | 16.6 | — |
| Ada | — | 11.4 | 16.0 | — | 13.3 | 12.6 | 13.0 | 12.3 | 14.6 | 12.5 | 14.2 | 15.0 |
| Barlow | 13.0 | 11.3 | — | 13.4 | 13.5 | — | 14.1 | 13.0 | — | 12.9 | 15.3 | — |
| AC Barrie | 14.0 | 11.6 | 16.0 | 14.3 | 13.1 | 14.5 | 15.1 | 13.3 | 16.8 | 12.7 | 15.3 | 16.1 |
| Brick | 13.2 | 10.5 | — | 13.0 | 12.1 | — | 14.0 | 13.8 | — | 12.7 | 15.5 | — |
| Faller | 10.9 | 10.8 | 14.9 | 11.4 | 11.0 | 12.2 | 12.9 | 11.0 | 14.4 | 11.4 | 13.9 | 14.4 |
| FBC Dylan | 12.3 | 10.5 | 14.6 | 11.3 | 11.2 | 11.7 | 13.6 | 12.3 | 13.8 | 11.4 | 13.8 | 14.1 |
| Fortuna | — | — | — | — | — | — | 14.1 | — | — | 12.7 | — | — |
| Glenn | 14.7 | 12.0 | 16.4 | 13.8 | 13.8 | 15.4 | 14.9 | 12.5 | 16.0 | 14.1 | 15.6 | 17.0 |
| Helios | — | — | — | — | — | — | 14.3 | 13.8 | 16.0 | 12.6 | 14.3 | 17.3 |
| Jenna | 13.3 | 10.9 | — | 13.0 | 11.7 | — | 13.9 | 13.0 | — | 11.7 | 13.9 | — |
| Kaffé‡ | — | — | — | — | — | — | 12.0 | 11.3 | 13.7 | 11.1 | 12.9 | 14.2 |
| Kyle‡ | — | — | — | — | — | — | 13.7 | — | — | 11.8 | — | — |
| McKenzie | 12.7 | 10.9 | — | 12.2 | 11.8 | — | 13.1 | 11.8 | 15.3 | 11.9 | 14.7 | 15.3 |
| Magog | 11.9 | 10.5 | 15.6 | 12.7 | 12.1 | 12.6 | 13.1 | 13.0 | 15.9 | 12.6 | 15.0 | 14.9 |
| Oklee | 13.7 | 11.5 | 15.7 | 13.7 | 12.6 | 12.5 | 14.6 | 13.5 | 15.6 | 12.9 | 14.8 | 16.1 |
| RB07 | 13.4 | 11.4 | 15.8 | 13.1 | 12.7 | 14.3 | 13.7 | 12.5 | 15.2 | 12.3 | 14.3 | 15.8 |
| Red Fife | 11.2 | 12.2 | 16.4 | 12.2 | 12.4 | 14.2 | 13.6 | 12.8 | 16.2 | 12.5 | 14.4 | 15.3 |
| Roblin | 15.3 | 12.8 | 16.6 | 13.9 | 13.5 | 14.8 | 15.7 | 15.0 | 16.0 | 15.1 | 15.8 | 18.0 |
| Sabin | 12.3 | 10.9 | 15.7 | 12.1 | 11.9 | 12.0 | 13.6 | 13.0 | 16.9 | 11.6 | 14.5 | 14.7 |
| Steele | 13.7 | 11.7 | 15.8 | 12.6 | 12.6 | 13.7 | 13.9 | 13.3 | 15.2 | 12.4 | 15.2 | 16.2 |
| Superb | 13.4 | 11.7 | 16.0 | 12.6 | 13.0 | 13.4 | 13.4 | 13.5 | 15.0 | 13.0 | 14.5 | 16.0 |
| Sy Soren | — | — | — | — | — | — | 14.1 | — | — | 13.3 | — | — |
| Tom | 13.8 | 10.7 | 14.6 | 12.7 | 13.1 | 13.2 | 14.4 | 13.3 | 13.6 | 12.7 | 14.7 | 15.6 |
| Ulen | 14.6 | 11.9 | 16.0 | 13.5 | 13.2 | 14.4 | 14.1 | 13.0 | 15.3 | 12.3 | 14.6 | 16.7 |
| AC Walton | 10.8 | 10.9 | 15.6 | 12.1 | 11.0 | — | 13.8 | 12.3 | 15.7 | 12.1 | 15.5 | 13.7 |
| Site Average | 13.1 | 11.3 | 15.7 | 12.9 | 12.5 | 13.4 | 13.9 | 12.9 | 15.3 | 12.6 | 14.8 | 15.6 |
| LSD (0.05) | 0.95 | 0.6 | 0.8 | 0.97 | 0.8 | 1.4 | 0.8 | 1.3 | — | 0.8 | 0.8 | — |
| † For all measures, bolded values are not significantly different from the highest value, which is indicated with an underline. ‡Variety is not a hard red type. § Average value taken from one sample per variety instead of four. |
||||||||||||
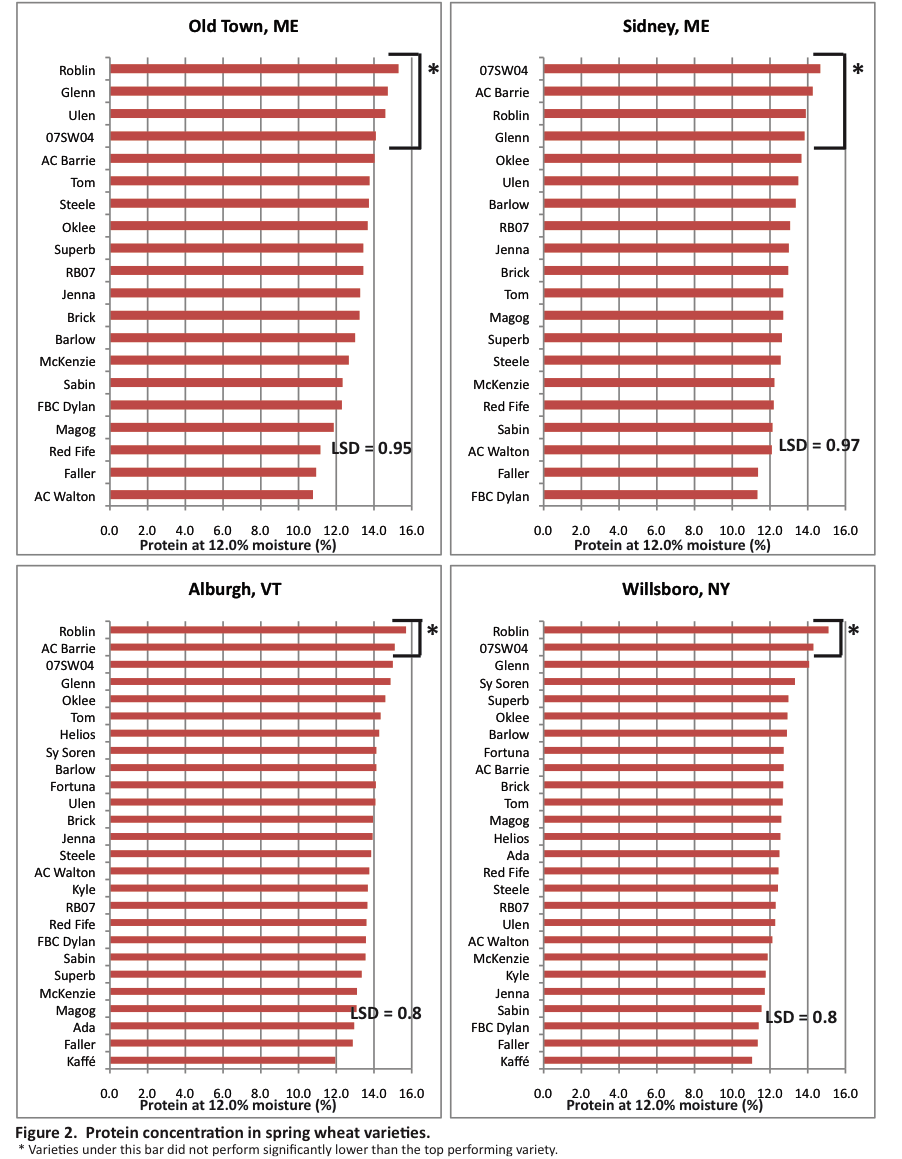
Figure 2 Alternative Text (Word)
Table 8. DON levels for spring wheat in ME, VT, and NY.
| Variety | DON (ppm) | |||||||||||
|---|---|---|---|---|---|---|---|---|---|---|---|---|
| Old Town, ME | Sidney, ME | Alburgh, VT | Willsboro, NY | |||||||||
| 2012 | 2011 | 2010 | 2012 | 2011 | 2010 | 2012 | 2011 | 2010 | 2012 | 2011 | 2010 | |
| 07SW04 | 0.5 | 1.3 | — | <0.5 | <0.5 | — | <0.5 | <0.5 | — | <0.5 | <0.5 | — |
| Ada | — | 4.1 | 1.6 | — | 1.0 | 0.6 | <0.5 | <0.5 | 3.3 | <0.5 | <0.5 | 0.8 |
| Barlow | 1.0 | 3.4 | — | 1.1 | 1.5 | — | 0.6 | <0.5 | — | <0.5 | <0.5 | — |
| AC Barrie | <0.5 | 2.2 | 0.8 | 0.5 | <0.5 | — | <0.5 | <0.5 | 3.3 | <0.5 | <0.5 | <0.5 |
| Brick | 0.6 | 1.8 | — | <0.5 | 0.7 | — | <0.5 | <0.5 | — | <0.5 | <0.5 | — |
| Faller | 0.5 | 1.8 | 1.2 | 0.6 | 0.5 | 1.3 | <0.5 | <0.5 | 2.3 | <0.5 | <0.5 | 0.7 |
| FBC Dylan | 0.7 | 4.1 | 2.6 | 0.6 | 0.6 | 1.5 | 0.6 | <0.5 | 2.8 | <0.5 | <0.5 | 0.6 |
| Fortuna | — | — | — | — | — | — | 0.6 | — | — | <0.5 | — | — |
| Glenn | 0.7 | 1.8 | 3.2 | 0.8 | 0.6 | 0.7 | <0.5 | <0.5 | 2.0 | 0.6 | <0.5 | 0.6 |
| Helios | — | — | — | — | — | — | <0.5 | <0.5 | 2.3 | <0.5 | <0.5 | 0.6 |
| Jenna | 1.6 | 4.2 | — | 4.0 | 1.0 | — | <0.5 | <0.5 | — | <0.5 | <0.5 | — |
| Kaffé§ | — | — | — | — | — | — | <0.5 | <0.5 | 4.1 | <0.5 | <0.5 | <0.5 |
| Kyle§ | — | — | — | — | — | — | 1.0 | — | — | <0.5 | — | — |
| McKenzie | 1.5 | 1.5 | — | 1.9 | <0.5 | — | <0.5 | <0.5 | 2.2 | <0.5 | <0.5 | 0.5 |
| Magog | 0.7 | 1.7 | 1.2 | 1.0 | <0.5 | 1.0 | <0.5 | <0.5 | 3.1 | <0.5 | <0.5 | <0.5 |
| Oklee | 1.1 | 4.1 | 1.6 | 0.9 | 0.8 | 1.1 | 0.7 | 0.5 | 3.8 | <0.5 | <0.5 | 0.9 |
| RB07 | 0.7 | 3.6 | 2.5 | 0.5 | 0.7 | 1.3 | 0.6 | <0.5 | 2.4 | 0.5 | <0.5 | 0.6 |
| Red Fife | 1.5 | 1.5 | 1.9 | 1.5 | 1.1 | 1.2 | <0.5 | <0.5 | 2.1 | <0.5 | <0.5 | <0.5 |
| Roblin | 0.5 | 3.8 | 0.8 | 0.5 | 0.8 | 1.3 | 0.5 | 0.6 | 2.3 | <0.5 | <0.5 | <0.5 |
| Sabin | <0.5 | 1.1 | <0.5 | <0.5 | 0.5 | 1.3 | <0.5 | <0.5 | 1.6 | <0.5 | <0.5 | <0.5 |
| Steele | 1.5 | 3.9 | <0.5 | 2.7 | 1.1 | 1.4 | 0.6 | <0.5 | 3.4 | <0.5 | <0.5 | 1.3 |
| Superb | 4.2 | 5.1 | — | 2.6 | 2.0 | — | 0.7 | <0.5 | 4.9 | <0.5 | <0.5 | 2.1 |
| Sy Soren | — | — | — | — | — | — | <0.5 | — | — | <0.5 | — | — |
| Tom | 0.7 | 2.4 | 0.7 | 0.7 | <0.5 | 1.7 | <0.5 | <0.5 | 1.7 | <0.5 | <0.5 | 0.8 |
| Ulen | 1.7 | 4.4 | 2.2 | 2.1 | 0.9 | 1.4 | 0.7 | <0.5 | 3.1 | <0.5 | <0.5 | 0.7 |
| AC Walton | 1.4 | 1.7 | 3.3 | 1.5 | <0.5 | — | <0.5 | <0.5 | 2.1 | <0.5 | <0.5 | <0.5 |
| Site Average | 1.1 | 2.8 | 1.6 | 1.2 | 0.8 | 1.2 | <0.5 | <0.5 | 2.8 | <0.5 | <0.5 | 0.7 |
| † For all measures, bolded values are not significantly different from the highest value, which is indicated with an underline. ‡ Variety is not a hard red type. § No significant difference among varieties. |
||||||||||||
DISCUSSION
Wheat grain sold for bread flour can receive up to twice the pay price as grain sold for livestock feed in New England, but the grain must meet higher quality standards. Therefore, when choosing which varieties to plant, it is important to consider their potential to produce grain with acceptable protein, test weight, falling number, and DON levels, as well as their ability to produce high yields.
Overall the 2012 growing season was a good one for spring cereals. A very mild winter with little snow pack and a drier and warmer than normal March allowed for early planting of the trials. Wet weather in June (before and during flowering) did lead to DON levels above 1 ppm in some cases in Maine, but July and early August were drier than normal allowing for excellent conditions during ripening. Due to early planting, weeds were not a problem at any location. The Alburgh, Old Town, and Willsboro sites produced yields well above the historical average. Average protein levels were adequate at all sites.
There is often a tradeoff between yield potential and protein potential. For instance, in Maine in 2012, Faller and AC Walton had impressive yields but also the lowest protein levels. In contrast, Glenn, Roblin, and AC Barrie produced lower than average yields but had among the highest protein levels. Over the three years that these variety trials have been conducted, a number of varieties have produced average or above-average yields and also maintained adequate protein levels. These include AC Superb, Oklee, Jenna, RB07, Tom, and the experimental variety 07SW04 (to be released in 2013 under the name “Yorkton”).
Fusarium head blight can be a major issue in our region. Options for managing the disease in organic systems are limited and include rotating with non-grain crops (i.e., avoid planting wheat after wheat, corn, barley, and rye), burying any disease-carrying debris, and choosing less susceptible varieties. While none of the current wheat varieties is resistant to Fusarium head blight, some have better tolerance to the disease than others. In trials conducted in North Dakota and Minnesota where disease and moisture levels were controlled to maximize disease incidence, Brick, Glenn, and RB07 had the best tolerance to Fusarium. In our trials, varieties that have most consistently shown below average DON levels over the last three years include AC Barrie, Faller, Glenn, Magog, Sabin, and Tom. As well, Brick and the experimental variety 07SW04 had below average DON levels over the two years they were tested. Choosing a more tolerant variety may provide some protection against Fusarium, but conditions at flowering drive infection and may still result in high DON levels. One management strategy is to plant two or three tolerant varieties that have different maturity dates, and hence flowering dates, to hedge against wet weather at flowering.
It may be helpful to compare these ME, VT, and NY results with results from variety trails conducted in other regions. Ultimately, though, it is important to evaluate data from test sites that are similar to your farm and region when deciding which varieties to grow.
Full reports of the 2010 and 2011 results are available as separate publications available online.
Acknowledgements: The UVM Extension Crops and Soils Team would like to thank the Borderview Research Farm and the Willsboro Research Farm for their generous help with the trials, as well as acknowledge the USDA OREI grants program for their financial support. We would also like to thank Katie Blair, Chantel Cline, and Savanna Kittell-Mitchell for their assistance with data collection and entry. This information is presented with the understanding that no product discrimination is intended and neither endorsement of any product mentioned, nor criticism of unnamed products, is implied. The University of Maine Sustainable Agriculture team thanks Jeff Bragg of Rainbow Valley Farm for providing his assistance and field in Sidney, the University of Maine Rogers Research Farm, and Joe Cannon, Chris Illingworth, Maggie Lynn, Jess Richards, Erin Roche, and Aaron Englander for their technical help. Information in this publication is provided purely for educational purposes. No responsibility is assumed for any problems associated with the use of products or services mentioned. No endorsement of products or companies is intended, nor is criticism of unnamed products or companies implied.
This research is supported by the U.S. Department of Agriculture, National Institute of Food and Agriculture, Organic Research and Extension Initiative under Award No. 2009- 01366, “Enhancing farmers’ capacity to produce high quality organic bread wheat.”
Published and distributed in furtherance of Acts of Congress of May 8 and June 30, 1914, by the University of Maine Cooperative Extension, the Land Grant University of the state of Maine and the U.S. Department of Agriculture cooperating. Cooperative Extension and other agencies of the U.S.D.A. provide equal opportunities in programs and employment. Call 800.287.0271 (in Maine), or 207.581.3188, for information on publications and program offerings from University of Maine Cooperative Extension, or visit extension.umaine.edu.