2012 Organic Winter Wheat Variety Trial – Maine & Vermont
2012 Organic Winter Wheat Variety Trial Results — Maine & Vermont (PDF)

Ellen Mallory, Heather Darby, Thomas Molloy, Erica Cummings, Hannah Griffin
Bread wheat is a new crop option for farmers in Northern New England due to increasing consumer demand for locally grown food. In 2010, the University of Maine and the University of Vermont began a series of trials evaluating varieties of hard red wheat to identify those that perform well in northern New England under organic production. This publication presents results for winter wheat varieties tested in 2012, and some results from 2010 and 2011 as well. Separate publications for spring and winter wheat variety trials conducted in 2010 and 2011 are available online.
This collaborative work was funded by a grant from the USDA Organic Agriculture Research and Extension Initiative to improve bread wheat production in our region.
Table 1. Winter wheat varieties evaluated in ME, VT, and NY in 2012.
| Variety | Type† | Origin and Year of Release‡ | Seed Source |
|---|---|---|---|
| AC Morley | HR | Advantage Seeds, ON | Brahmill Seeds, ON |
| Alice | HW | SDSU, 2006 | USDA-ARS, SD |
| Appal. White | HW | NC#, 2009 | USDA-ARS, NC |
| Arapahoe | HR | NE, 1988 | Albert Lea Seed House, MN |
| Banatka | HR | Hungary, 1800s | Heritage Wheat Conservancy, MA |
| Borden | MHR | Semican, Canada, 1983 | Research farm saved seed |
| Camelot | HR | NE, 2008 | USDA-ARS, NE |
| Expedition | HR | SDSU, 2002 | Albert Lea Seed House, MN |
| Harvard | HR | C&M Seeds, ON, 2003 | Agri-Culver Seeds, NY |
| Jerry | HR | NDSU, 2001 | North Dakota State Univ. |
| Maxine | HR | C&M Seeds, ON, 2001 | Research farm saved seed |
| Millenium | HR | NE, 1999 | USDA-ARS, NE |
| NuEast | HR | NC, 2009 | USDA-ARS, NC |
| Overland | HR | NE, 2007 | USDA-ARS, NE |
| Redeemer | HR | Brahmill Seeds, ON, 2008 | Brahmill Seeds, ON |
| Roughrider | HR | NDSU, 1975 | Research farm saved seed |
| Sherman | SW | OR, 1928 | Washington State Univ. |
| Warthog | HR | Semican, Canada | Research farm saved seed |
| Zorro | HR | Canada | Research farm saved seed |
| † HR = hard red, MHR = medium hard red, HW – hard white, SW = soft white. ‡ Year of release not always available. # Abbreviations: NC = North Carolina, NDSU = North Dakota State University, NE = Nebraska, OR = Oregon, SDSU = South Dakota State University |
|||
TRIAL DESIGN AND VARIETIES
Trials were established at four locations in the Northeast: the University of Maine Rogers Farm Forage and Crop Research Facility in Old Town, ME; Nature’s Circle Farm, a commercial operation in Houlton, ME; the Borderview Research Farm in Alburgh, VT; and the Willsboro Research Farm in Willsboro, NY. The experimental design was a randomized complete block with four replications, which means each variety was planted in four separate plots at each location. The winter wheat varieties that were evaluated are listed in Table 1. Most are hard red types. Hard wheat varieties are preferred for bread flour.
WEATHER CONDITIONS
Seasonal precipitation and temperature data were recorded at or near trial locations (Table 2). The Alburgh, Old Town, and Willsboro locations had weather stations in close proximity, while the Houlton location had a weather station within 4.5 miles. Winter conditions in the Northeast were mild with very little snow. Early spring conditions (March and April) were substantially warmer and drier than normal for all locations. The VT and NY locations experienced above average temperatures during the middle and later part of the growing season. The two ME sites had above average precipitation during flowering (June) and drier and warmer conditions during grain fill and harvest (July to August).
Table 2. Precipitation, temperature, and growing degree days at the trial locations in 2012.†
| Location | Sept. 2011 |
Oct. 2011 |
Nov. 2011 |
March 2012 |
April 2012 |
May 2012 |
June 2012 |
July 2012 |
Total |
|---|---|---|---|---|---|---|---|---|---|
| Old Town, ME | |||||||||
| Total precipitation (in.) | 1.88 | 4.29 | 2.55 | 1.95 | 3.68 | 4.3 | 6.03 | 0.99 | 25.7 |
| Departure from Normal | -1.96 | 0.89 | -0.98 | -1.31 | 0.47 | 0.96 | 2.47 | -2.38 | -3.5 |
| Average Temperature (°F) | 60.6 | 48.8 | 40.6 | 36.1 | 44.3 | 55.1 | 60.8 | 68.7 | — |
| Departure from Normal | 4.2 | 3.5 | 5.1 | 5.1 | 2.3 | 1.2 | -1.9 | 0.3 | — |
| Growing Degree Days‡ | 864 | 514 | 245 | 126 | 356 | 707 | 867 | 1114 | 4793 |
| Houlton, ME | |||||||||
| Total precipitation (in.) | 3.41 | 3.25 | 1.73 | 1.47 | 3.03 | 3.46 | 11.51 | 0.59 | 28.45 |
| Departure from Normal | -.03 | -.06 | -1.89 | -1.24 | 0.19 | 0.23 | 7.85 | -2.87 | +2.2 |
| Average Temperature (°F) | 58.5 | 47.0 | 38.1 | 33.1 | 41.9 | 52.8 | 60.1 | 67.5 | — |
| Departure from Normal | 4.4 | 4.0 | 6.6 | 7.3 | 3.4 | 1.2 | -0.7 | 1.4 | — |
| Growing Degree Days | 796 | 461 | 225 | 154 | 297 | 615 | 844 | 1059 | 4451 |
| Alburgh, VT | |||||||||
| Total precipitation (in.) | 5.56 | 3.52 | 1.41 | 1.46 | 2.64 | 3.90 | 3.22 | 3.78 | 25.5 |
| Departure from Normal | 1.92 | -0.08 | -1.71 | -0.75 | -0.18 | 0.45 | -0.47 | -0.37 | -1.2 |
| Average Temperature (°F) | 62.8 | 50.1 | 43.4 | 39.7 | 44.9 | 60.5 | 67.0 | 71.4 | — |
| Departure from Normal | 2.20 | 1.90 | 5.20 | 8.60 | 0.10 | 4.10 | 1.20 | 0.80 | — |
| Growing Degree Days | 932 | 978 | 344 | 331 | 396 | 884 | 1046 | 1221 | 6132 |
| Willsboro, NY | |||||||||
| Total precipitation (in.) | 6.10 | 3.40 | 1.40 | 1.00 | 2.80 | 4.40 | 3.20 | 3.80 | 26.1 |
| Departure from Normal | 2.50 | -0.10 | -1.70 | -1.20 | 0.00 | 0.90 | -0.50 | -0.40 | -0.5 |
| Average Temperature (°F) | 64.1 | 50.1 | 43.3 | 43.2 | 46.1 | 61.6 | 67.8 | 73.0 | — |
| Departure from Normal | 3.50 | 1.90 | 5.10 | 12.10 | 1.30 | 5.20 | 2.00 | 2.40 | — |
| Growing Degree Days | 964 | 566 | 368 | 411 | 435 | 917 | 1072 | 1271 | 6004 |
| † Based on National Weather Service data from cooperative observer stations in close proximity to field trials available at http://www.ncdc.noaa.gov/crn/report. Historical averages are for 30 years (1981-2010) available at https://www.ncdc.noaa.gov/cdo-web/datatools/normals. ‡Base 32°F |
|||||||||
CULTURAL PRACTICES
Plots were managed following practices similar to those used by farmers in northern New England (see Table 3).
Rogers Research Farm – Old Town, ME – The trial was conducted on a field that had been in annual crop production for more than 20 years and fallowed in 2011. In early September 2011, the field was prepared using a moldboard plow and seedbed conditioner. Solid dairy manure was spread at a rate of 32 tons/acre on September 19, 2011 and immediately incorporated with a Perfecta harrow. The plots were seeded with an Almaco Cone Seeder on September 20, 2011, and top-dressed on May 23, 2012 with 100 lbs/acre of Chilean nitrate. The plots were harvested with a Wintersteiger Classic plot combine on July 20, 2012. The harvest area was 4’ x 44’.
Nature’s Circle Farm – Houlton, ME – The field used for the trial was in oats in 2011. In early September 2011, the field was prepared using a moldboard plow and seedbed conditioner. On September 21, dehydrated pelletized poultry manure (“Nutri-Wave” 4-1-2; Envirem Technologies Inc.) was applied at a rate of 800 lbs/acre and incorporated with a spring-tine harrow on the same day. The plots were seeded with an Almaco Cone Seeder on September 22, 2012. On April 27, 2012 a top-dress application of Nutri-Wave was applied at a rate of 3200 lbs/acre using a spin spreader. The plots were harvested with a Wintersteiger Classic plot combine on August 3, 2012. The harvest area was 4’ x 44’.
Borderview Research Farm – Alburgh, VT – The previous crop on this field was spring wheat. In September 2011, the field was plowed, disked, and spike-tooth harrowed. The plots were seeded using a Kincaid Cone Seeder on September 21. On May 3, 2012 a topdress application of Pro-Booster and Pro-Gro fertilizers were applied by hand at a rate of 500 lbs/acre each. The plots were harvested July 11, 2012 using an Almaco SPC50 combine. The harvest area was 5’ x 20’.
Willsboro Research Farm – Willsboro, NY – The field used for this trial was previously in a 3-year timothy/alfalfa sod. In September 2011, the field was mold- board plowed, disked, and spring-tooth harrowed. The plots were seeded on September 27, 2011 using an eight-row cone seeder. The plots were harvested on July 20, 2012 with a Hege combine. The harvest area was 4’ x 13’.
Table 3. General plot management of the winter wheat trials in 2012.
| † The target seeding rate was calculated to achieve the same plant density for each variety. At the 33 seeds/ft2 rate, this translated to 70-240lbs of seed/acre depending on the seed weight of each variety. | ||||
| Location | Rogers Research Farm Old Town, ME | Nature’s Circle Farm Houlton ME | Borderview Research Farm Alburgh, VT | Willsboro Research Farm Willsboro, NY |
|---|---|---|---|---|
| Soil type | Melrose & Elmwood fine sandy loam | Caribou gravelly loam | Benson rocky silt loam | Kingsbury silt clay loam |
| Previous crops | Fallow | Oats | Spring Wheat | Timothy/Alfalfa Sod |
| Tillage operations | Moldboard plow, seedbed conditioner, spring-tine harrow | Moldboard plow, seedbed conditioner, spring-tine harrow | Fall plow, disk, spike-toothed harrow | Fall plow, disk, spring-toothed harrow |
| Feritility source | Solid dairy manure (32 tons/acre) Chilean nitrate top-dress (16lbs N/acre) |
Dehydrated, pelletized chicken manure (4,000 lbs/acre) | Pro-Booster (10-0-0) (500 lbs/acre) Pro-Gro (5-3-4) (500 lbs/acre) |
Timothy/Alfalfa Sod |
| Estimated available nitrogen (lbs/acre) | 86 | 80 | 75 | 65-75 |
| Seeding rate (seeds/ft2)† | 33 | 41 | 33 | 33 |
| Planting date | 9-20-11 | 9-22-11 | 9-21-11 | 9-27-11 |
| Harvest date | 7-20-12 | 8-3-12 | 7-11-12 | 7-20-12 |
| Row spacing (in) | 6.5 | 6.5 | 6 | 6 |
| Harvest area (ft2) | 4’ x 44’ | 4’ x 44’ | 5’ x 20’ | 4’ x 13’ |
MEASUREMENTS AND METHODS
Flowering date was recorded for each variety where possible. Plant heights were measured at physiological maturity in ME and at harvest in VT and NY. Prior to harvest, the incidence and severity of lodging was noted for each variety.
All varieties were harvested on the same day at each site once the latest maturing variety threshed free in hand tests and weather and logistics allowed. Following harvest, the grain was cleaned with a small Clipper cleaner and weights recorded. Harvest moisture and test weights were determined using a DICKEY-john GAC 2100 moisture meter.
Subsamples were ground into flour using a Perten LM3100 Laboratory Mill. The ground material was then analyzed for crude protein, falling number, and mycotoxin levels. Protein content was determined using a Perten Inframatic 8600 Flour Analyzer. Most commericial mills target 12% protein for winter wheat. Falling number was determined on a Perten FN 1500 Falling Number Machine. The falling num- ber is related to the level of sprout damage that has occurred in the grain due to enzymatic activity. It is measured as the time it takes, in seconds, for a plunger to fall through a slurry of flour and water to the bottom of the tube. Falling numbers less than 200 seconds indicate high enzymatic activity and poor quality wheat. Concentrations of deoxynivalenol (DON), a mycotoxin produced by the fungus that causes Fusarium head blight, were determined using the Veratox DON 2/3 Quantitative test from the NEOGEN Corp. This test has a detection range of 0.5 to 5 ppm. Samples with DON values greater then 1 ppm are considered unsuitable for human consumption.
All data were analyzed using mixed model Analysis of Variance (ANOVA) in which replicates were considered random effects. The LSD procedure was used to determine whether differences among variety averages were statistically significant (P<0.05) (See below for explanation of a significant difference). There were significant differences between the locations for most parameters, so results form each location are reported independently.
What Is a Significant Difference?
Variations in yield and quality can occur not only due to genetics but also due to variability in soil, weather, and other growing conditions. Statistical analysis makes it possible to determine whether a difference between two varieties is real or whether it might have occurred due to other variability in the field. The Least Significant Difference (LSD) is the minimum difference needed between two averages to consider them statistically different. LSDs at the 5% level of probability are presented at the bottom of each table for each measure. Where the difference between two varieties within a column is equal to or greater than the LSD value, you can be sure in 19 out of 20 chances that there is a real difference between the two varieties.
In the example below, variety A is significantly different from variety C because the difference between their yields (1454) is greater than the LSD value (889). Variety A is not significantly different from variety B because the difference between their yields (725) is less than the LSD value (889).
Throughout this bulletin, the greatest value at each site for each measure is indicated with an underline and bold type. Varieties that are not significantly different from the greatest value are also in bold type. Using the example below, variety C had the highest measured yield (underlined and bolded) but it was not significantly different than the yield of variety B (bolded).
Example Table
| Variety | Yield | ||||||
|
|
||||||
| LSD | 889 |
RESULTS
Growth and Development
Winter survival was good for all varieties at all locations due to the mild conditions, and lodging and wildlife damage were minimal. An exception was Banatka, a tall heritage variety, that experienced severe lodging at the Old Town site. This was likely due to a relatively high nitrogen application rate at this location. As well, Appalachian White and Sherman showed partial lodging at Alburgh.
Flowering occurred predominately during the first and second week of June at all locations in 2012, with varieties in VT and NY flowering before the ME locations (Table 4). Most varieties flowered within a few days of one another. Appalachian White, Arapahoe, Expedition, andNuEast flowered relatively early, whereas Zorro flowered relatively late.
Plant heights were taken at the Old Town, Alburgh, and Willsboro locations and ranged from 29 to 57 inches (Table 4). Banatka, which was only planted at the two ME sites, was the tallest variety at close to 5 feet tall. Other tall varieties included AC Morley, Borden, Roughrider, Sherman, and Zorro. Shorter varieties included Appalachian White, Expedition, Harvard, Maxine, and NuEast.
Table 4. Estimated wheat flowering date and plant height at selected trial locations in 2012.
| Variety | Flowering Date | Plant Height (inches) | ||||
|---|---|---|---|---|---|---|
| AC Morley | 8-Jun | 1-Jun | <4-Jun | 48 | 48 | 40 |
| Alice | — | 1-Jun | <4-Jun | — | 36 | 29 |
| Appal. White† | 4-Jun | 1-Jun | <4-Jun | 34 | 36 | 31 |
| Arapahoe | 5-Jun | 1-Jun | <4-Jun | 38 | 40 | 34 |
| Banatka | 6-Jun | — | — | 57 | — | — |
| Borden† | 9-Jun | 1-Jun | <4-Jun | 49 | 48 | 44 |
| Camelot | 7-Jun | 4-Jun | <4-Jun | 37 | 39 | 32 |
| Expedition | 5-Jun | 1-Jun | <4-Jun | 37 | 39 | 36 |
| Harvard | 8-Jun | 1-Jun | <4-Jun | 37 | 41 | 35 |
| Jerry | 9-Jun | 1-Jun | <4-Jun | 40 | 46 | 39 |
| Maxine | 6-Jun | 1-Jun | <4-Jun | 35 | 39 | 33 |
| Millenium | 8-Jun | 1-Jun | <4-Jun | 38 | 41 | 35 |
| NuEast | 5-Jun | 4-Jun | <4-Jun | 35 | 38 | 31 |
| Overland | 7-Jun | 1-Jun | <4-Jun | 38 | 42 | 35 |
| Redeemer | 8-Jun | 1-Jun | <4-Jun | 40 | 41 | 38 |
| Roughrider | 7-Jun | 1-Jun | <4-Jun | 45 | 46 | 38 |
| Sherman† | — | 1-Jun | <6-Jun | — | 49 | 47 |
| Warthog | 8-Jun | 1-Jun | <4-Jun | 39 | 44 | 38 |
| Zorro | 12-Jun | 1-Jun | <4-Jun | 45 | 45 | 41 |
| † Variety is not a hard red type. | ||||||
Yield
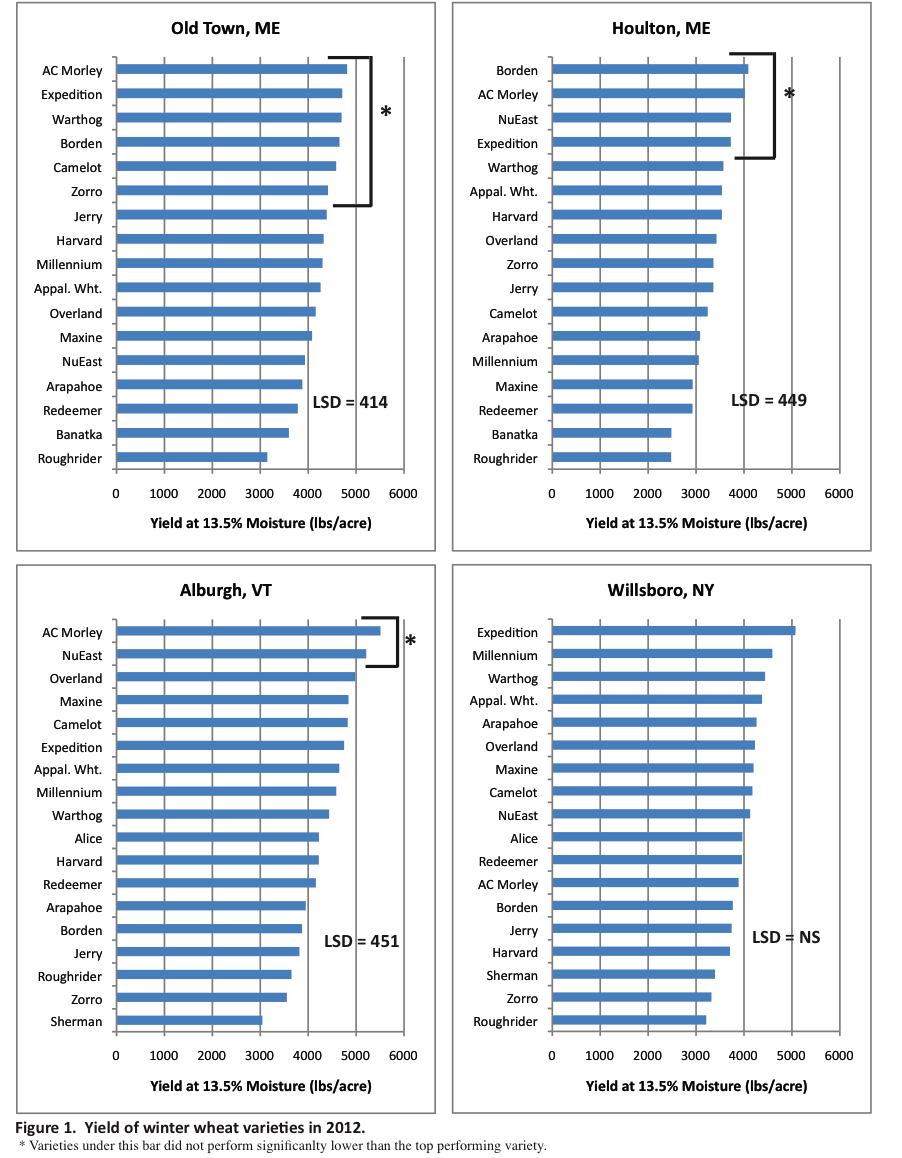
Yields for 2012, 2011, and 2010 are presented in Table 5. Yields from 2012 are also presented in graphical form in Figure 1 to easily compare varieties.
For each site, yields in 2012 were consistently higher than in previous years, due to favorable weather conditions and changes in nitrogen management, including adding a spring topdress fertilizer application (Old town and Alburgh) and shifting the majority of the split application of pelletized dehydrated chicken manure at Houlton to the early spring. Overall, the highest yields were at the Alburgh site, closely followed by Old Town. The Houlton site had the lowest yields, as has been the case in previous years. Lower yields at this northern ME location are likely due to more difficult winter conditions and fewer growing degree days.
Varieties that were among the highest yielding at a minimum of 3 of the 4 sites in 2012 were AC Morley, Expedition, and Warthog. Banatka (only grown in ME), Redeemer, and Roughrider were the lowest yielding varieties in ME, while in VT and NY, Roughrider, Sherman (only grown in VT and NY), and Zorro were the lowest yielding. Varieties that have yielded above average over multiple years and sites include AC Morley, Borden, Expedition, Harvard, Jerry, and Warthog.
Table 5. Yield of winter wheat at trial locations in 2010, 2011, and 2012.
| Variety | Yield at 13.5% Moisture (lbs/acre) | ||||||||||
|---|---|---|---|---|---|---|---|---|---|---|---|
| Old Town, ME | Houlton, ME | Alburgh, VT | Willsboro, NY | ||||||||
| 2012 | 2011 | 2010 | 2012 | 2011 | 2012 | 2011 | 2010 | 2012 | 2011 | 2010 | |
| AC Morley | 4812 | 2799 | 2746 | 4020 | 2993 | 5507 | 5171 | 3985 | 3887 | 3226 | 3798 |
| Alice | — | — | — | — | — | 4224 | 3159 | — | 3966 | 2498 | — |
| Appal. White‡ | 4257 | 2710 | — | 3540 | 2160 | 4648 | 3839 | — | 4376 | 2501 | — |
| Arapahoe | 3876 | 2337 | 2515 | 3083 | 1921 | 3948 | 3028 | 4041 | 4261 | 2653 | 4439 |
| Banatka | 3596 | 2660 | — | 2484 | — | — | — | — | — | — | — |
| Borden‡ | 4652 | 2752 | 3344 | 4089 | 2602 | 3872 | 4306 | 4615 | 3766 | 2331 | 4657 |
| Camelot | 4583 | 2332 | 2887 | 3242 | 1960 | 4824 | 3687 | 3631 | 4175 | 2387 | 4121 |
| Expedition | 4710 | 2504 | 2656 | 3724 | 2522 | 4748 | 3207 | 3466 | 5073 | 2436 | 4173 |
| Harvard | 4321 | 2696 | 3247 | 3538 | 2740 | 4221 | 4338 | 3237 | 3708 | 3006 | 4303 |
| Jerry | 4385 | 2372 | 3469 | 3360 | 3024 | 3816 | 3609 | 4408 | 3740 | 2862 | 4432 |
| Maxine | 4080 | 1774 | 2388 | 2927 | 1651 | 4839 | 3324 | 3692 | 4198 | 1654 | 2822 |
| Millenium | 4298 | 2214 | 2511 | 3056 | 1767 | 4585 | 3683 | 4319 | 4591 | 2501 | 4397 |
| NuEast | 3932 | 2680 | — | 3729 | 1893 | 5210 | 3758 | — | 4128 | 2913 | — |
| Overland | 4155 | 2248 | 3001 | 3426 | 2237 | 4983 | 3904 | 4208 | 4229 | 3397 | 4372 |
| Redeemer | 3783 | 2537 | 2652 | 2925 | 2704 | 4159 | 4149 | 3886 | 3958 | 2217 | 3043 |
| Roughrider | 3146 | — | — | 2479 | — | 3650 | 3010 | 3423 | 3212 | 2457 | 3798 |
| Sherman‡ | — | — | — | — | — | 3043 | 3226 | — | 3396 | 2660 | — |
| Warthog | 4695 | 3068 | 3387 | 3569 | 3330 | 4437 | 4202 | 3580 | 4440 | 1691 | 3178 |
| Zorro | 4413 | 2667 | 3145 | 3362 | 2379 | 3553 | 3933 | 2836 | 3320 | 2984 | 3746 |
| Site Average | 4215 | 2522 | 2919 | 3286 | 2392 | 4348 | 3752 | 3809 | 4023 | 2576 | 3949 |
| LSD (0.05) | 414 | 433 | 695 | 449 | 466 | 451 | 518 | NSD | NSD | 811 | 564 |
| † For all measures, bolded values are not significantly different from the highest value, which is indicated with an underline. ‡ Variety is not a hard red type. NSD = No significant difference among the varieties for this site in this year. |
|||||||||||
Wheat Quality
Commercial mills use a variety of measurements to determine if a particular lot of wheat is suitable for bread flour including test weight, falling number, grain protein, and mycotoxin (DON) concentration.
The standard test weight for wheat is 58 lbs/bushel, with an acceptable range of 56-60 lbs/bushel. In 2012, test weights fell within this range, with several varieties exceeding it. NuEast had some of the highest test weights at all locations.
Falling number values exceeded the acceptable level (250 seconds) for all varieties and locations, ranging from 337 to 525 seconds (Table 6).
Grain protein levels were highest at Alburgh in 2012, followed by Houlton, Willsboro, and Old Town. Hard red varieties that had high protein levels across all sites were Maxine, Redeemer, and Roughrider (proteins ranged from 10.0 to 13.3% among these varieties). Banatka (a heritage variety), and Sherman (a soft white variety) also had relatively high protein levels (Table 7, Figure 2). Redeemer stands out as the single variety that has consistently been among the highest protein performers for all sites and years.
Fusarium head blight, which produces the mycotoxin deoxynivalenol (DON), is a disease of major concern for wheat growers in northern New England. It primarily infects the plant during flowering and is favored by cool, humid weather, particularly just before and during flowering. The United States Food and Drug Administration has established a maximum DON guideline of 1 ppm for finished human products. Millers may accept grain with slightly higher DON levels because they can remove some of the infected grain and reduce DON levels through cleaning.
DON levels in 2012 were low, with all varieties testing below 1 ppm at all locations (Table 8). VT and NY did experience higher DON levels in previous years, however the ME sites have consistently had low DON levels for winter wheat in these trials.
Table 6. Test weight and falling number of winter wheat at trial locations in 2012.
| Variety | Test Weight (lbs/bu) | Falling Number at 14% Moisture (seconds) | ||||||
|---|---|---|---|---|---|---|---|---|
| Old Town, ME | Houlton, ME | Alburgh, VT | Willsboro, NY | Old Town, ME | Houtlon, ME | Alburgh, VT | Willsboro, NY | |
| 2012 | 2012 | |||||||
| AC Morley | 59 | 59 | 62 | 60 | 507 | 419 | 377 | 354 |
| Alice | — | — | 61 | 59 | — | — | 416 | 402 |
| Appal. White‡ | 61 | 57 | 62 | 58 | 438 | 400 | 392 | 408 |
| Arapahoe | 60 | 57 | 60 | 58 | 436 | 452 | 404 | 394 |
| Banatka | 60 | 60 | — | — | 427 | 421 | — | — |
| Borden‡ | 57 | 58 | 59 | 56 | 508 | 508 | 354 | 377 |
| Camelot | 61 | 57 | 61 | 60 | 472 | 436 | 402 | 405 |
| Expedition | 61 | 57 | 63 | 60 | 511 | 479 | 405 | 395 |
| Harvard | 58 | 59 | 60 | 59 | 502 | 355 | 337 | 361 |
| Jerry | 60 | 58 | 59 | 58 | 448 | 402 | 413 | 386 |
| Maxine | 60 | 57 | 60 | 59 | 525 | 484 | 391 | 405 |
| Millenium | 60 | 57 | 60 | 59 | 503 | 425 | 397 | 390 |
| NuEast | 63 | 59 | 64 | 60 | 456 | 458 | 403 | 396 |
| Overland | 59 | 56 | 62 | 58 | 438 | 477 | 382 | 384 |
| Redeemer | 62 | 58 | 61 | 59 | 466 | 488 | 407 | 439 |
| Roughrider | 61 | 58 | 63 | 61 | 478 | 434 | 369 | 387 |
| Sherman‡ | — | — | 62 | 59 | — | — | 399 | 411 |
| Warthog | 61 | 58 | 59 | 59 | 463 | 461 | 388 | 435 |
| Zorro | 58 | 59 | 59 | 59 | 471 | 482 | 372 | 351 |
| Site Average | 60 | 58 | 61 | 59 | 473 | 449 | 389 | 393 |
| LSD (0.05) | 0.9 | 1.0 | 1.9 | 1.7 | — | — | 30.2 | 33.0 |
| † For all measures, bolded values are not significantly different from the highest value, which is indicated with an underline. ‡ Variety is not a hard red type. § Average value taken from two samples per variety instead of four |
||||||||
Table 7. Protein concentration of winter wheat at trial locations in 2010, 2011, and 2012.
| Variety | Crude Protein at 12% Moisture (%) | ||||||||||
|---|---|---|---|---|---|---|---|---|---|---|---|
| Old Town, ME | Houlton, ME | Alburgh, VT | Willsboro, NY | ||||||||
| 2012 | 2011 | 2010 | 2012 | 2011 | 2012 | 2011 | 2010 | 2012 | 2011 | 2010 | |
| AC Morley | 8.7 | 8.4 | 10.8 | 9.7 | 8.2 | 10.8 | 9.6 | 12.1 | 9.7 | 10.6 | 13.1 |
| Alice | — | — | — | — | — | 10.9 | 9.8 | — | 9.5 | 11.3 | — |
| Appal. White‡ | 9.2 | 8.9 | — | 9.1 | 9.2 | 11.6 | 9.9 | — | 10.2 | 11.5 | — |
| Arapahoe | 8.9 | 9.8 | 11.0 | 10.0 | 8.4 | 11.0 | 9.6 | 11.2 | 9.4 | 10.6 | 13.0 |
| Banatka | 9.8 | 10.2 | — | 11.8 | — | — | — | — | — | — | — |
| Borden‡ | 8.5 | 8.2 | 10.1 | 9.1 | 8.4 | 10.5 | 9.7 | 9.7 | 9.5 | 9.8 | 12.1 |
| Camelot | 9.3 | 8.9 | 10.7 | 9.5 | 9.4 | 10.5 | 9.2 | 11.1 | 9.3 | 11.4 | 13.1 |
| Expedition | 8.9 | 8.6 | 10.2 | 8.6 | 8.4 | 10.7 | 9.4 | 10.1 | 8.7 | 10.7 | 13.1 |
| Harvard | 9.1 | 8.9 | 9.6 | 9.8 | 8.9 | 11.6 | 9.7 | 9.7 | 10.7 | 11.2 | 12.2 |
| Jerry | 9.1 | 9.6 | 10.9 | 9.9 | 8.5 | 11.4 | 10.4 | 10.7 | 9.9 | 11.5 | 12.7 |
| Maxine | 10.0 | 10.6 | 11.7 | 10.2 | 10.4 | 11.9 | 10.3 | 10.8 | 10.5 | 12.7 | 13.6 |
| Millenium | 9.1 | 9.2 | 10.8 | 9.7 | 8.7 | 10.0 | 9.8 | 10.0 | 9.4 | 10.9 | 12.8 |
| NuEast | 9.2 | 8.9 | — | 8.8 | 8.8 | 10.3 | 8.6 | — | 9.4 | 11.1 | — |
| Overland | 8.9 | 8.4 | 10.5 | 9.5 | 8.2 | 10.2 | 9.7 | 9.6 | 8.4 | 10.9 | 12.8 |
| Redeemer | 11.0 | 10.5 | 11.5 | 12.6 | 10.4 | 12.8 | 12.3 | 12.9 | 11.4 | 13.0 | 14.3 |
| Roughrider | 10.4 | — | — | 13.3 | — | 10.9 | 10.3 | 11.4 | 10.5 | 11.7 | 13.6 |
| Sherman‡ | — | — | — | — | — | 13.0 | 11.8 | — | 11.3 | 13.5 | — |
| Warthog | 8.9 | 8.8 | 10.7 | 10.1 | 8.8 | 11.3 | 10.0 | 11.1 | 10.5 | 12.0 | 13.1 |
| Zorro | 9.8 | 9.7 | 10.6 | 10.8 | 8.6 | 12.3 | 11.0 | 12.1 | 11.2 | 11.3 | 13.1 |
| Site Average | 9.3 | 9.2 | 10.7 | 10.3 | 8.9 | 11.2 | 10.1 | 10.9 | 10.0 | 11.5 | 13.0 |
| LSD (0.05) | 0.5 | 0.9 | 0.7 | 0.8 | 0.9 | 0.6 | 0.9 | 1.5 | 0.6 | 0.7 | 1.1 |
| † For all measures, bolded values are not significantly different from the highest value, which is indicated with an underline. ‡ Variety is not a hard red type. § Average value taken from two samples per variety instead of four. ¶ Average value taken from one sample per variety instead of four. |
|||||||||||
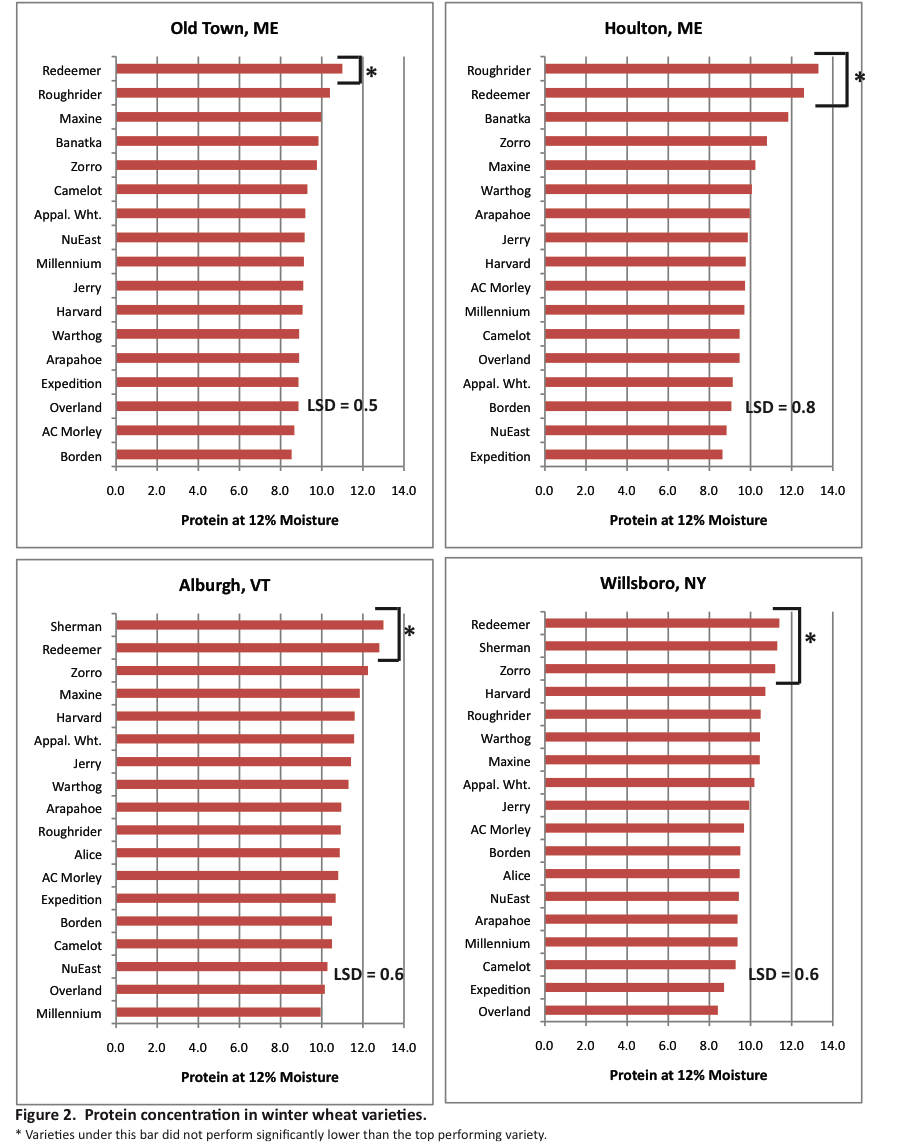
Table 8. DON levels for winter wheat at trial locations in 2010, 2011, 2012.
| Variety | DON (ppm) | ||||||||||
|---|---|---|---|---|---|---|---|---|---|---|---|
| Old Town, ME | Houlton, ME | Alburgh, VT | Willsboro, NY | ||||||||
| 2012 | 2011 | 2010 | 2012 | 2011 | 2012 | 2011 | 2010 | 2012 | 2011 | 2010 | |
| AC Morley | All values were <0.5 for all years at these sites | <0.5 | <0.5 | 0.6 | <0.5 | 0.6 | 0.7 | ||||
| Alice | <0.5 | 1.0 | — | <0.5 | 1.3 | — | |||||
| Appal. White† | <0.5 | 2.0 | — | 0.8 | 2.0 | — | |||||
| Arapahoe | <0.5 | 1.3 | 0.6 | <0.5 | 0.9 | 0.6 | |||||
| Banatka | — | — | — | — | — | — | |||||
| Borden† | All values were <0.5 for all years at these sites | <0.5 | 0.6 | <0.5 | <0.5 | 0.5 | 0.5 | ||||
| Camelot | <0.5 | 1.8 | 0.6 | 0.7 | 1.5 | <0.5 | |||||
| Expedition | <0.5 | 1.3 | 0.6 | 0.6 | 1.2 | 0.8 | |||||
| Harvard | <0.5 | 0.6 | 1.9 | <0.5 | 1.1 | 0.6 | |||||
| Jerry | <0.5 | 0.8 | 2.1 | 0.6 | 0.8 | <0.5 | |||||
| Maxine | All values were <0.5 for all years at these sites | <0.5 | 1.0 | <0.5 | <0.5 | 1.2 | 0.8 | ||||
| Millenium | 0.5 | 1.5 | <0.5 | <0.5 | 1.2 | 1.0 | |||||
| NuEast | <0.5 | 1.2 | — | 0.6 | 2.4 | — | |||||
| Overland | <0.5 | 1.6 | 0.8 | <0.5 | 1.3 | <0.5 | |||||
| Redeemer | <0.5 | 0.4 | <0.5 | <0.5 | 0.7 | <0.5 | |||||
| Roughrider | All values were <0.5 for all years at these sites | <0.5 | 0.6 | 0.6 | <0.5 | <0.5 | 0.8 | ||||
| Sherman† | <0.5 | 0.6 | — | <0.5 | 0.6 | — | |||||
| Warthog | <0.5 | 0.7 | 1.0 | <0.5 | 0.8 | 0.9 | |||||
| Zorro | <0.5 | 1.0 | 0.9 | <0.5 | <0.5 | 0.9 | |||||
| † Variety is not a hard red type. | |||||||||||
Bake Testing
Eleven varieties were chosen to test for baking per- formance based on several criteria, including quantity of grain available, protein (>9%), DON levels (<1 ppm), and falling number (>250 seconds). The varieties chosen were; Appalachian White, Arapahoe, Borden, Expedition, Harvard, Maxine, Millenium, Nueast, Overland, Roughrider, and Warthog. Samples were milled by Gleason Grains in Bridport, VT and each sample was bolted (sieved) with an extraction rate of 92%. Three bakers, Alison Pray (Standard Baking Co. Portland, ME), Jeffrey Hamelman (King Arthur Flour, Norwich, VT) and Randal George (Red Hen Baking Co. Middlesex, VT) ran the bake tests at their respective facilities using a baking and evaluation method that they developed together based on one created by Thom Leonard of Heartland Mills in Kansas. The most notable result from these bake tests was that, of the eleven varieties tested, the bakers found that nine of them were suitable for making a saleable loaf of bread, despite fairly low protein levels for most of the samples. Warthog, Harvard, and Arapahoe performed the best in these bake tests, while Borden and Roughrider were found to be very challenging to work with, and did not produce bread that was acceptable.
DISCUSSION
Wheat grain sold for bread flour can receive up to twice the pay price as grain sold for livestock feed in New England, but the grain must meet higher quality standards. Therefore, when choosing which varieties to plant, it is important to consider their potential to produce grain with acceptable protein, test weight, falling number, and DON levels, as well as their ability to yield well.
Yields in 2012 were higher than in any other year of these trials due to favorable weather conditions and increased nitrogen fertility. Site average yields ranged from 3286 to 4348 lbs/acre, which is well above the typical winter wheat yield for this region of around 2,500 lbs/acre. In contrast, protein levels were similar to protein levels in previous years, and in only a few cases did protein exceed 12%. This is in spite of higher nitrogen rates, and likely due to the extremely high yields. There is a common tradeoff between grain yield and protein, which can be seen not only among the site averages but among the individual varieties as well. Those that yielded the highest in 2012 had lower protein levels than those that yielded less. Over all of the sites and years, varieties that have tended to be the highest yielding are AC Morley, Borden, Harvard, and Warthog. Varieties that consistently have had above average protein levels include Banatka, Maxine, Redeemer, Roughrider, Sherman, and Zorro.
Fusarium head blight can be a major issue in our region. DON levels were quite low in 2012 at all locations with no varieties testing above 1 ppm. In ME, DON levels have been low across all years for winter wheat, perhaps due to flowering occurring before the build up of inoculum levels in these northern sites. In contrast, VT and NY have seen measurable DON levels in winter wheat in previous years. Options for managing the disease in organic systems are limited and include rotation with non-grain crops (i.e. avoiding planting wheat after wheat, corn, or barley and rye), burying any disease-carrying residue, and choosing less susceptible varieties. While no current wheat varieties are resistant to Fusarium head blight, some have shown better tolerance to the disease when it has occurred in VT and NY, with DON levels consistently below 1 ppm. These include AC Morley, Borden, Redeemer, Roughrider, and Sherman.
It may be helpful to compare these results from ME, VT, and NY with results from variety trails conducted in other regions. Ultimately, though, it is important to evaluate data from test sites that are similar to your farm and region when deciding which varieties to grow.
Full reports of the 2010 and 2011 results are available as separate publications.
Acknowledgements: The UVM Extension Crops and Soils Team would like to thank the Borderview Research Farm and the Willsboro Research Farm for their generous help with the trials. We would also like to thank Savanna Kittell-Mitchell, Amber Domina, Chantel Cline, and Katie Blair for their assistance with data collection and entry. The University of Maine Sustainable Agriculture team thanks Dick York of Nature’s Circle Farm for providing his assistance and field in Houlton, the University of Maine Rogers Research Farm, and Joe Cannon, Hannah Griffin, Chris Illingworth, Maggie Lynn, Emilie Seavey, Jess Richards, Erin Roche, and Aaron Englander for their technical help. Information in this publication is provided purely for educational purposes. No responsibility is assumed for any problems associated with the use of products or services mentioned. No endorsement of products or companies is intended, nor is criticism of unnamed products or companies implied.
This research is supported by the U.S. Department of Agriculture, National Institute of Food and Agriculture, Organic Research and Extension Initiative under Award No. 2009-01366, “Enhancing farmers’ capacity to produce high quality organic bread wheat.”
Published and distributed in furtherance of Acts of Congress of May 8 and June 30, 1914, by the University of Maine Cooperative Extension, the Land Grant University of the state of Maine and the U.S. Department of Agriculture cooperating. Cooperative Extension and other agencies of the U.S.D.A. provide equal opportunities in programs and employment. Call 800.287.0271 (in Maine), or 207.581.3188, for information on publications and program offerings from Univer- sity of Maine Cooperative Extension, or visit extension.umaine.edu.