Results from the third COVID-19 Farmer Survey
At the onset of the COVID-19 Pandemic, the Maine farm community was faced with endless uncertainty. Questions about the stability of markets for the season, how much product to plant and plan for, the safety of farm families and crews, and availability of supplies for packaging products and keeping workers safe were all unanswerable and causing significant stress. In an attempt to quantify the shifts that were happening among Maine Farms, to gather data on market trends from the farm gate perspective, and to gather data related to hurdles and stressors of Maine farms, a sub-committee of the Maine Farmer Resource Network formed to develop, distribute, and analyze the Maine Farmer COVID-19 Impacts Survey. Three rounds of this survey were released to gauge trends throughout the season, in early April, early May, and late September. Those results are summarized here.
September 11 to October 2, 2020: 79 Farms
The following is the data analysis from the third Covid-19 Maine Farmer Survey, hosted by the Beginning Farmer Resource Network of Maine, which received 69 responses from September 11 – October 2, 2020. Some of these farmers responded to the previous survey while some are first-time respondents. (See FIRST COVID-19 Maine Farmer Survey Data Analysis (179 responses) and SECOND COVID-19 Maine Farmer Survey Data Analysis (79 responses) for additional data results.)
Data was analyzed for themes by Bo Dennis of the Maine Organic Farmers and Gardeners
Association, Jason Lilley of the University of Maine Cooperative Extension, and Catherine Durkin of Maine Farmland Trust.
They can be contacted at:
Bdennis@mofga.org
jason.lilley@maine.edu
catherine@mainefarmlandtrust.org
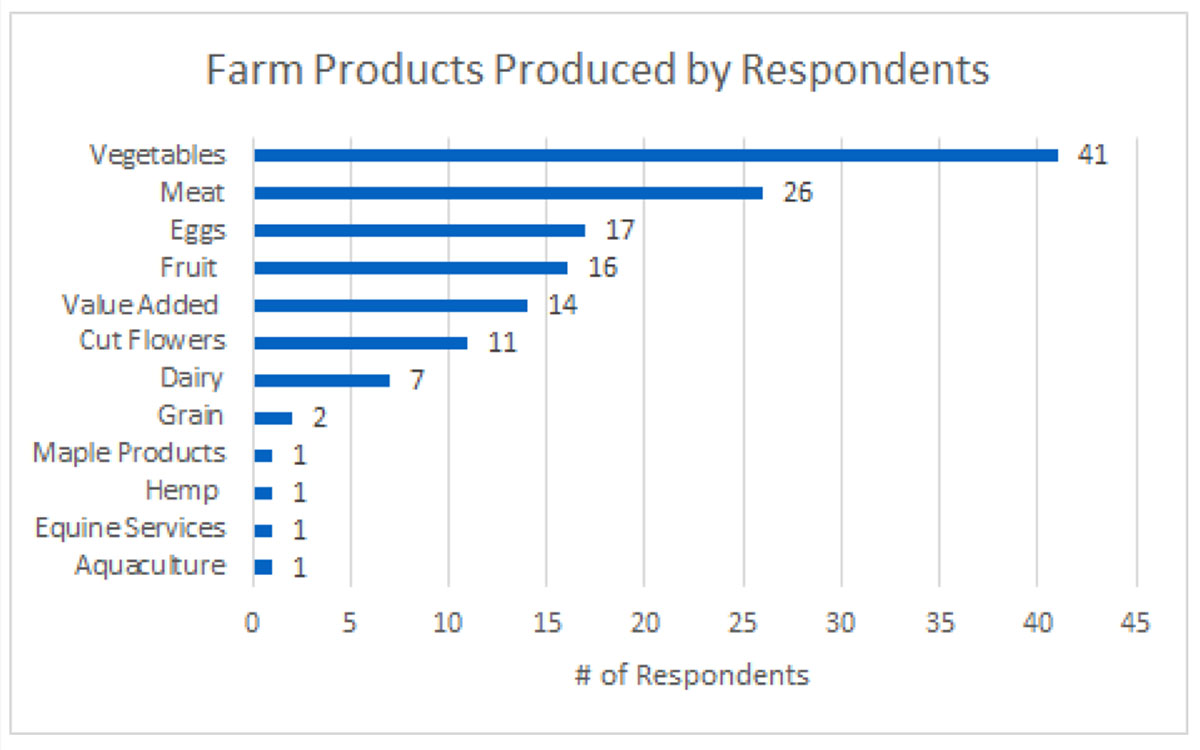
Who Responded
| County | Number of Respondents per County | Number of Respondents per Region |
|---|---|---|
| Androscoggin | 2 | S. Maine 23 |
| Cumberland | 13 | |
| York | 4 | |
| Sagadahoc | 4 | |
| Franklin | 0 | W. Mountains 8 |
| Oxford | 5 | |
| Somerset | 3 | |
| Kennebec | 3 | Central / Mid-Coast 21 |
| Knox | 4 | |
| Lincoln | 5 | |
| Waldo | 9 | |
| Hancock | 4 | Down East 7 |
| Washington | 3 | |
| Aroostook | 1 | Central / Northern 10 |
| Penobscot | 3 | |
| Piscataquis | 6 | |
| TOTAL | 69 | |
Market channel shifts
Sales channels prior to COVID-19
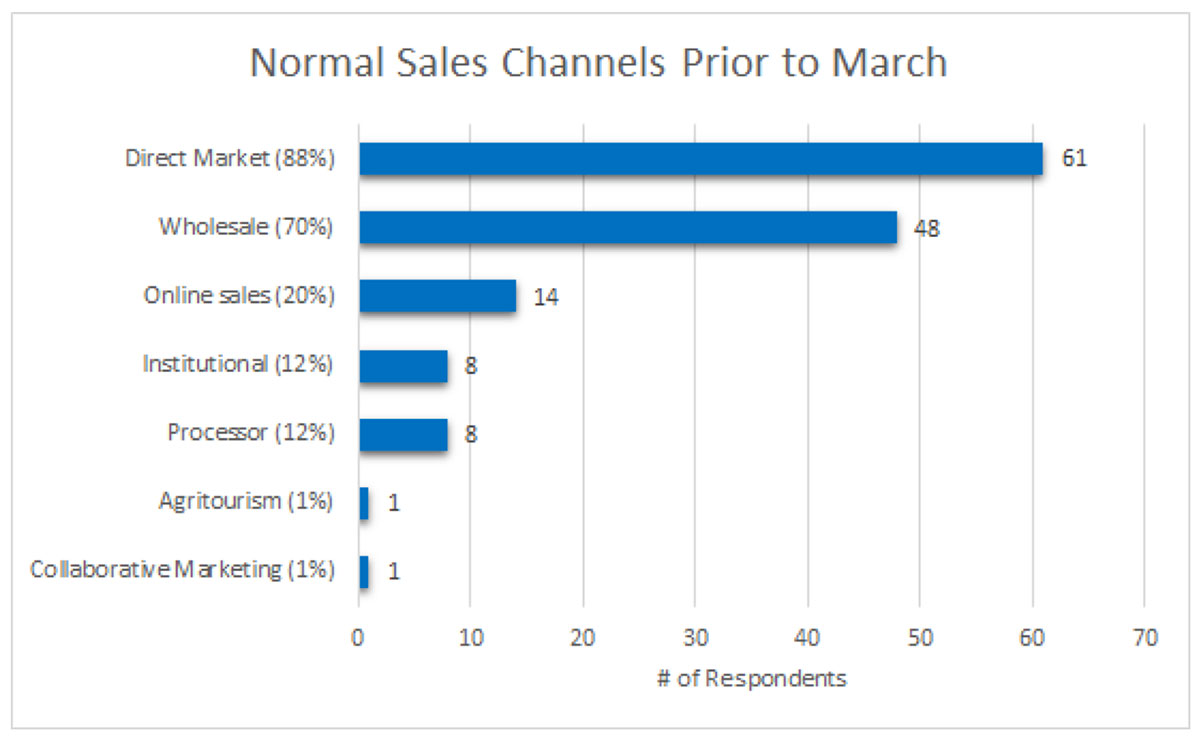
Note: The percentage noted after the marketing types denotes the percentage of respondents who are using that marketing strategy. Most respondents noted several sales channels.
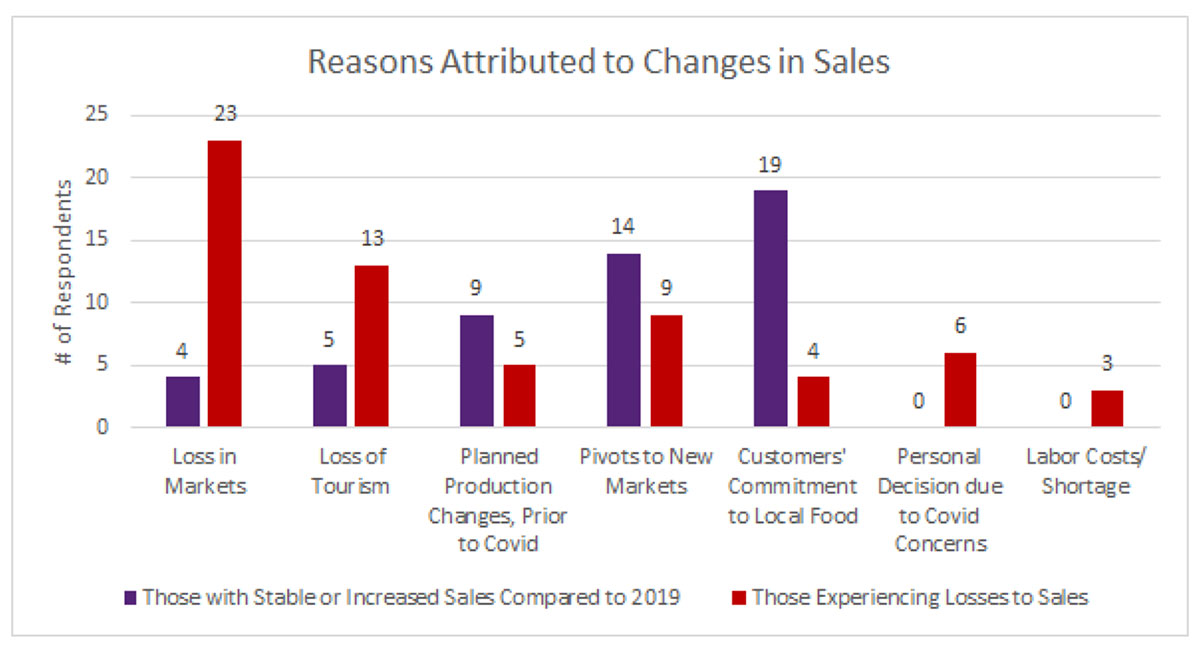
Loss of sales channels

Note: The percentage noted after the marketing type denotes the percentage of respondents who expressed a loss of that marketing strategy. Many respondents noted losses of more than one sales channel. Note that 88% of survey respondents marketed directly prior to March.
One respondent noted the loss of “parts of markets: restaurants but not grocery stores. We lost institutions in March but (they came) back in September.” Another highlighted the disruption to on-line sales and “shipping due to postal service irregularities (and the) attenuated supply chain.”
Shifts to new sales channels
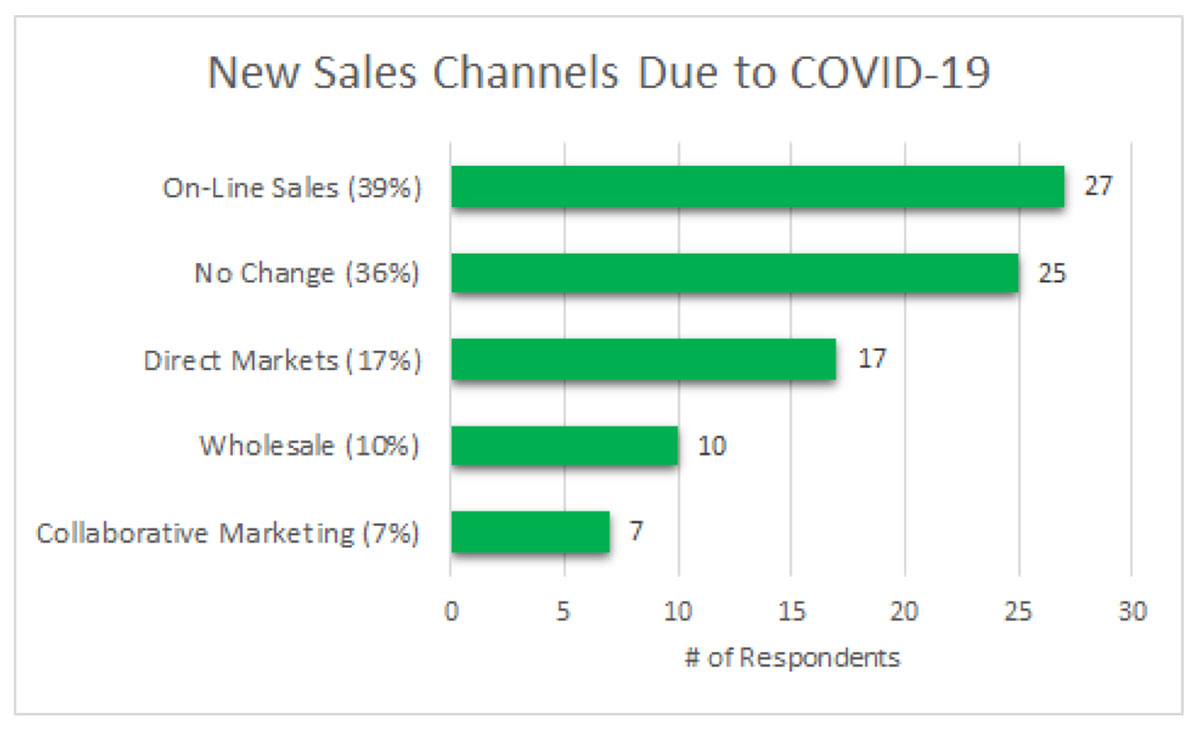
Note: The percentage noted after the marketing type denotes the percentage of respondents who have shifted to that marketing strategy. Many respondents noted the addition of more than one sales channel as a result of COVID-19.
One farm noted the difficulty of integrating an on-line system due to their slow internet speeds, and the negative impact that has on keeping a live inventory.
| Yes | No | Maybe | % Keeping Changes to Specific Market Types (Yes) | |
|---|---|---|---|---|
| Online Sales | 13 | 0 | 7 | 65% |
| Direct Markets | 11 | 1 | 4 | 69% |
| Wholesale | 7 | 0 | 1 | 88% |
| Collaborative Marketing | 5 | 0 | 1 | 83% |
Financial Impacts
Changes in Revenue
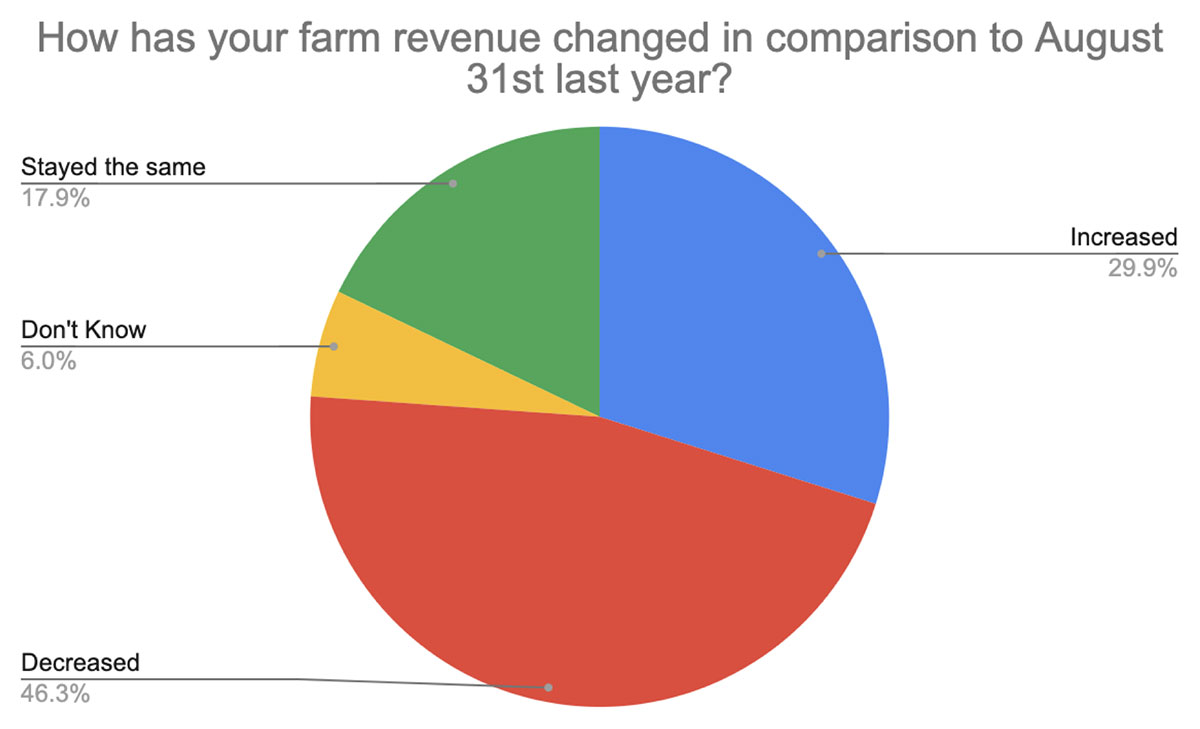
Changes in Gross Sales Amounts
The following are expressed as a percentage of last season’s gross sales as of August 31. ((To date 2020 sales/ to-date 2019 sales) x 100):
- 34% of respondents (who had the data) noted moderate to no changes in their to-date gross sales (75%-125% of last season’s to-date sales (n=21))
- 39% had grossed less than 75% of last year’s sales (n=24)
- 15% had grossed more than 125% of last year’s to-date sales as of August 31, meaning they had increased sales from last season (n=9).
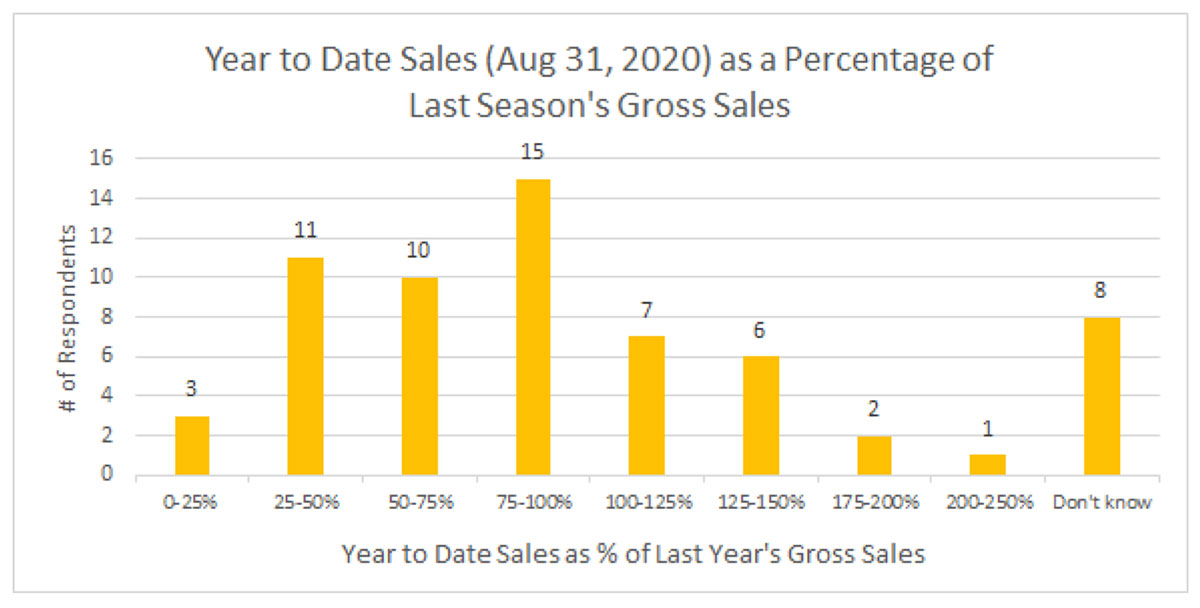
Note: 100% = no change in sales from last year to this year. Ex.) If a respondent sold $7,500 this year and $10,000 last year, by August 31st, that would be 75% of last years sales). (2020 gross sales / 2019 sales (thru Aug 31)) x 100.
Financial Support Programs
- All respondents who applied for various assistance programs received support from at least one, if not more, programs. Note: To what extent farmers’ expressed need was met by the support programs, we are unaware.
- 55% of the responding farms had not applied for support
- Of that 55%, 45% had not looked for support.
- When asked what issues have been encountered in seeking support for their business, 39% of total respondents said they were ineligible for support programs, 30% said confusing messaging and 29% said paperwork was a barrier.
Policy
The following are policy and program areas farmers would like prioritized to mitigate COVID’s impact on farm businesses:
- Local promotion and advertising support of local food
- Incentives to promote local purchasing by individual consumers, institutions, and restaurants
- Health care
- Housing support such as deferred mortgage payments and affordable rentals for farm workers
- Reimbursements for COVID related supplies
- Reliable internet access in rural areas
- Less restrictive and easier grant processes
- FSA creating a working capital fund to quickly adapt to infrastructure needs with COVID related market channel shifts
- More small processors that are state inspected for processing livestock
- Public enforcement of safe COVID practices such as mask wearing and social distancing
Stress
- 74% of respondents noted an increase of stress this growing season compared to last year with top stressors being changes in the market due to COVID (63%), drought or other weather events (73%), and changes to farm income and expenses due to COVID (48%).
Online programming
- 87% of respondents are likely to attend online educational programming with Monday- Thursday being the best days for engagement in these offerings. Afternoons and evenings are the best times.
- The biggest barriers to accessing online programming included childcare (24%), internet connection/ tech comfort (20%) and capacity (40%).
General needs
- 67% of farmers noted a difficulty in accessing personal protective equipment including hand sanitizer.
- People expressed ordered items taking longer to ship and higher prices.
- There is a desire for more grants to support farmers with less restrictions
- Future support farmers need to continue to navigate COVID-19 is spread fairly evenly across areas, including:
- 23% said financial support
- 19% said purchasing contracts from buyers for market assurance
- 33% said marketing assistance
- 22% said guidance around physical health and safety
- 16% said labor support
- 16% said mental health support