Spring 2022
Maine Spring 2022 Climate Summary
By Dr. Sean Birkel, Maine State Climatologist
Highlights
- The 2022 spring (March–May or MAM) was 11th warmest and 48th wettest since 1895.
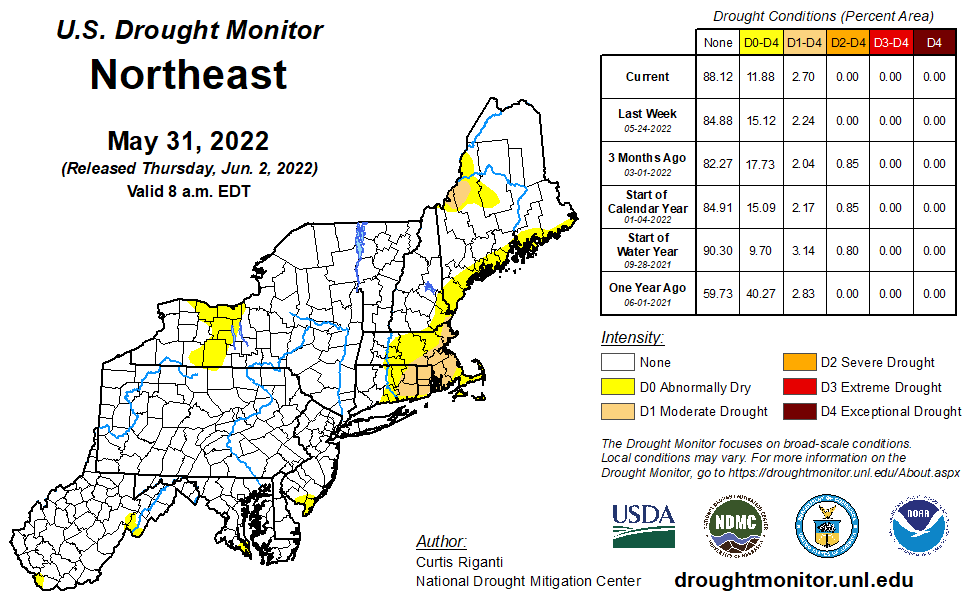
- As of the end of May, abnormal dryness or moderate drought affected only about 12% of Maine, and near-normal conditions were found elsewhere. (Update 7/15/2022: Precipitation deficits have developed over the past month such that abnormal dryness or moderate drought is now seen across about 75% of the state. The most recent drought information can be found on the Northeast Drought Early Warning System Dashboard.)
- Global 2022 MAM average temperature tied 2018 for 6th warmest since 1880, despite persistent cool conditions across the eastern Pacific in association with La Niña.
- Arctic sea ice extent at the end of May ranked 14th lowest for this time of year in the record of continuous satellite observations.
Statewide Overview
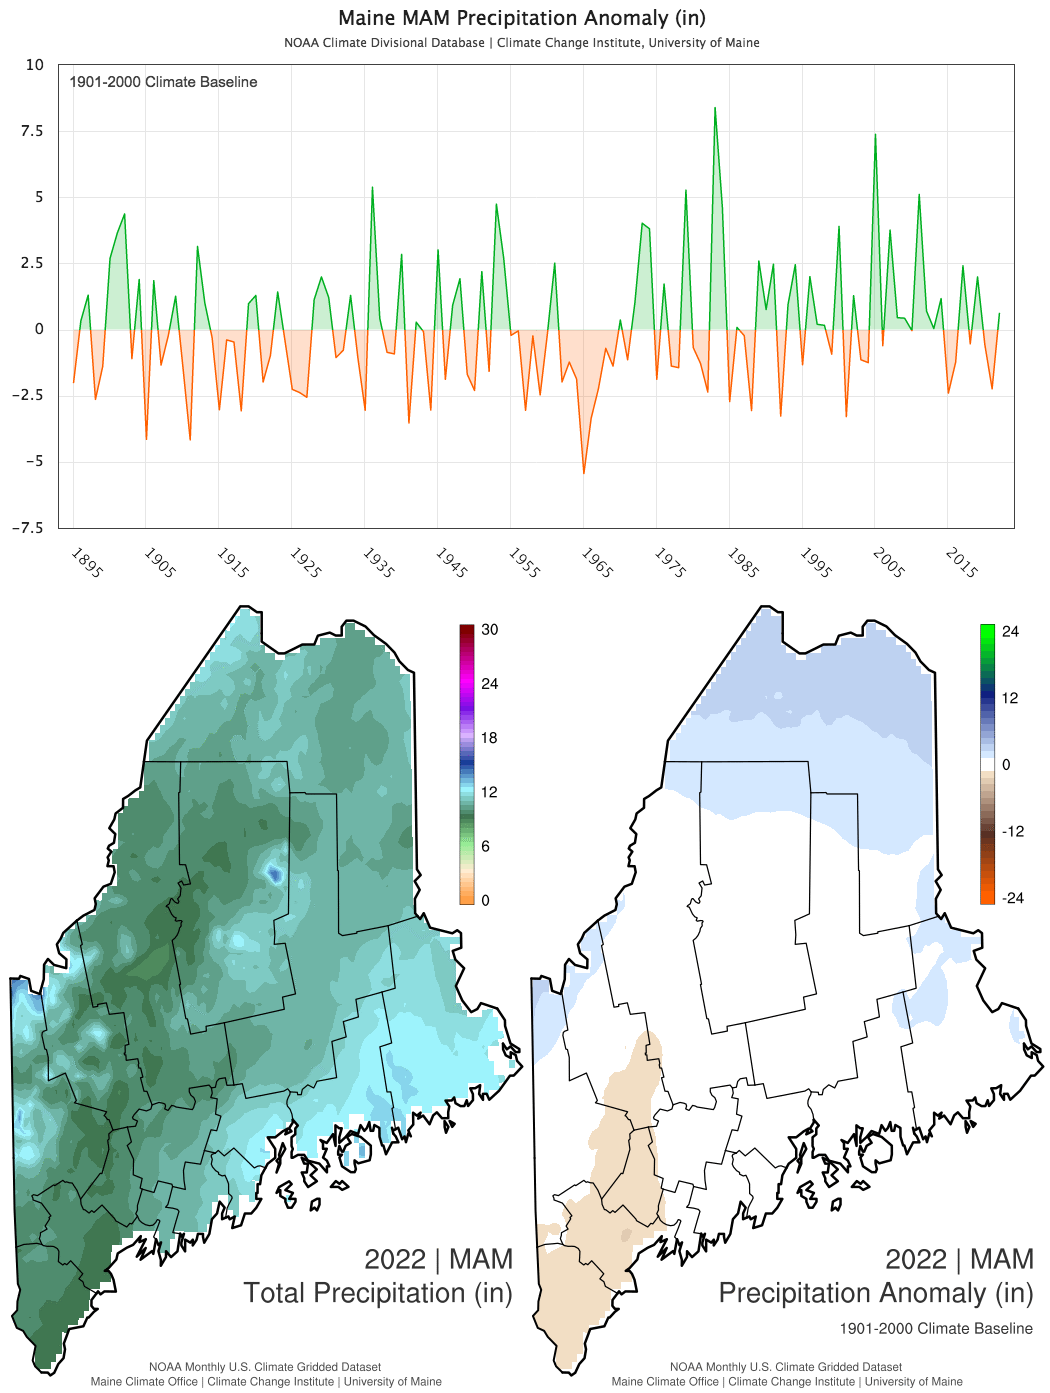
The Maine statewide climatological 2022 spring (March–May or MAM) average temperature was 41.4°F, or 11th warmest (tied with 1981) on record for the 128-year period beginning 1895 (Fig. 1). This temperature is 0.4°F cooler than for the same period in 2021, and 3.1°F above the 1901-2000 historical mean. The observed MAM total precipitation was 10.7 inches, or 48th wettest (near normal) for the record period (Fig. 2). This precipitation amount is 2.9 inches more than for the same period in 2021, and 0.6 inches above the 1901-2000 historical mean.
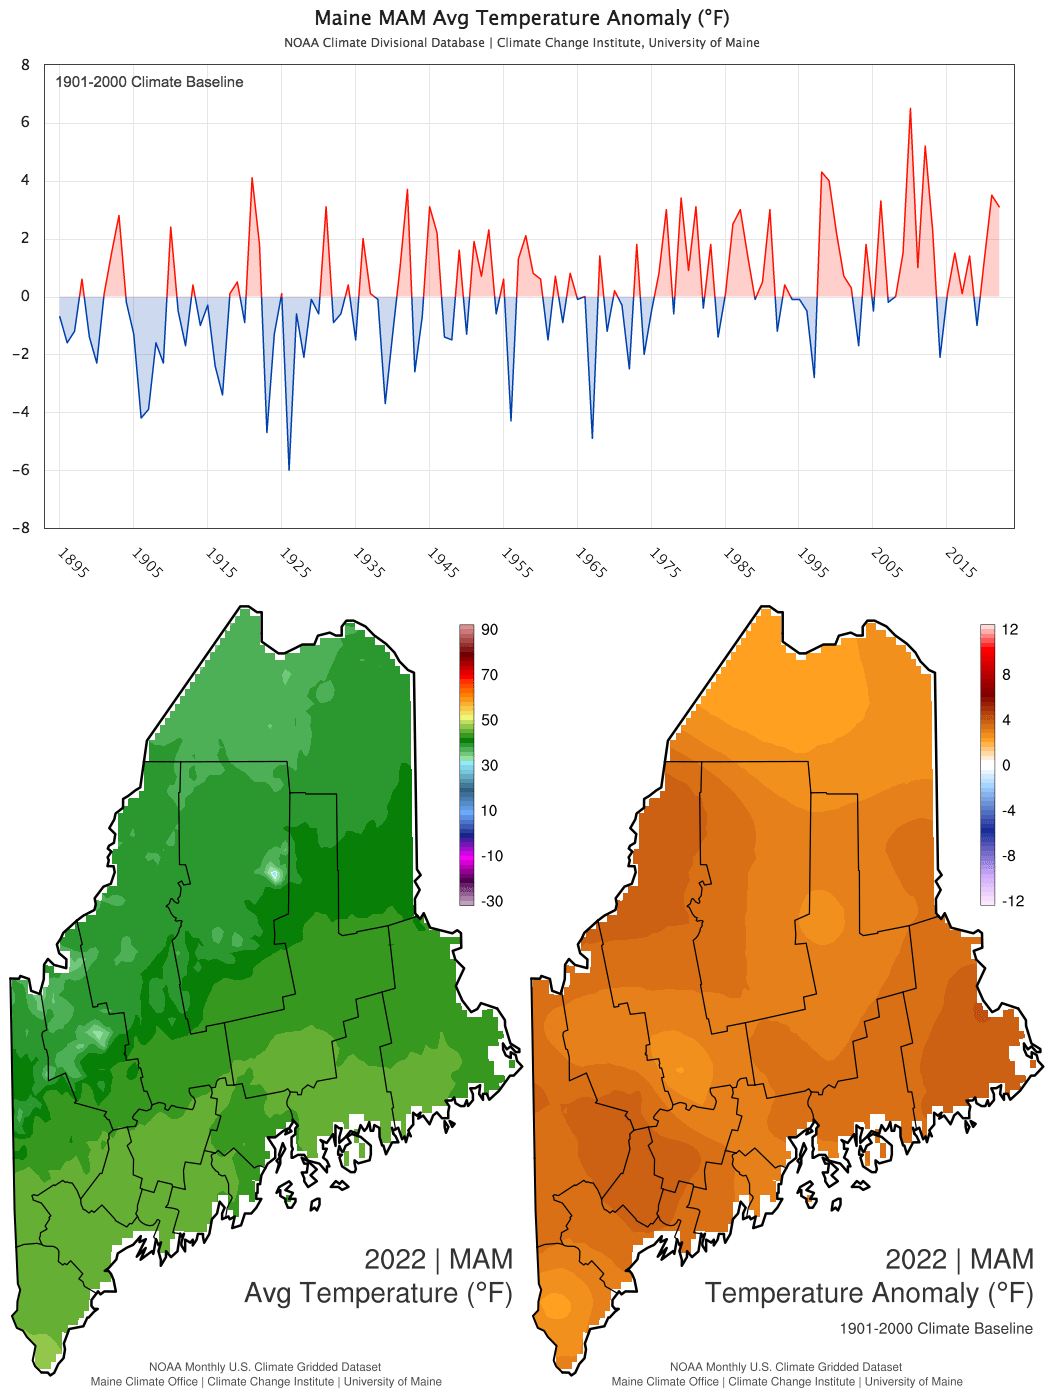
| Temp / Anom (°F) | Rank | Precip / Anom (in) | Rank | |
|---|---|---|---|---|
| MAM | 41.4 / +3.1 | 11th warmest | 10.7 / +0.6 | 48th wettest |
| Mar | 29.0 / +3.1 | 30th warmest | 3.4 / +0.1 | 59th wettest |
| Apr | 40.7 / +2.4 | 26th warmest | 4.5 / +1.1 | 24th wettest |
| May | 54.4 / +3.9 | 11th warmest | 2.8 / -0.6 | 49th driest |
| Mar | Apr | May | MAM | |
|---|---|---|---|---|
| Highest Maximum Temperature | 3 | 0 | 40 | 43 |
| Lowest Maximum Temperature | 10 | 2 | 1 | 13 |
| Highest Minimum Temperature | 13 | 5 | 32 | 50 |
| Lowest Minimum Temperature | 2 | 0 | 2 | 4 |
| Highest Precipitation | 4 | 14 | 3 | 21 |
Precipitation/Drought
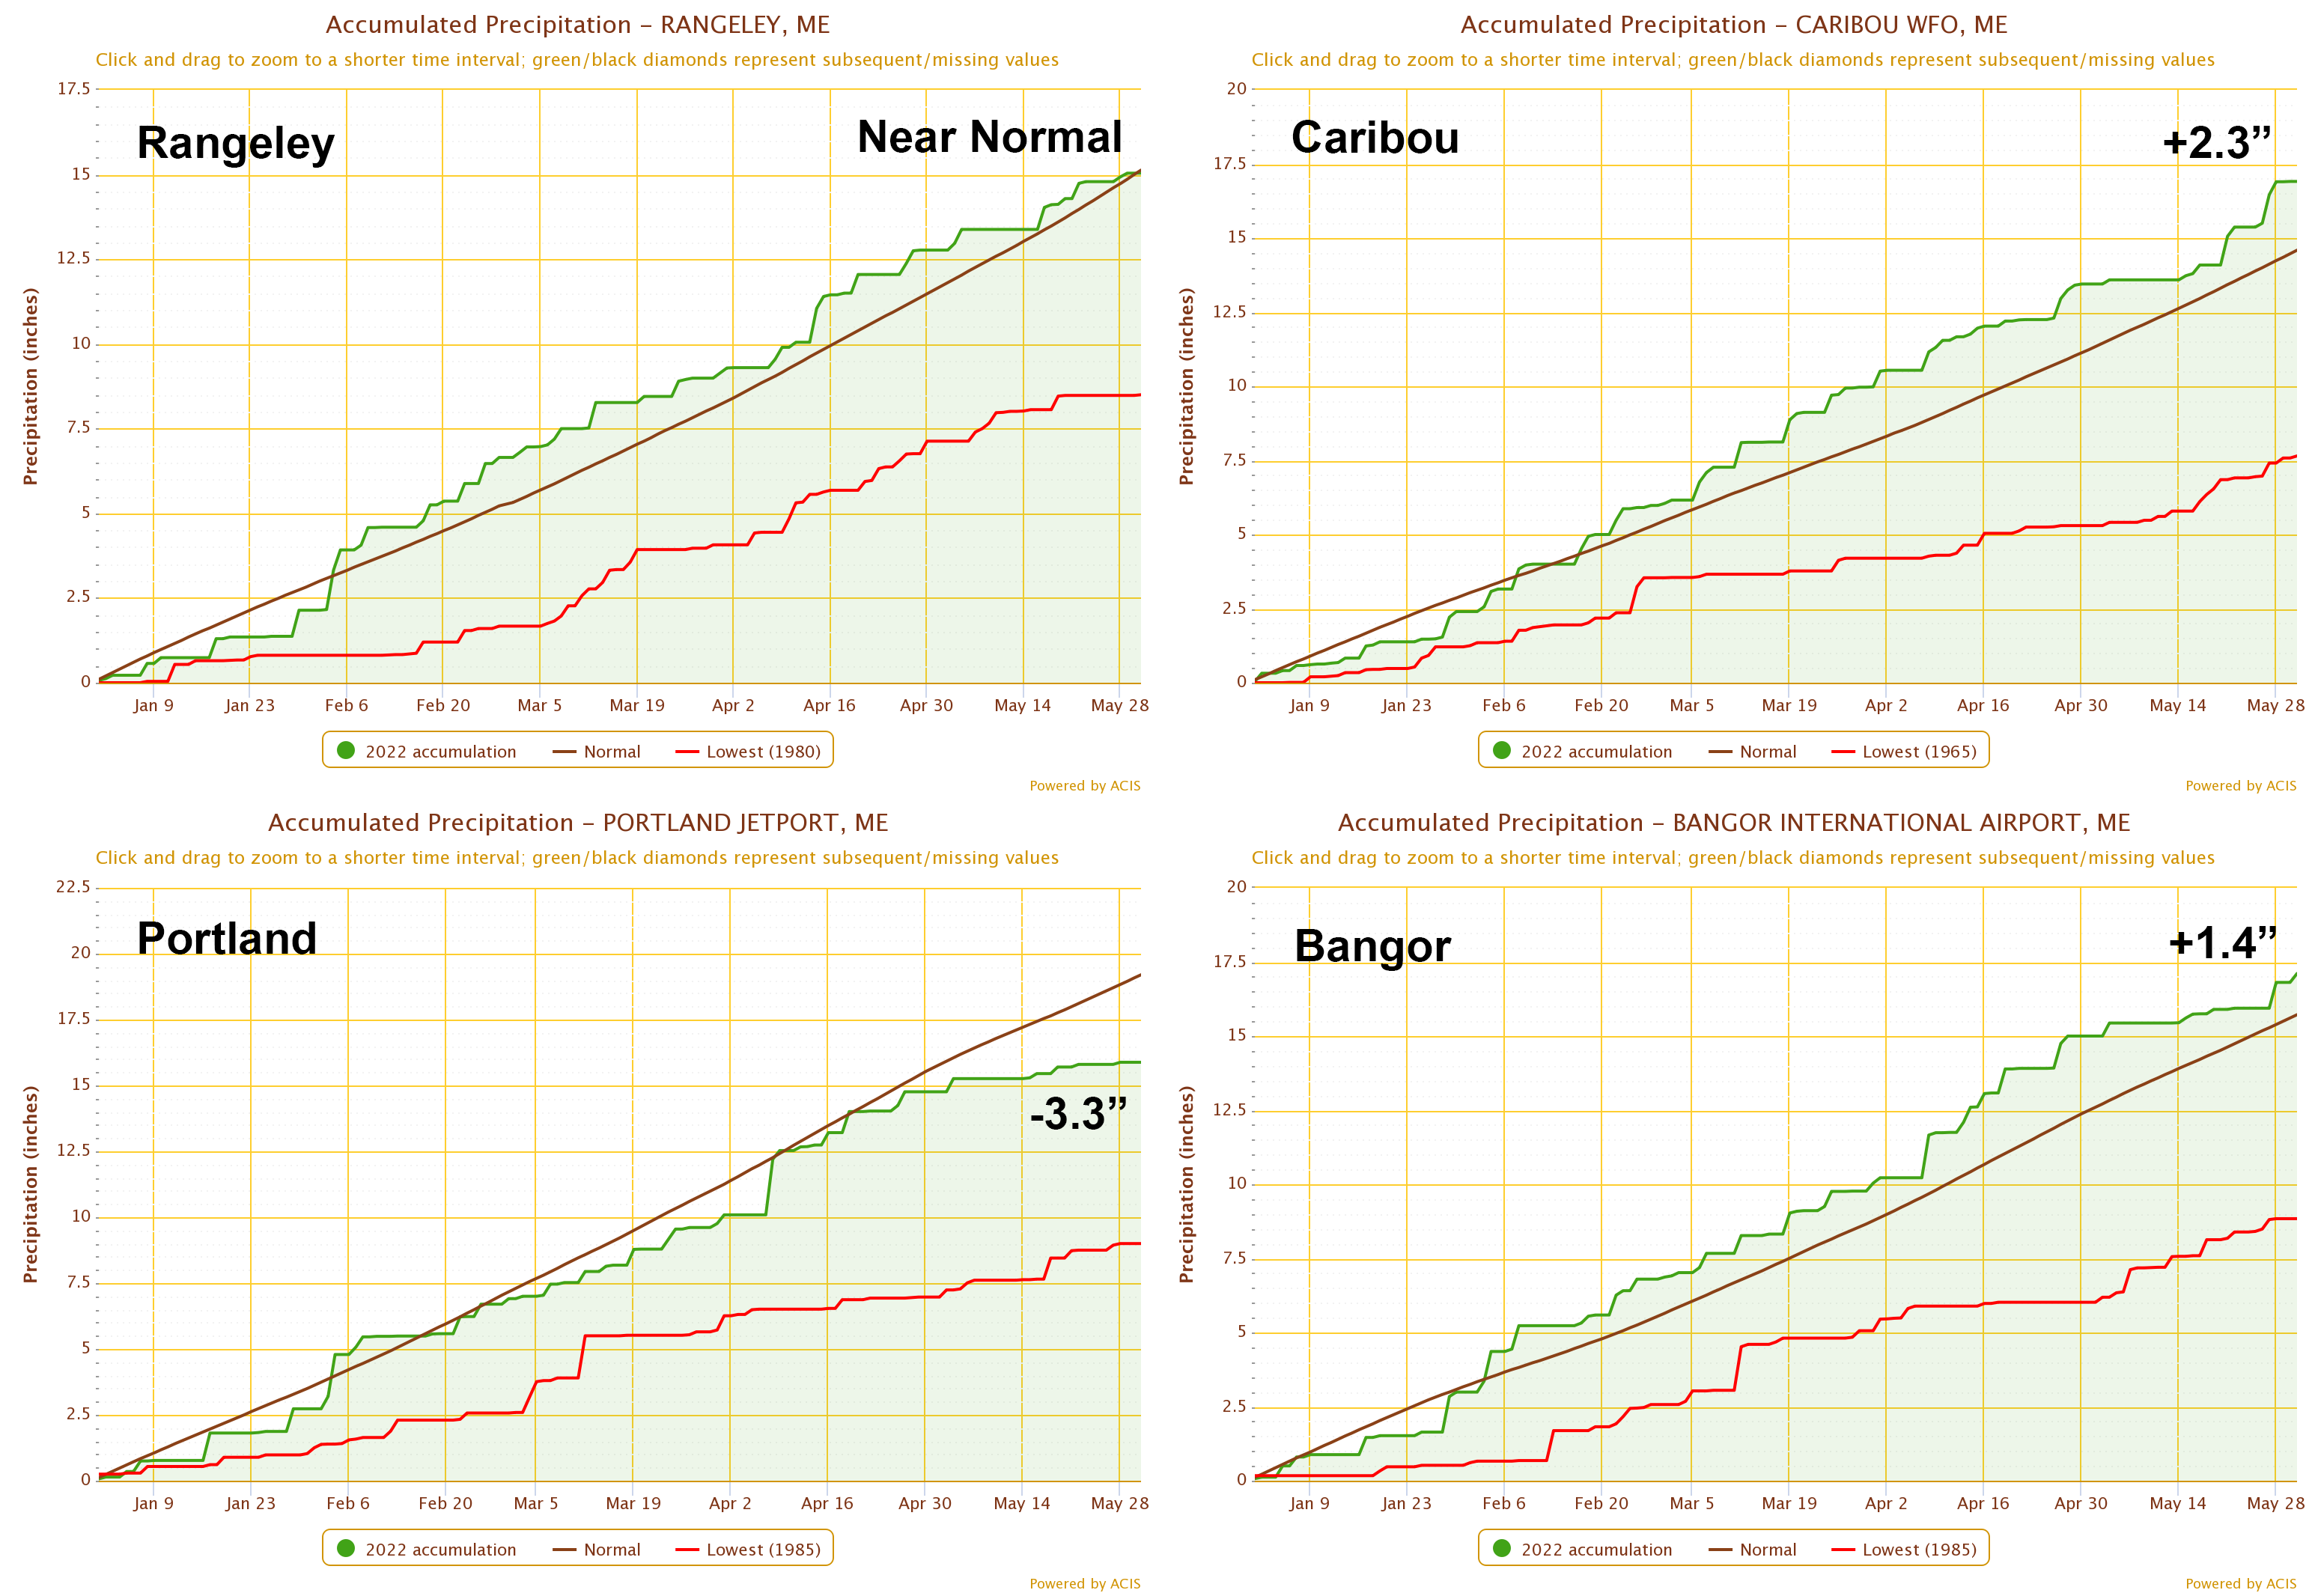
As of the end of May, abnormal dryness or moderate drought affect only about 12% of Maine (coastal zone and western Maine mostly in the upper portions of Franklin an Somerset counties), and near-normal conditions are found elsewhere as shown by the U.S. Drought Monitor (Fig. 3). Precipitation accumulation graphs (1 January – 31 May) for individual observation sites show a rainfall deficit of 3.3 inches in Portland, surpluses of 1–2 inches in Bangor and Caribou, and near-normal conditions in Rangeley (Fig. 4). The small area of moderate drought in western Maine relates to less winter snowfall than usual, relatively early spring melt, and some dryness signal carryover from 2021. The abnormal dryness depicted along the coast is associated with recent precipitation deficits.
Update 7/15/2022: Despite recent rainfall, much of Maine continues to see overall precipitation deficits that are causing reductions in soil moisture, streamflows, and groundwater levels. The U.S. Drought Monitor shows about 20% of the state in abnormal dryness, and about 55% in moderate drought. Precipitation deficits are generally largest across the southwestern quarter of the state. For example, the accumulated rainfall in Portland since May 1st is about 6 inches below normal. In contrast, rainfall across Aroostook County and the northernmost parts of Penobscot and Piscataquis counties has been near or above normal with some areas having accumulation surpluses. For the most recent information visit the Northeast Drought Early Warning System Dashboard.
Looking Farther Afield
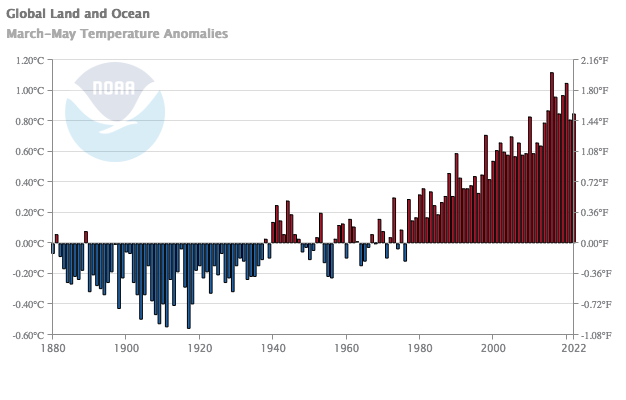
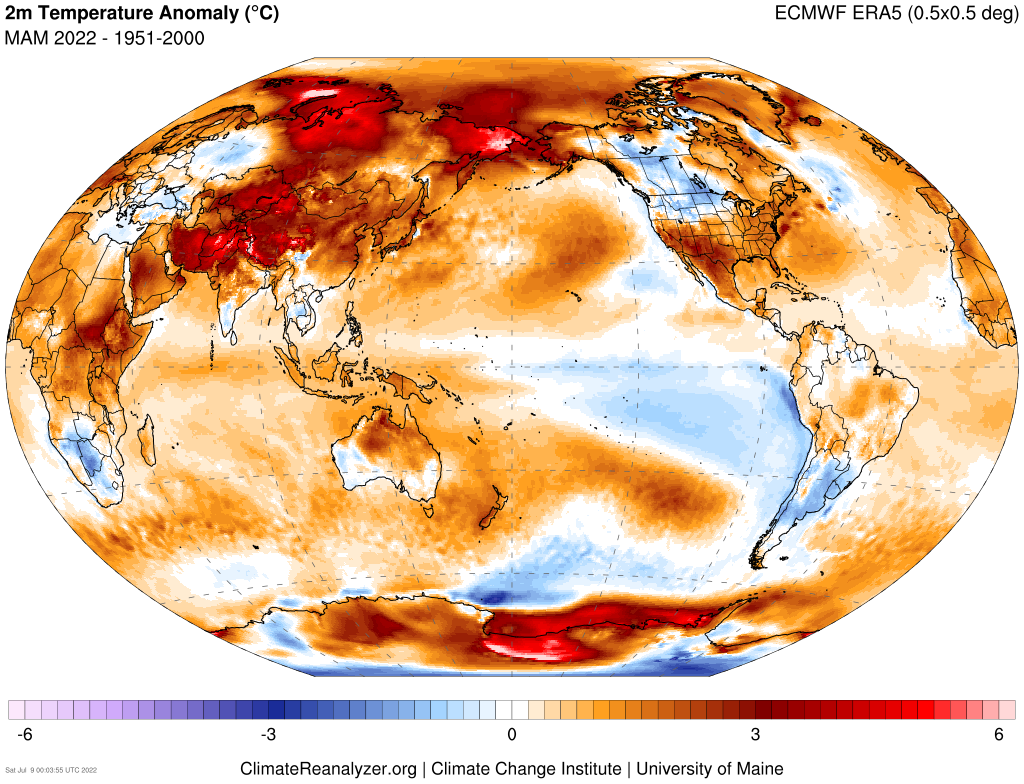
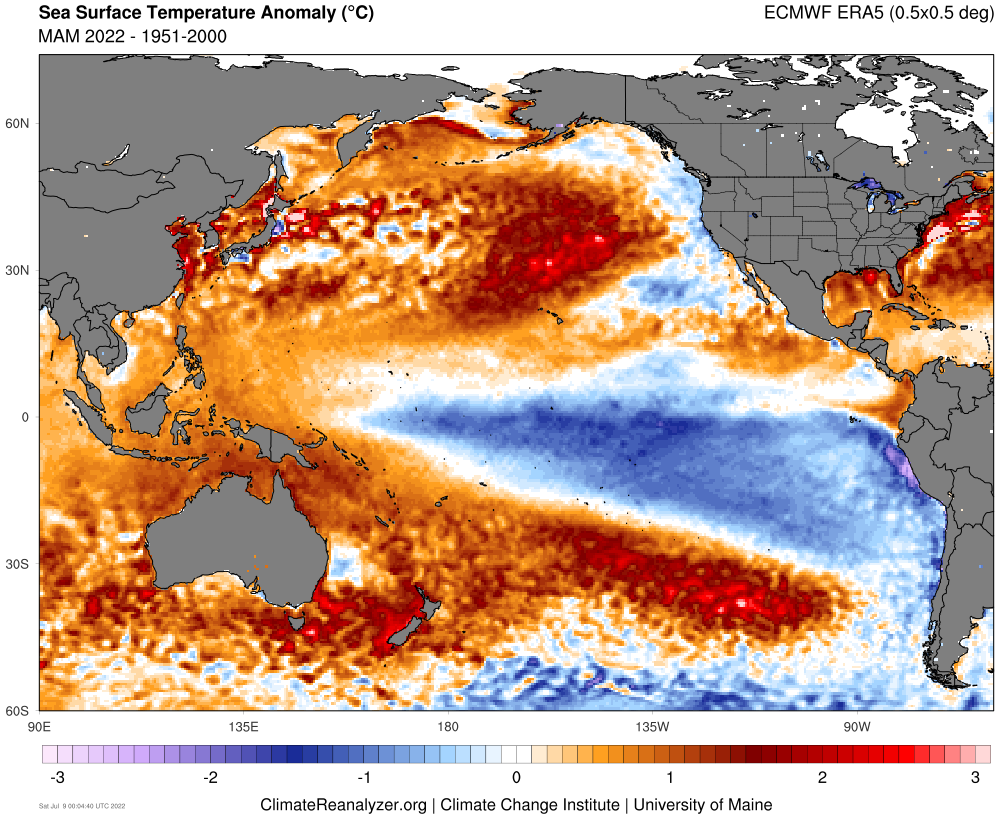
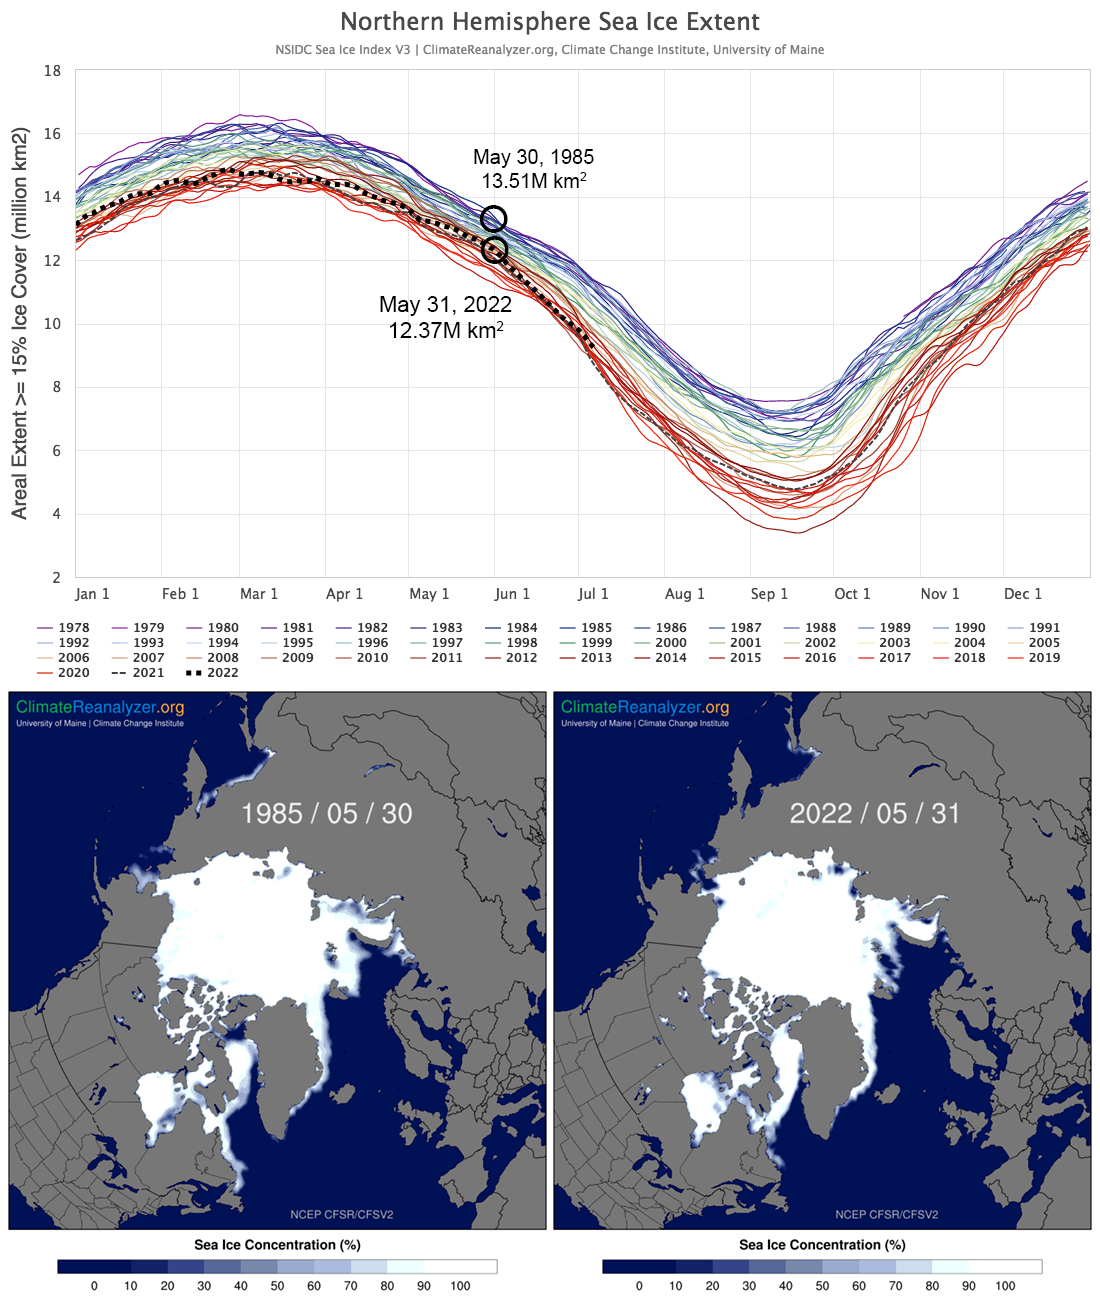
The 2022 MAM global average near-surface temperature ties 2018 for 6th warmest on record since 1880 (Fig. 5). A map of the global distribution of MAM temperature anomalies shows particularly warm values over central Asia, the Russian Arctic, and the Ross Sea region in the Antarctic (Fig. 6). The prominent pattern of cool anomalies off the western margins of North and South America and stretching across the equatorial Pacific are associated with La Niña, which may persist for several months and possibly affect climate for a third year in a row (Fig. 7). In the Arctic, sea ice extent at the end of May is 12.37 million km2, ranking 14th lowest for this time of year since continuous satellite observations began in late 1978.
Maine historical climate data and current weather forecasts are available on the Maine Climate Office website. For U.S. and global climate and weather data, visit Climate Reanalyzer. The Maine Climate Office and Climate Reanalyzer are developed and maintained by Dr. Sean Birkel, the Maine State Climatologist and Assistant Extension Professor at the Climate Change Institute and Cooperative Extension at the University of Maine.