How warm is warm? Or, how to know when is warm not so surprising…

By Dr. George L. Jacobson, Maine State Climatologist
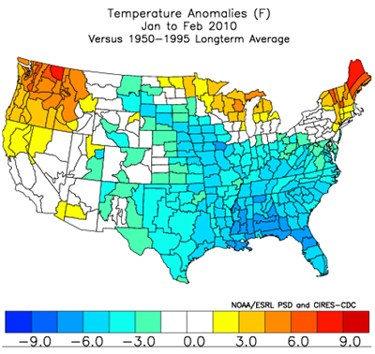
This year has been interesting. We had a warm winter, a warm early spring, a warm dry summer, and a rather wet September. Last winter’s weather was unprecedented in modern history in two ways: the warmth of November through May and the lack of snow after the middle of January. This map shows the temperature departure from the long-term average for last January-February; red areas were warmer than average and blue areas were colder than average.
 Some of the warmth can be attributed to El Nino. Despite the apparent radical departure from normal in Maine, a warm winter was expected, given that this was an El Nino year when warm ocean currents along the coast of Peru replace the usual cold waters that typically upwell to the surface.
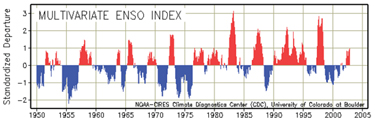
The figure below shows the departure from normal temperatures over time; the warm El Nino events are in red.
 The influence of El Nino conditions extends across the Pacific to Indonesia and along the coast to Central and North America. Last year, the El Nino warmth had British Columbia trying their hardest to host the Winter Olympics in warm, rainy weather instead of winter’s usually cold and snow.
Does El Nino explain all of the heat? Compared to all winters of the past century, last year was among the top three warmest. Ice-out on Maine lakes was earlier than in any recorded year, and some golf courses even opened five weeks earlier than usual! But when last winter is compared only to the nine most recent El Nino years, it was just slightly warmer. The map on the left shows the departure from normal winter temperatures during previous El Nino events.
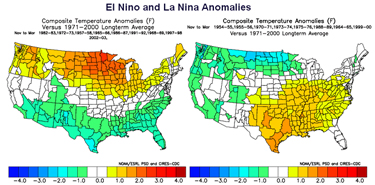 The 2009-2010 El Nino has ended, and the cycle has swung in the other direction, toward La Nina. As shown by the map on the right, La Nina winters are not significantly warmer or colder than normal, and so this coming winter might be much more “typical” (or what many would call a real Maine winter).
These weather patterns are just one aspect of long-term variability in the Earth’s climate system. The variability is sometimes cyclical, as in the case of El Nino-La Nina or even ice ages, which occur about every 100,000 years. Short-term cycles superimposed on long-term cycles like ice ages create complex patterns.
We certainly can’t say that last winter—or any one season—was unusually warm only because of greenhouse gases, but it is also quite possible that record heat is linked to the vast amount of heat-trapping gases that have been added to the atmosphere in recent decades. We won’t know for sure until enough time has passed to give us a long-term perspective.
Model projections of what Maine might be like during coming centuries indicate that the warm winter of 2009-2010 might well be what is considered normal at the end of the century. Readers who wish to learn more about changes that might be on the way are invited to read Climate Highlights from Around Maine: Maine’s Climate Future: Coastal Vulnerability to Sea-Level Rise. In upcoming months we will delve further into the causes of long-term and short-term variability in the Earth’s weather and climate.