Winter 2013: An Introduction
By George L. Jacobson, Maine State Climatologist, Professor Emeritus Climate Change Institute
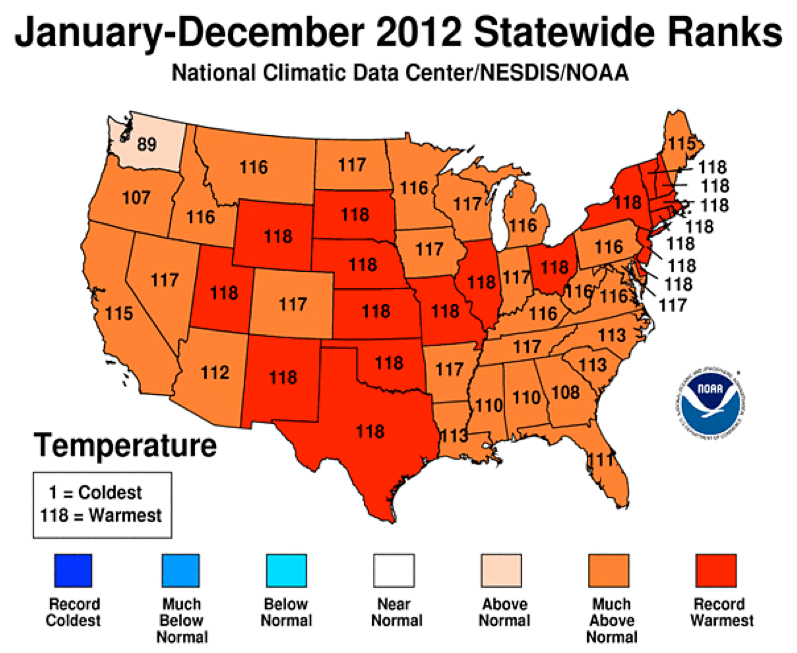
NOAA reports that 2012 was warmest for contiguous United States
Our national agency with the most responsibility for tracking and predicting weather and climate is the National Oceanic and Atmospheric Administration (NOAA). The various components of this important unit include the National Weather Service (NWS) as well as a number of other data-collecting organizations that, collectively, provide a local, regional, national, and global perspective on the conditions that have prevailed on land and sea. Perhaps even more important, the NWS develops and communicates the weather forecasts that we all use in preparing for our upcoming days and weeks. As devastating as the “megastorm” Sandy was for the NY/NJ coastal areas, the damage and loss of life surely would have been far, far worse had the NOAA forecasters not alerted everyone that something very serious was about to occur. (Although the public today receives weather forecasts from numerous media and web-based outlets, it is important to know that all of these get their data and essential forecasts from the NOAA/NWS professionals.)
In addition to providing weather data and forecasts, NOAA has developed a strong capacity for collecting and analyzing climate data – that is, the long-term, integrated perspective on weather data. NOAA now has a wide range of climate reports, some of which look back at the recent months and years, others that include much longer, even geological, time spans.
The National Climatic Data Center’s monthly “State of the Climate” reports provide useful perspectives on how recent weather patterns and trends compare with the past century or slightly longer.
For example, the November 2012 State of the Climate report included highlights such as:
“Global temperatures were fifth highest on record for October and sixth highest for November. Once the final data are compiled, 2012 is almost certain to have been the warmest calendar year in the past 130 years of record keeping.”
“Arctic sea ice doubled in area from September to October (as would be expected during the beginning of the long period of low light in the far north), yet remained the second lowest on record for October. At the end of September sea ice was at the lowest extent since satellite data began to be collected in 1979.”
“The globally-averaged temperature for November 2012 marked the fifth warmest November since record keeping began in 1880. November 2012 also marks the 36th consecutive November and 333rd consecutive month with a global temperature above the 20th-century average.”
“For a statewide perspective, we can also learn that November 2012 was the second warmest on record for Caribou, Bangor, and Portland and that the year 2012 as a whole was the fourth warmest on record.”
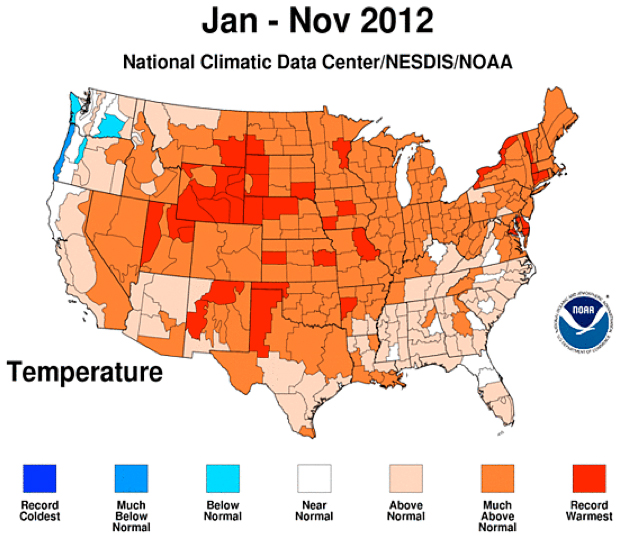
The various NOAA reports also include a number of graphical summaries of the data, and often these are the easiest way to see the patterns and variability. For example, the map below indicates the 2012 temperature comparisons by “climate zone.”
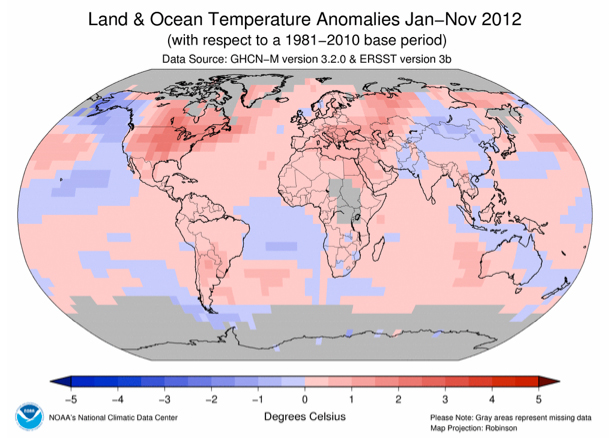
Global temperature anomalies tell a related story. The red areas on the figure below indicate regions in which the 2012 temperatures (through November) were higher than the past 30-year “normals.” The darker reds of the US, Canada, and most of Europe, for example, reveal that the temperatures in many areas were approaching 2oC (almost 4oF) warmer than the means for the past 30 years, which were themselves warmer than the means for preceding times.
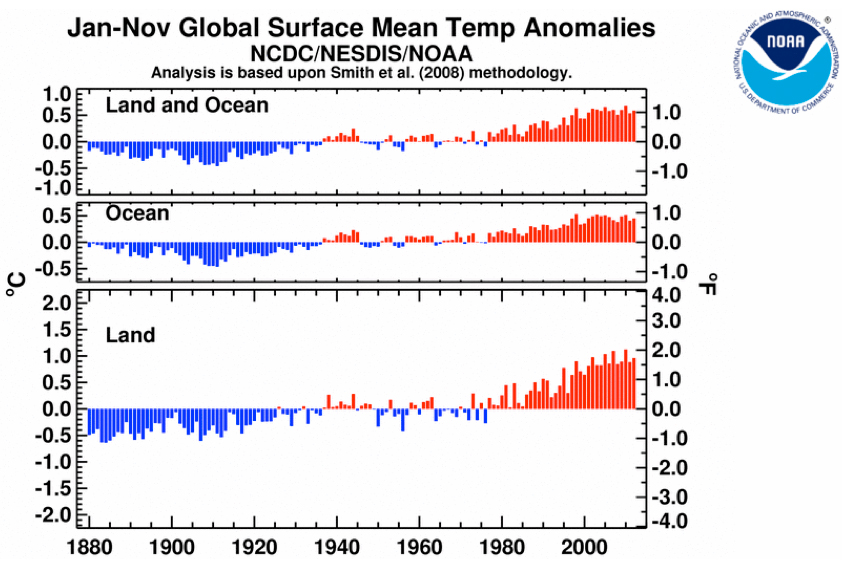
Data from the US and the rest of the world reveal how the global land and sea temperatures have varied over the past 130 years. The figure below shows in blue the years that had temperatures cooler than the 20th Century average; years in red were warmer than that average.
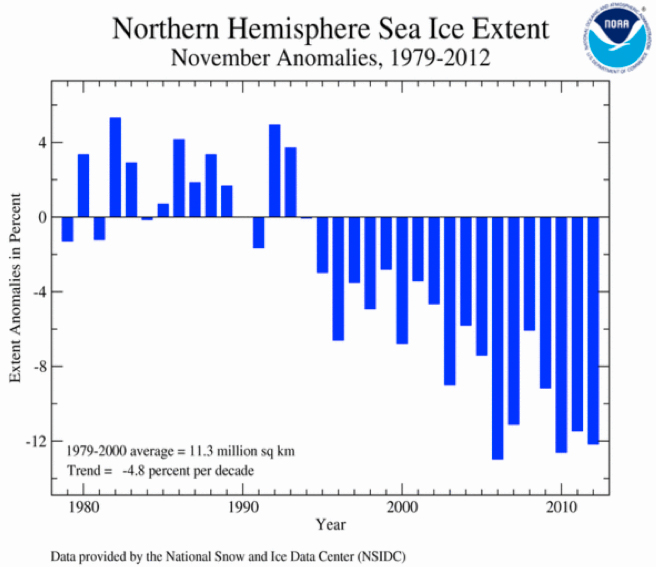
Or, we can examine the changes in extent of Arctic sea ice over the past 30 years. Earlier we noticed that the end of September had the least ice since satellite observations began in 1979. Each autumn, the decreasing light and heat from the sun leads to the creation of new sea ice. Nevertheless, as illustrated below, the total area of sea ice in November had still not recovered to the levels common in 1979 and for many years before that.
These graphics represent just some of the many different perspectives on the same phenomenon: a climate change story dominated by warmth in recent decades.
Boundary conditions as predictors of climate trends
The NOAA State of the Climate report for 2012, released in January 2013, gives an excellent summary of the statistics and events of the past year. Among other things, the report illustrates that this past year was the warmest in the period of record keeping for the contiguous United States (the lower 48). The year 2012 was the fourth warmest for Maine, but many parts of the country had record temperatures. And as reported in the news during the past summer, extreme drought continued to affect much of the mid-continent.
What do these trends mean?
We could look at many more maps and tables to see similar trends and patterns throughout the world. Instead, let’s look at the kinds of changes that have been taking place as precursors to the weather patterns and, eventually, the climate of the coming decades. In an important global sense, the land and ocean temperatures, sea-ice extent, snow cover on the land in the springtime, extent of glacier ice in the northern and southern hemispheres, and other such measures may all be looked at as “boundary conditions” for the upcoming weather. Meteorologists and climatologists understand that these boundary conditions are important components of the context in which the physics of the atmosphere and oceans will act.
For example, sea ice has historically covered much of the Arctic Ocean connected Eurasia and North America and Greenland, essentially forming a huge polar “continent” that produced extreme cold air masses. Those are the systems that move south in the winter across Canada, the northern US, Scandinavia, Russia, and Siberia (and occasionally much farther south). But if the Arctic Ocean has more open water and less sea ice, as has been the trend lately, then the weather systems produced there will have a strong maritime influence, and fewer of the deep cold systems will be produced (or at least they will span a shorter portion of the winter season).
Thus, warmer ocean temperatures influence everything from the formation, strength, and paths of hurricanes in low latitudes, to the amount of moisture delivered to the continents, to broad patterns of atmospheric circulation, including arctic air masses.
In fact, the lowered extent of Arctic sea ice last year might have contributed to the fact that the first few months of 2012 were unusually warm in most of the United States. Further analysis (and probably more data) will be required to document that connection, but it is certainly true that changing ice conditions in the Arctic will have large influences on the future weather and climate of the Northern Hemisphere. Next summer, it will be interesting to review the current winter to see whether the low area of sea ice last autumn had an influence. Obviously, much is to be learned about the precise consequences of losing the Arctic ice, and the next few years will probably provide important insights.
Many other factors and processes are involved in producing Maine’s weather, of course. But changes in the global environment (oceans, vegetation, snow cover, sea ice, etc.) inevitably have a great influence. Thus, keeping an eye on the boundary conditions mentioned above is useful for helping us to anticipate the general trends and patterns of our weather and climate in the coming months and years.