Calendar Year 2021
Maine 2021 Calendar Year Climate Summary
By Dr. Sean Birkel, Maine State Climatologist
Highlights
- The 2021 calendar year was 2nd warmest and 39th driest in Maine based on observations beginning 1895.
- While most of the state has seen near-normal annual accumulated precipitation this year, moderate to severe drought persists across an area of northern Oxford, Franklin, and Somerset counties along the Quebec border.
- Global 2021 calendar year average temperature was 6th warmest based on observations beginning 1880, despite persistent cool conditions across the eastern Pacific in association with La Niña.
Statewide Overview
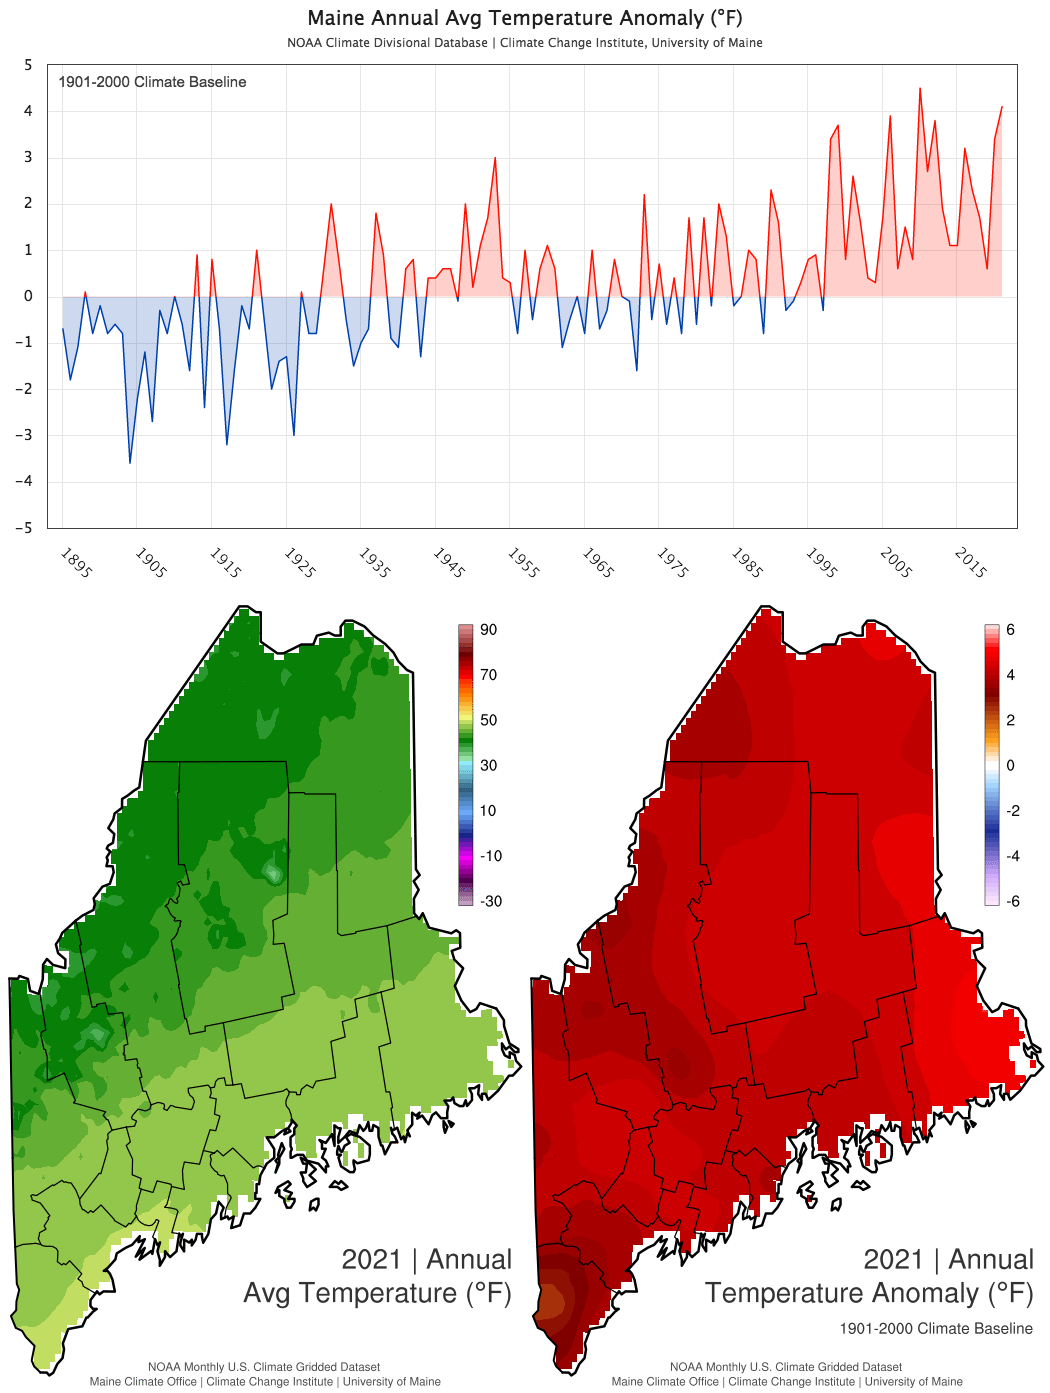
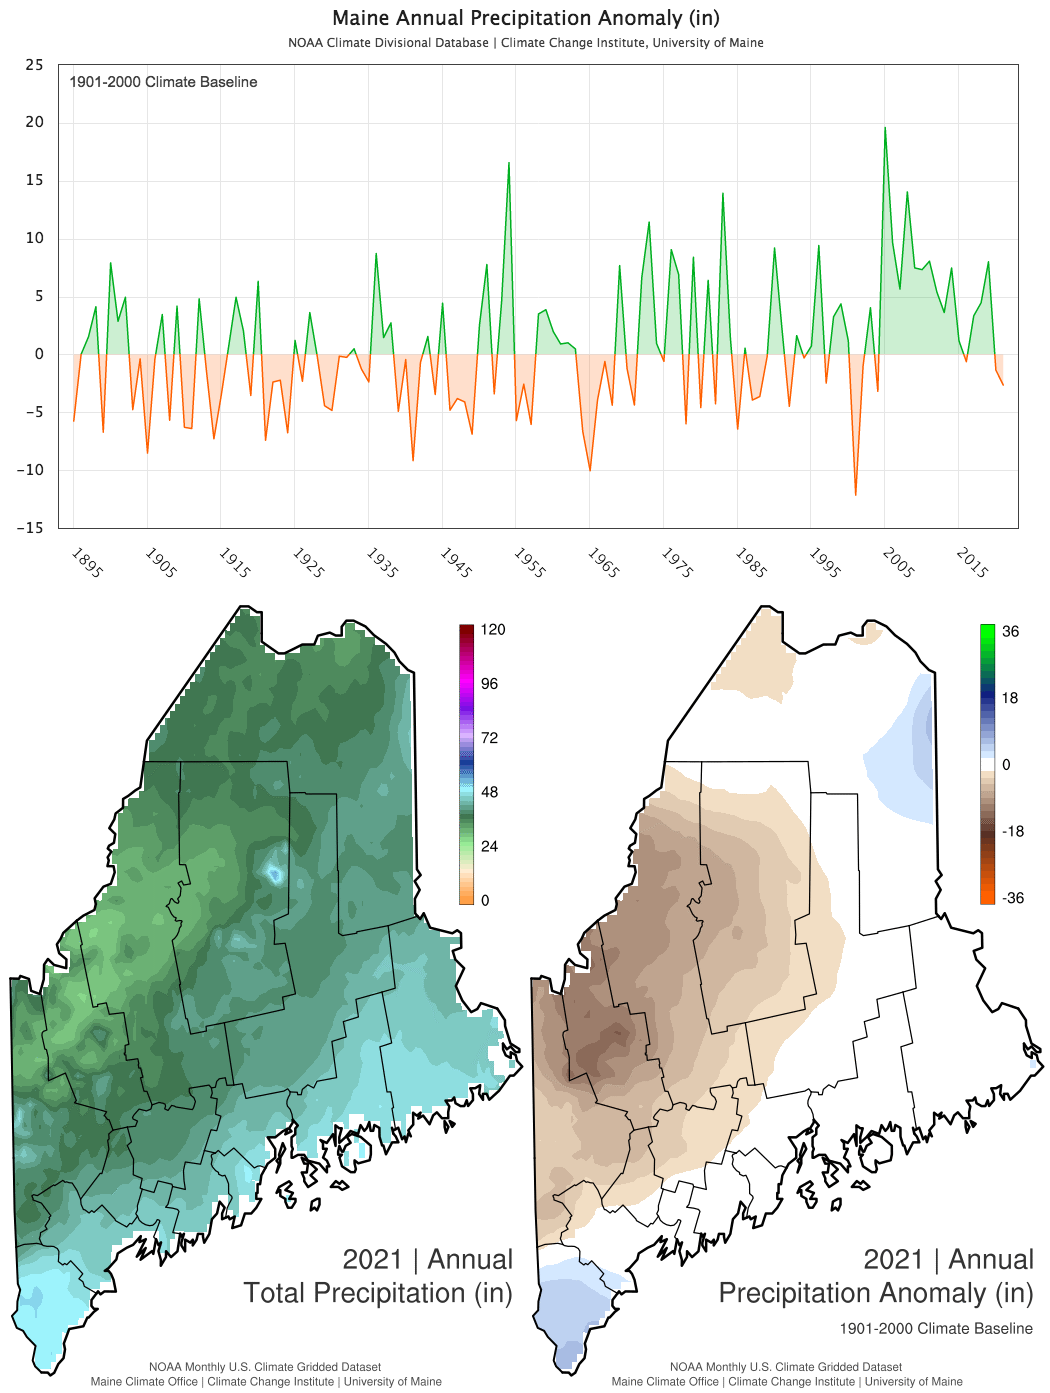
The Maine statewide 2021 calendar year (annual) average temperature was 44.2 °F, or 2nd warmest on record for the 127-year period beginning 1895 (Fig. 1). This temperature is 0.7 °F warmer than for the same period in 2020, and 4.1 °F above the 1901-2000 historical mean. The observed annual total precipitation was 39.3 inches, or 39th driest for the record period (Fig. 2). This precipitation amount is 1.3 inches less than for the same period in 2020, and 2.7 inches below the 1901-2000 historical mean.
| Temp / Anom (°F) | Rank | Precip / Anom (in) | Rank | |
|---|---|---|---|---|
| Annual | 44.2 / +0.7 | 2nd warmest | 39.3 / +2.1 | 39th driest |
| DJF | 22.4 / +6.8 | 3rd warmest | 10.1 / +2.8 | 46th wettest |
| MAM | 41.7 / +3.4 | 7th warmest | 8.0 / 0.0 | 24th driest |
| JJA | 65.6 / +2.9 | 4th warmest | 10.3 / -0.8 | 49th driest |
| SON | 48.2 / +4.3 | 3rd warmest | 13.4 / +2.1 | 31st wettest |
| DJF | MAM | JJA | SON | |
|---|---|---|---|---|
| Highest Maximum Temperature | 52 | 55 | 78 | 20 |
| Lowest Maximum Temperature | 2 | 37 | 29 | 0 |
| Highest Minimum Temperature | 34 | 73 | 169 | 27 |
| Lowest Minimum Temperature | 0 | 1 | 10 | 0 |
| Highest Precipitation | 65 | 19 | 28 | 27 |
Drought Status
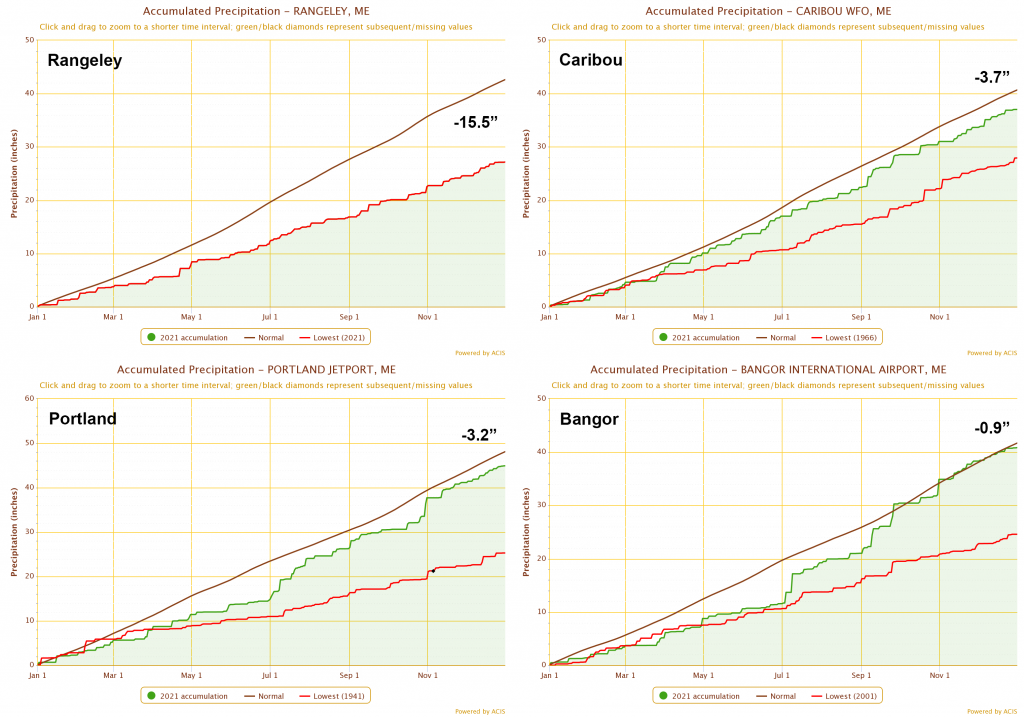
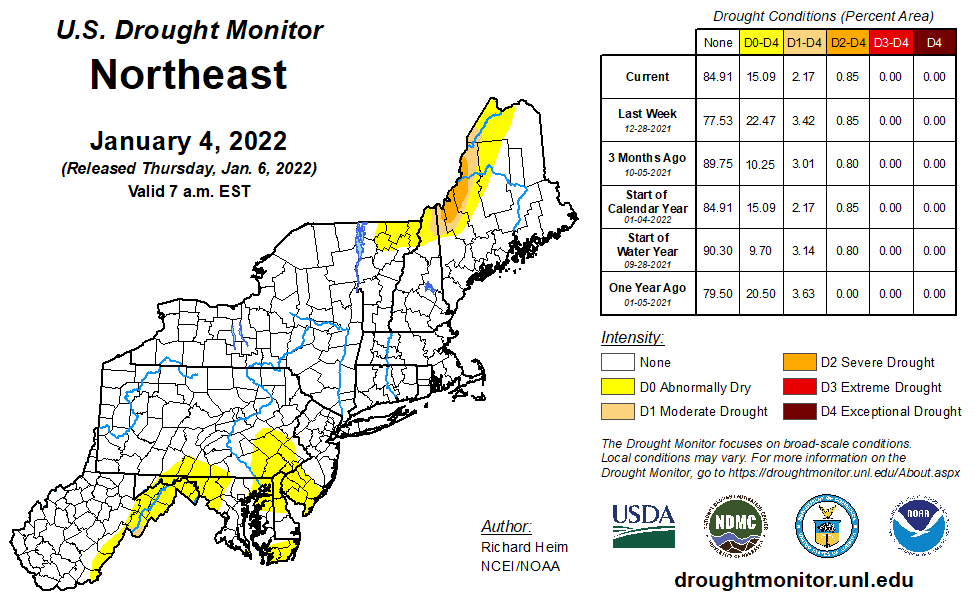
Despite some signal carryover from the 2020 drought and precipitation deficits in the first half of the year, the observed accumulated precipitation for calendar year 2021 is near normal (but with small deficits ranging 0.9 to 3.7 inches) in Bangor, Caribou, and Portland (Fig. 3). In sharp contrast, observations at Rangley show a precipitation deficit of 15.5 inches. These observations are reflected in the U.S. Drought Monitor where moderate to severe drought persists across an area of northern Oxford, Franklin, and Somerset counties along the Quebec border (Fig. 4). Abnormal dryness also extends across northern Piscatiquis and western Aroostook counties. Snowfall over the remainder of winter and snowpack/snowmelt in spring will be important factors in determining the hydrologic conditions when the warm season arrives. The latest drought information is available from the Northeast Drought Early Warning System (DEWS).
Looking Farther Afield
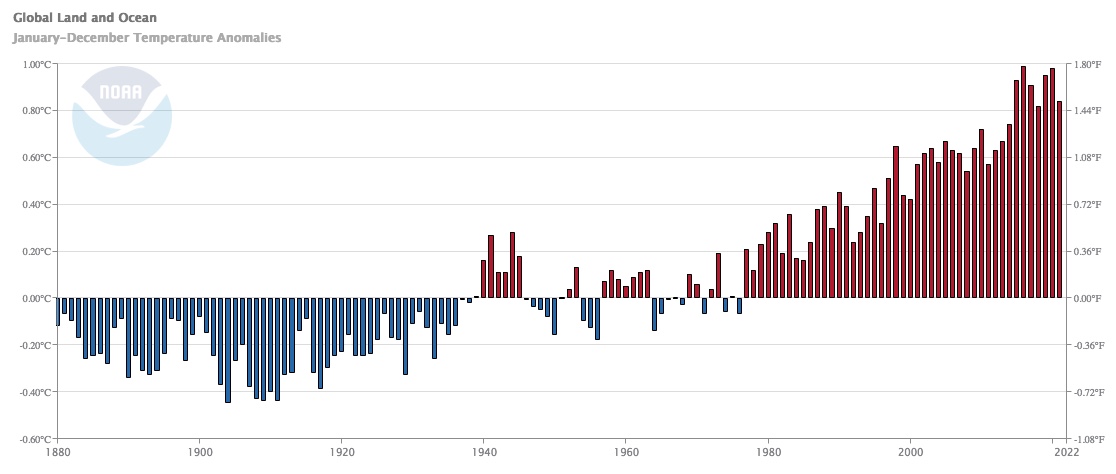
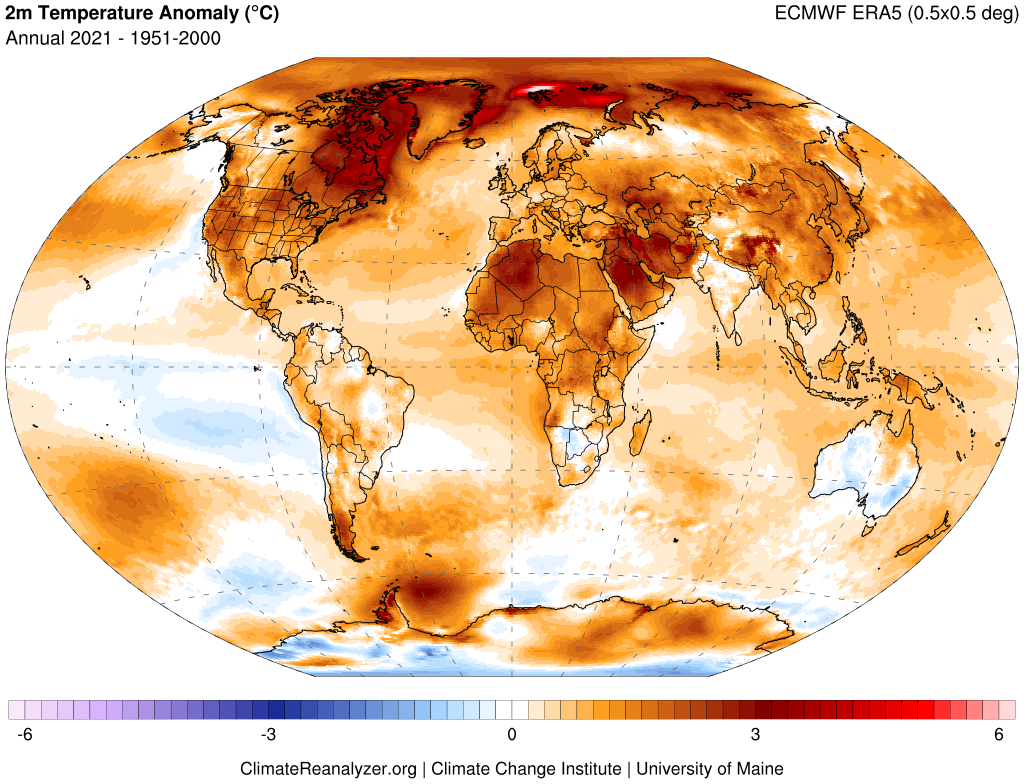
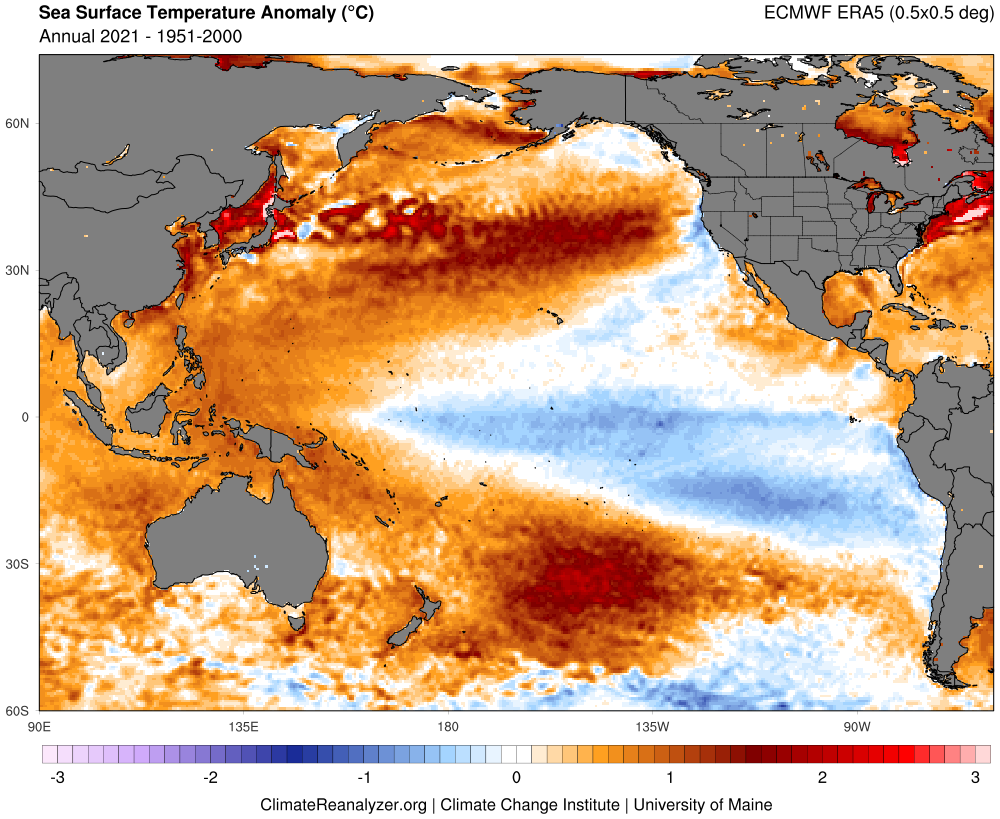
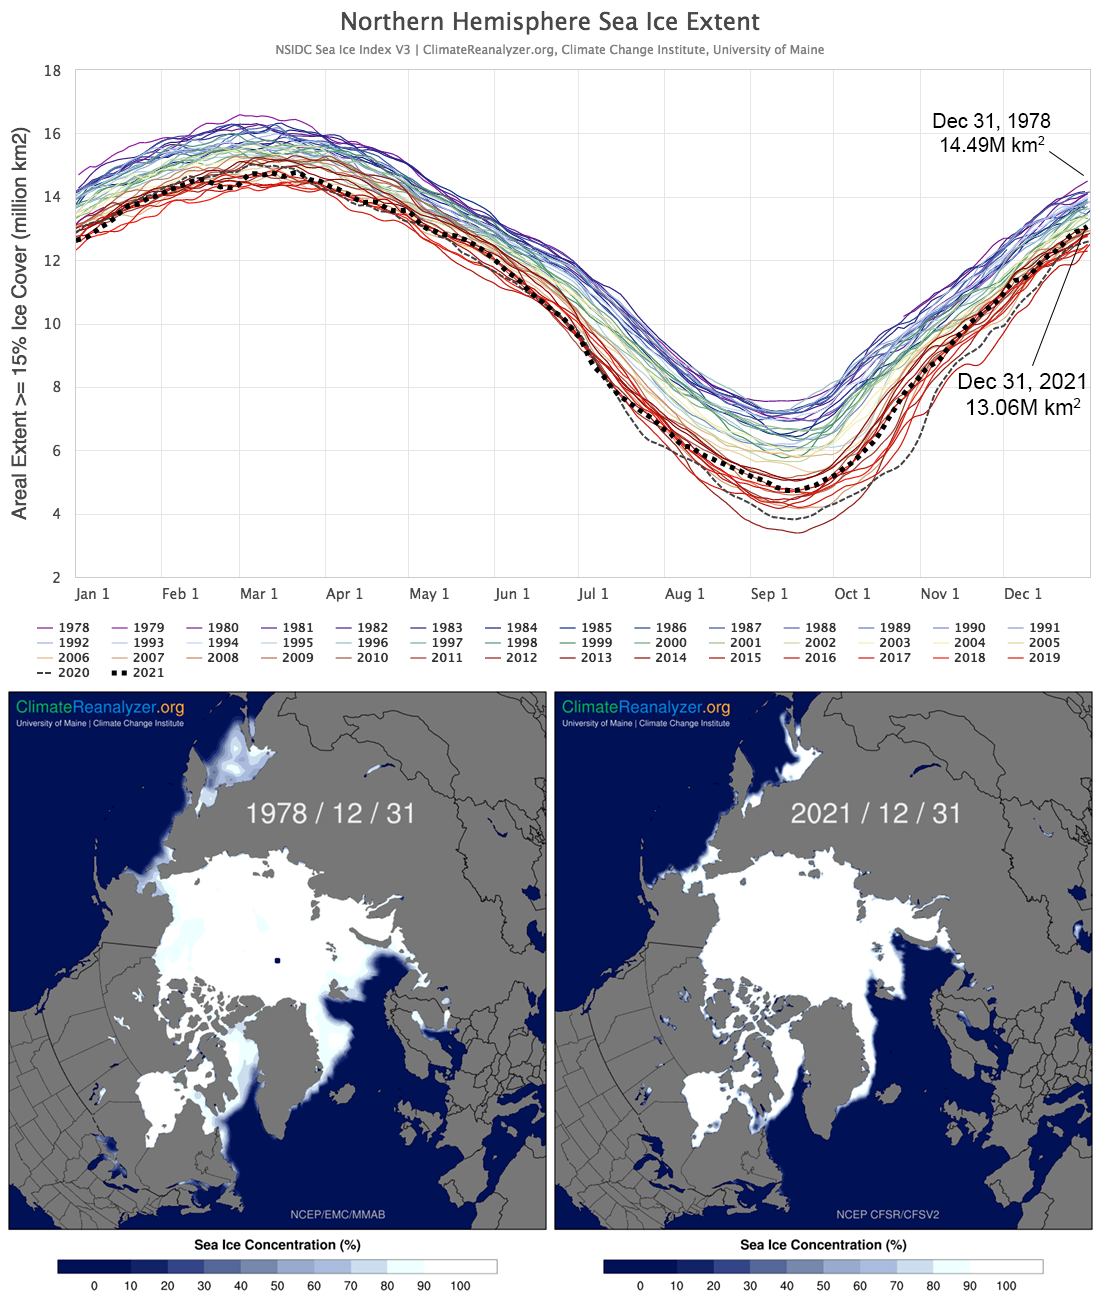
The 2021 annual global average near-surface temperature ranks 6th warmest for the period of observations beginning 1880 (Fig. 5). A map of the global distribution of annual temperature anomalies shows particularly warm conditions across eastern Canada and the high latitudes of the North Atlantic, as well as Algeria, portions of the Middle East, and Antarctic Penninsula. Cool anomalies are found primarily over Australia, part of West Antarctica, and across the eastern equatorial Pacific and off the western coast of South America (Fig. 6). The cool anomalies over the Pacific are associated with La Niña, which has affected global weather patterns since late 2020 (Fig. 7). It is notable that despite the persistence of La Niña, global mean temperatures remain historically high. In contrast, Arctic sea ice extent bucked the trend of recent years and ranks only 18th lowest for December 31st for the satellite observation era (Fig. 8). Arctic sea ice extent at the end of 2020 was 5th lowest.
Maine historical climate data and current weather forecasts are available on the Maine Climate Office website. For U.S. and global climate and weather data, visit Climate Reanalyzer. The Maine Climate Office and Climate Reanalyzer are developed and maintained by Dr. Sean Birkel, the Maine State Climatologist and Assistant Extension Professor at the Climate Change Institute and Cooperative Extension at the University of Maine.