Fall 2019
Weather and Climate Review: Fall 2019
By Dr. Sean Birkel, Maine State Climatologist
- Statewide Overview
- Notable Weather and Climate Events
- Looking Farther Afield
- Tools for Accessing Maine Historical Climate Data and Current Weather Forecasts
Statewide Overview
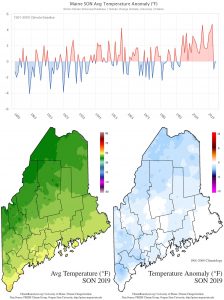
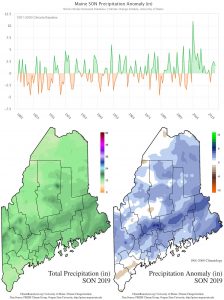
The Maine statewide fall (September-November [SON]) 2019 average temperature was 43.8 °F, ranking 55th coolest (71st warmest) for the 125-year record period beginning 1895 (Fig. 1). This temperature is 1 °F warmer than that observed for the same period in 2018, and equal to the 1901–2000 historical mean. The observed SON total precipitation was 12.9 inches, ranking 37th wettest (89th driest) on record since 1895 (Fig. 2). This precipitation amount is 0.9 inches less than that observed in 2018, and 1.6 inches above the 1901-2000 historical mean. In total, there were 12 high and 56 low daily temperatures, and 69 high precipitation records either broken or tied statewide during the fall season. All 56 low daily temperature records were set in November (data from NOAA Daily Weather Records).
-
-
Figure 1. Statewide SON average temperature anomaly (1901-2000 baseline) time-series and maps. Time-series data from the NOAA U.S. Climate Divisional Database. Spatial data from the PRISM Climate Group. These charts are also available on the Maine Climate Office website.

-
-
Figure 2: Statewide SON total precipitation anomaly (1901-2000 baseline) time-series and maps. Time-series data from the NOAA U.S. Climate Divisional Database. Spatial data from the PRISM Climate Group. These charts are also available on the Maine Climate Office website.
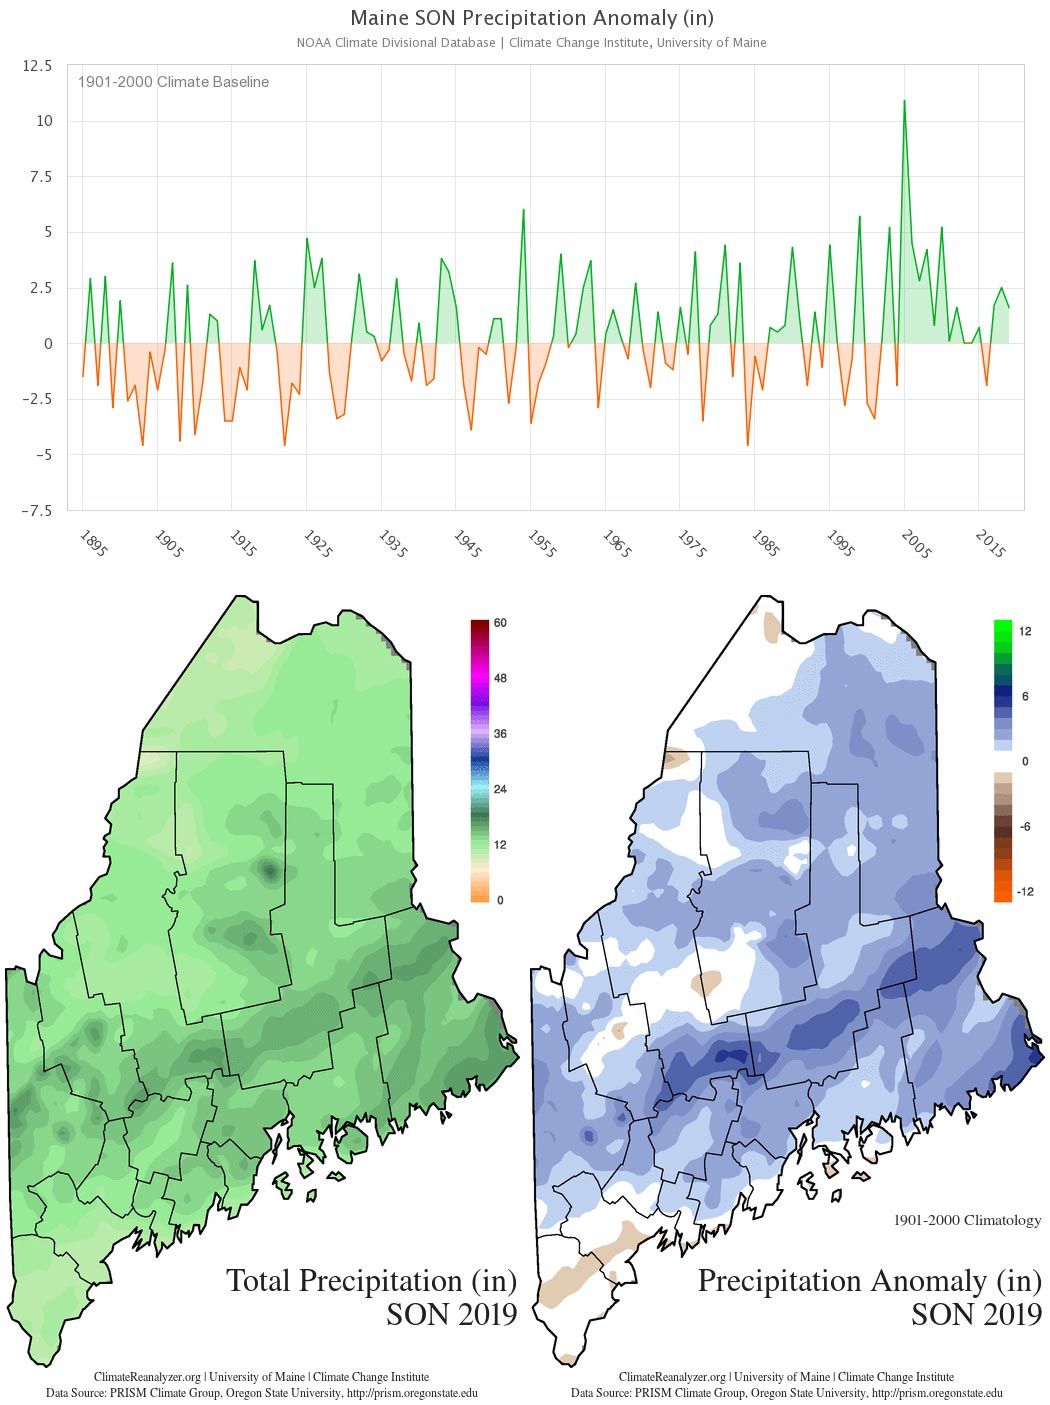
On the three-month SON average, fall 2019 was wet, but the temperature was very near the 20th-century baseline. For individual months, September was slightly warmer and drier than normal, October was warm/wet, and November was cold (2nd coldest since 1986) with near-normal precipitation (Table 1).
| Temp / Anom (°F) | Rank | Precip / Anom (in) | Rank | |
|---|---|---|---|---|
| SON | 43.8 / 0 | 55th coolest | 12.9 / +1.6 | 37th wettest |
| September | 55.4 / +0.5 | 62nd coolest | 3.4 / -0.3 | 60th driest |
| October | 46.3 / +2 | 29th warmest | 5.4 / +1.7 | 23rd wettest |
| November | 29.8 / -2.5 | 20th coldest | 4 / -0.1 | 59th wettest |
Notable Weather and Climate Events
September: Much of the state received no rain September 5-22. The dry spell ended with the passage of a storm system September 23-25 that brought rainfall statewide. This rainfall followed four days of unseasonable warmth, with high temperatures ranging from the high 70s to high 80s from north to south. Much more severe heat and drought conditions developed throughout September across the southeastern U.S.
October: A powerful coastal storm swept across New England October 16-17 with gusts up to 90 mph along Cape Cod, Massachusetts, and resulting in ~500,000 power outages across the region. The central pressure of the storm dropped more than 30 millibars in 24 hours, placing it firmly in the category of a “bomb cyclone”. Maine was most impacted by the storm along the southwest coast, where gusts in the Portland area reached 62 mph. By comparison, gusts recorded in Bangor only reached 43 mph. The storm caused about 219,000 power outages in the southern half of the state, some lasting for several days.
November: (1) Yet another storm with damaging winds struck the northeast region November 1 with the passage of a powerful cold front. The front was associated with a negative-tilted wave trough in the upper-level atmospheric flow, a pattern that produces severe weather from the instability that develops as cold air aloft is forced over warm air near the surface. Strong winds swept across the state, even in Aroostook County, causing about 230,000 power outages statewide. A maximum gust of 49 mph was recorded at the Portland Jetport; 53 mph in the Bangor; and 51 mph in Caribou. (2) A cold wave developed mid-November bringing the first taste of winter, with minimum temperatures dipping into the teens along the coast, single digits in the central interior, and below zero in some areas in northern and western parts of the state. As noted above, a slew of observing stations captured new daily minimum temperature records. Observations at Bangor International Airport, for example, show three new minimum temperature records (November 13, 14, 17) and one tie (November 9) over a nine-day period.
It’s unusual for two major windstorms to affect the state in the span of just over two weeks. These most recent windstorms follow just two years after the bomb cyclone of October 30, 2017, brought gusts up to 73 mph inland (and gusts up to 92 mph offshore), causing widespread tree damage and 500,000 power outages across the state – a greater number of outages than caused by Ice Storm 1998!
Are damaging storms such as these becoming more frequent as the climate warms? First and foremost, storms are weather events, and ascribing climate significance to individual weather events is tricky business. However, the day-to-day weather that we experience is influenced by climate boundary conditions – that is the mean states of temperature, atmosphere and ocean circulation, and the amount of snow and sea-ice cover in the polar regions, among other things. As the climate warms, as it has done measurably so over recent decades, boundary conditions change, and therefore some aspects of the weather operate differently than before.
Indeed, research has shown that extreme weather events – heat waves, cold waves, droughts, and intense storms – are generally becoming more common. One mechanism that can produce intensified storms is the increased heat and moisture supplied from warmer-than-normal ocean water. A slower, wavier jet stream, thought to be caused in association with the warming Arctic, is another mechanism that can play a role. A relatively slow jet stream can increase the likelihood of heat or cold waves developing from blocking patterns. When these features begin to break down, the steep temperature differences on either side of the wave can drive a powerful storm front with heavy precipitation and strong winds.
The November 1 wind storm in particular formed in association with a blocking pattern: pronounced warm ridge over Alaska, deep cold trough over the western U.S., and another ridge downstream over the East Coast (Fig. 3). This jet stream configuration also brought strong Santa Ana winds and dry conditions that perpetuated wildfires in California.

Looking Farther Afield
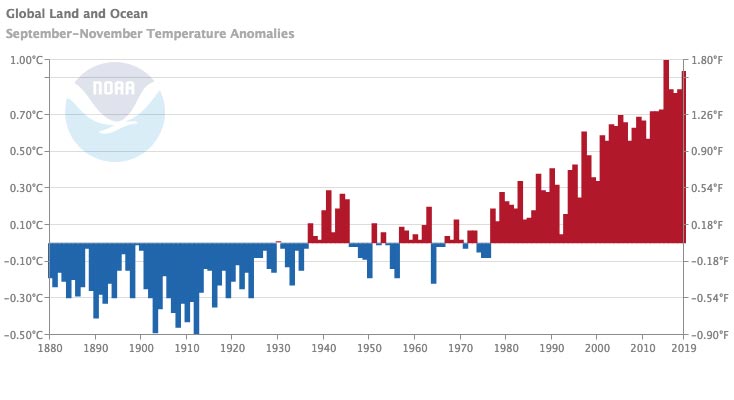
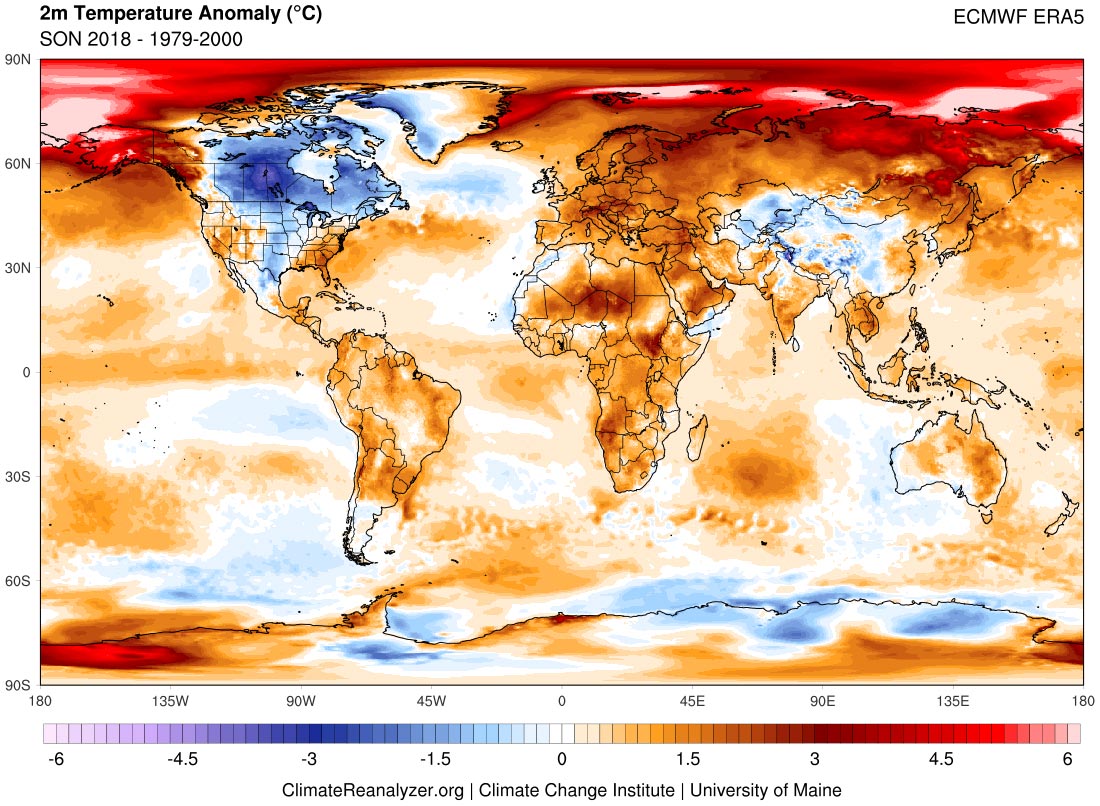
The fall 2019 global average near-surface temperature ranks second warmest on record since widespread observations became available in 1880 (Fig. 4).
Maine’s cool fall was associated with a broad area of anomalous cool temperature developed primarily over Canada (Fig. 5). Most other regions were warmer than usual – most notably the Arctic, which saw its second warmest fall in the 1979-present reanalysis record.
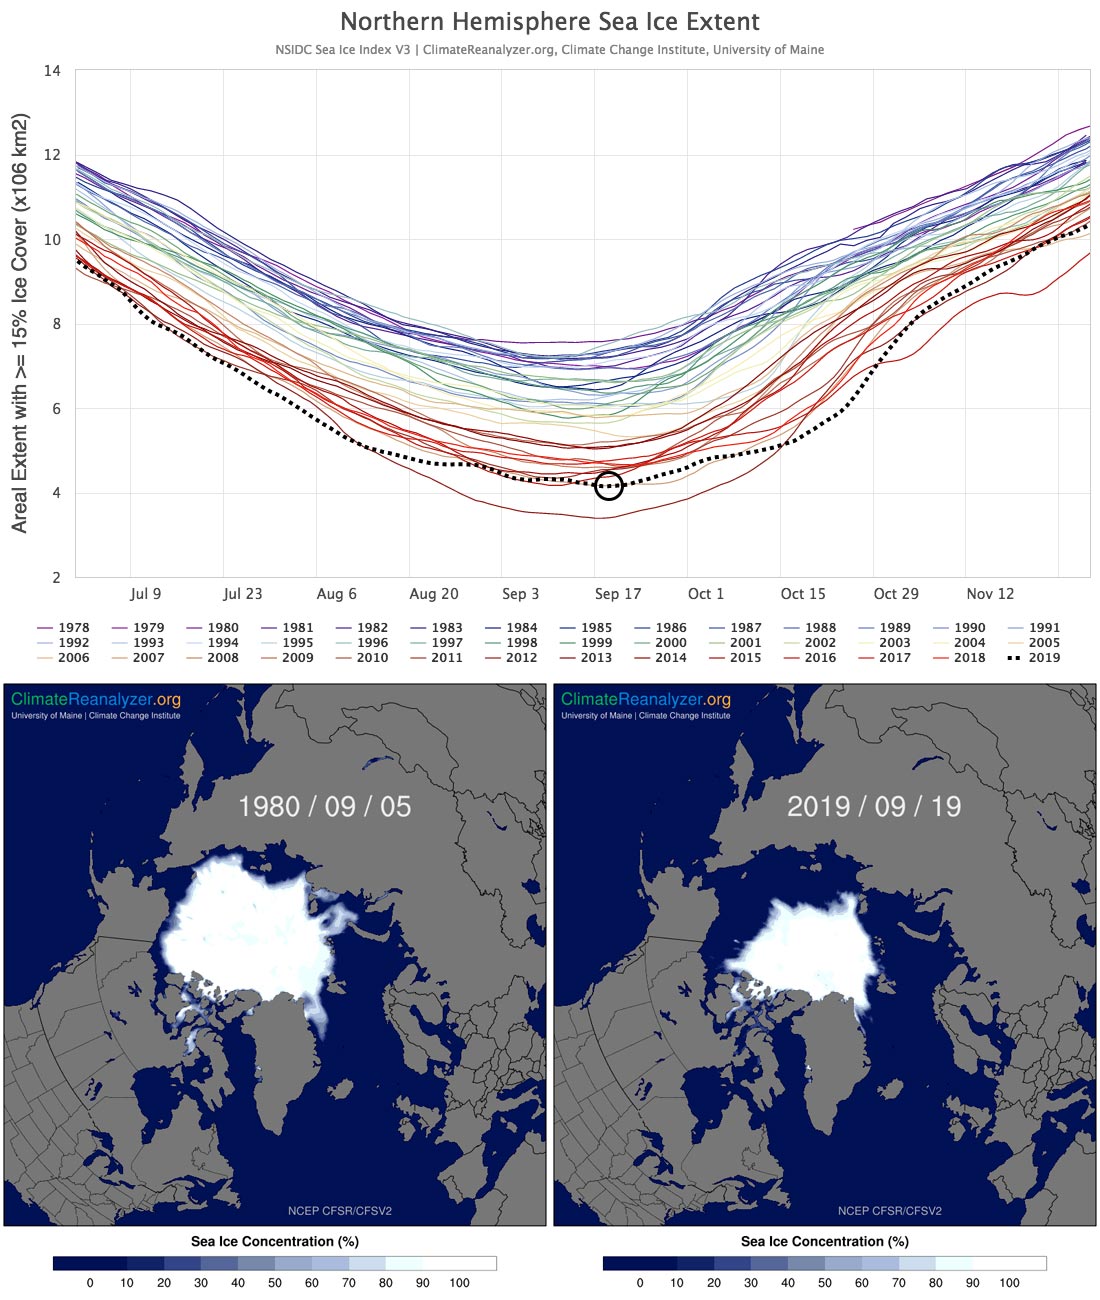
Likewise, the minimum extent of Arctic sea ice reached annually in September, tied 2007 this year for second-lowest in the 1979-present satellite observation era (Fig. 6).
Tools for accessing Maine historical climate data and current weather forecasts are available on the Maine Climate Office website. For U.S. and global visualizations, visit Climate Reanalyzer. The Maine Climate Office and Climate Reanalyzer are developed and maintained by Dr. Sean Birkel with support from the Climate Change Institute at the University of Maine.