Fall 2021
Maine Fall 2021 Climate Summary
By Dr. Sean Birkel, Maine State Climatologist
Highlights
- The 2021 fall (September–November or SON) was 3rd warmest and 31st wettest since 1895.
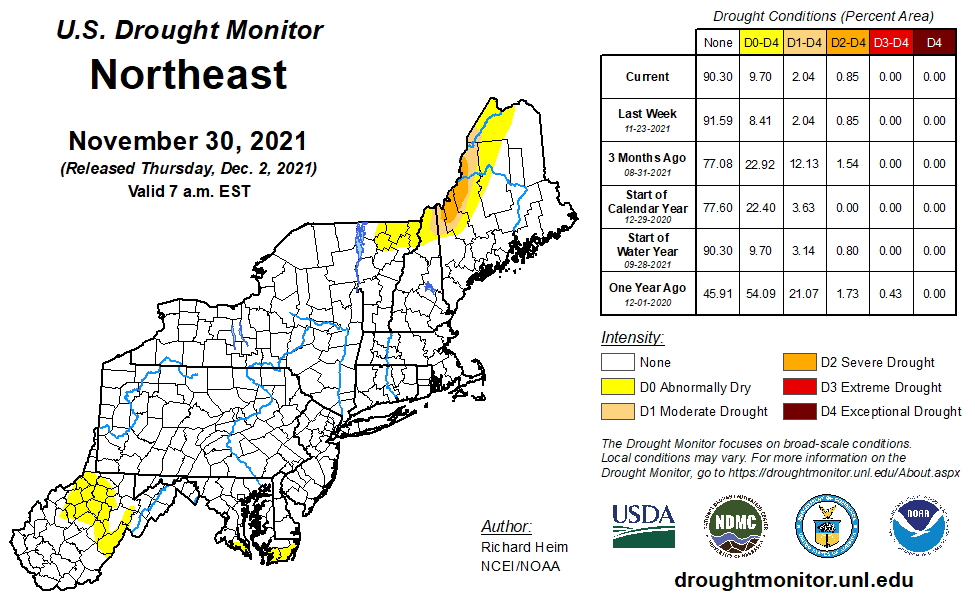
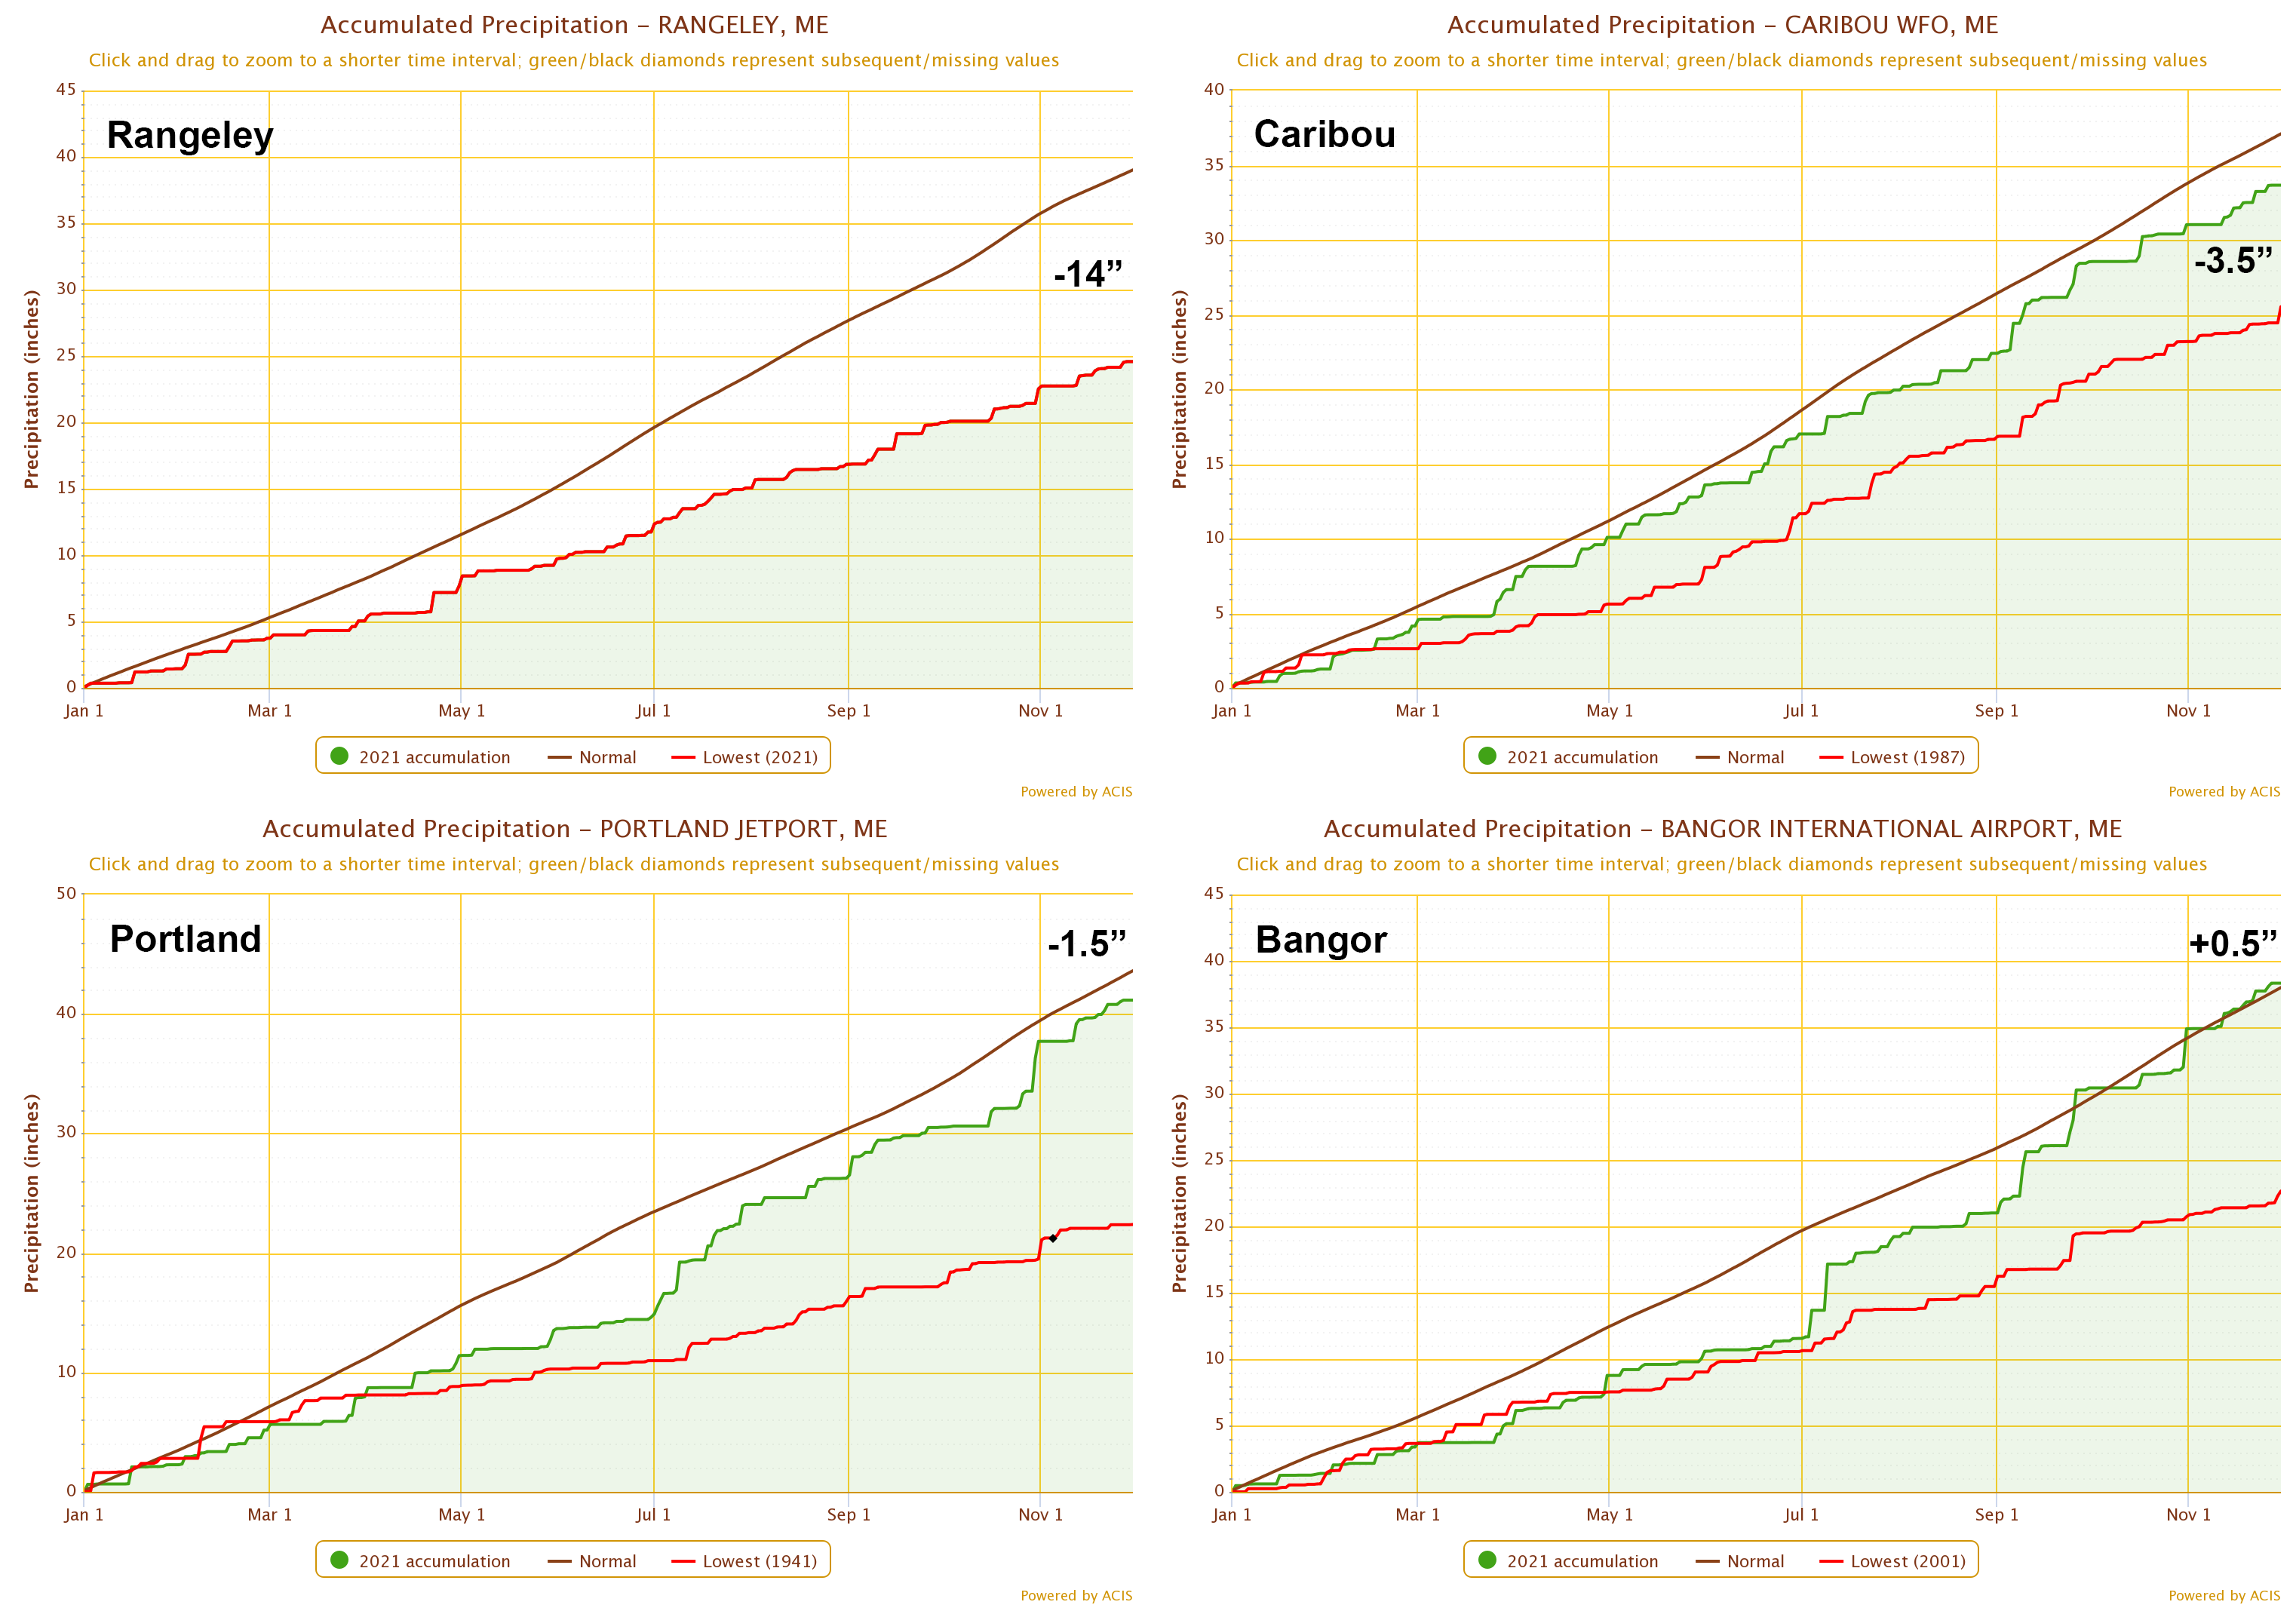
- Abundant rainfall in September and near-normal conditions in October contributed the removal of drought and dryness across nearly all of Maine, with the exception of a contiguous area over western and northwestern along the Quebec border.
- Global SON average temperature was 4th warmest since 1880, despite persistent cool conditions across the eastern Pacific in association with La Nina.
Statewide Overview
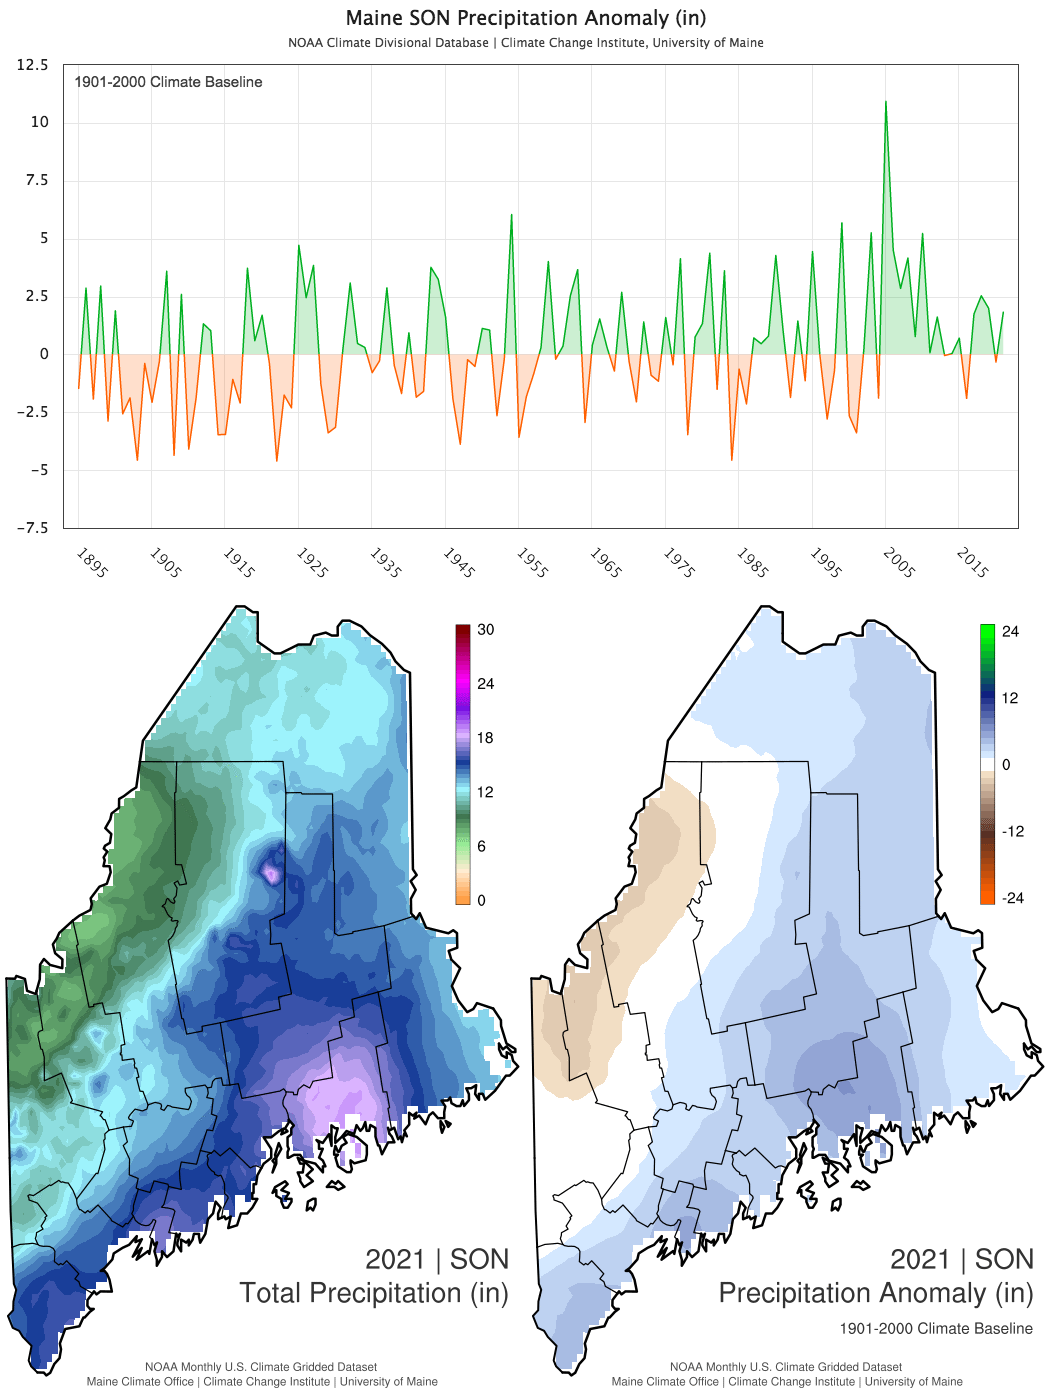
The Maine statewide climatological fall (September-November [SON]) 2021 average temperature was 48.2°F or 3rd warmest on record for the 127-year period beginning 1895 (Fig. 1). This temperature is 2°F warmer than for the same period in 2020, and 4.3 °F above the 1901-2000 historical mean. The observed SON total precipitation was 13.4 inches, or 31st wettest for the record period (Fig. 2). This precipitation amount is 2.4 inches more than for the same period in 2020, and 2.1 inches above the 1901-2000 historical mean.
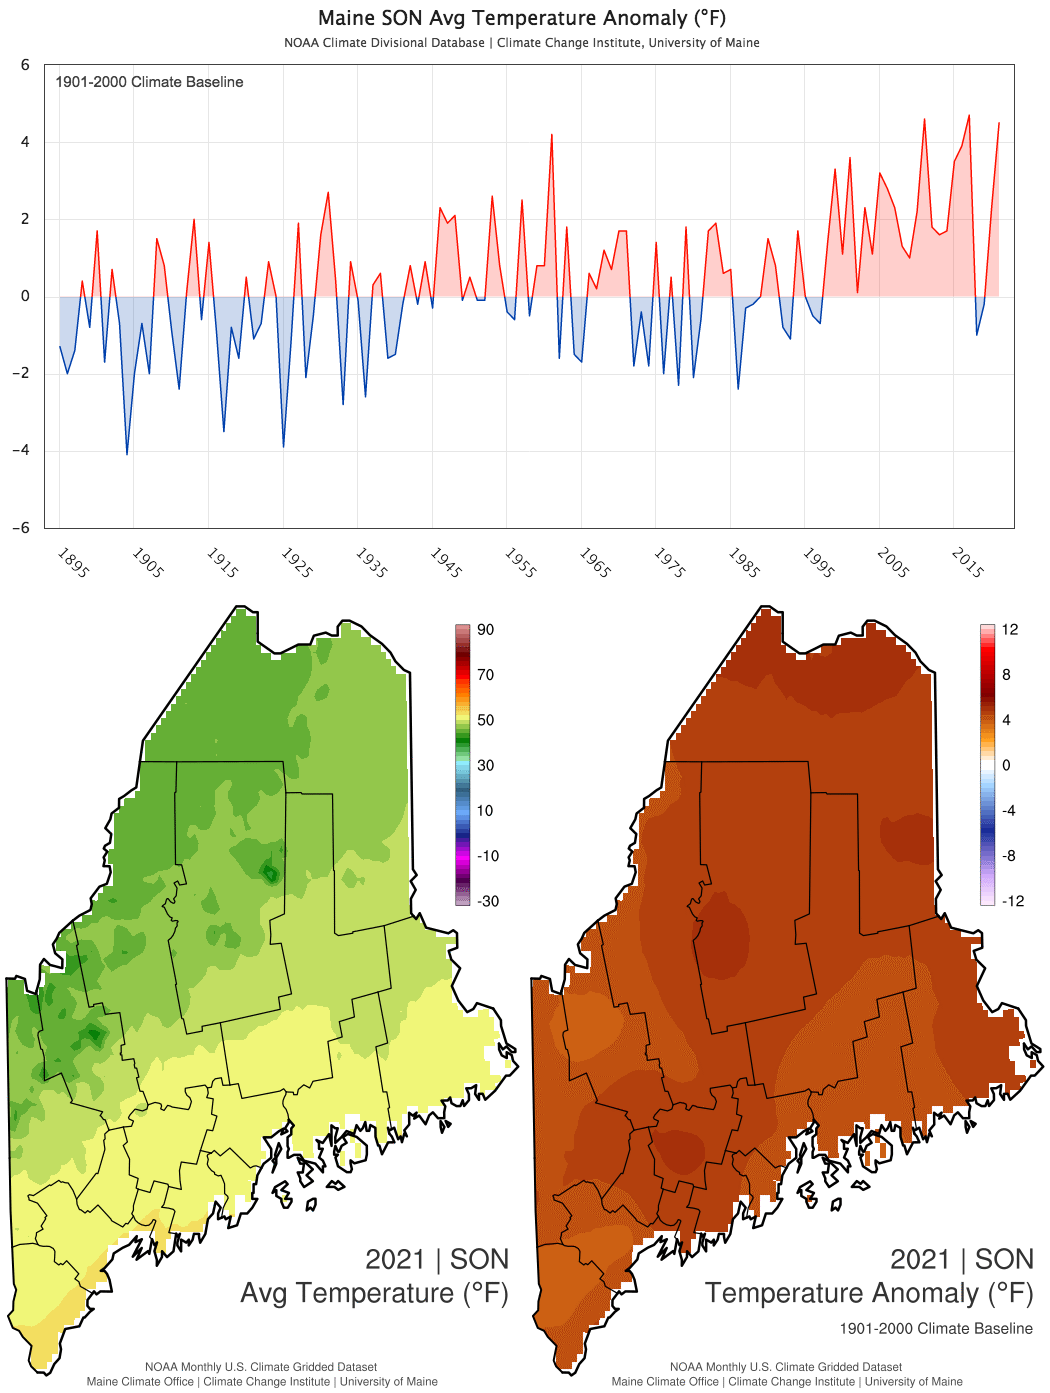
| Temp / Anom (°F) | Rank | Precip / Anom (in) | Rank | |
|---|---|---|---|---|
| SON | 48.2 / +4.3 | 3rd warmest | 13.4 / +2.1 | 31st wettest |
| Sep | 59.0 / +4.1 | 7th warmest | 6.5 / +2.8 | 6th wettest |
| Oct | 50.2 / +5.9 | 2nd warmest | 3.7 / 0.0 | 61st driest |
| Nov | 35.3 / +3.0 | 23rd warmest | 3.2 / -0.7 | 41st driest |
| Sep | Oct | Nov | SON | |
|---|---|---|---|---|
| Highest Maximum Temperature | 0 | 19 | 1 | 20 |
| Lowest Maximum Temperature | 0 | 0 | 0 | 0 |
| Highest Minimum Temperature | 21 | 6 | 0 | 27 |
| Lowest Minimum Temperature | 0 | 0 | 0 | 0 |
| Highest Precipitation | 14 | 7 | 6 | 27 |
Drought Greatly Diminished
Abundant rainfall in September (including two extreme events), near-normal rainfall in October (including one extreme rainfall event central/coastal), below normal in November. Drought/dryness removed across almost all of Maine and the Northeast region. Fig. 3, Fig. 4
Looking Farther Afield
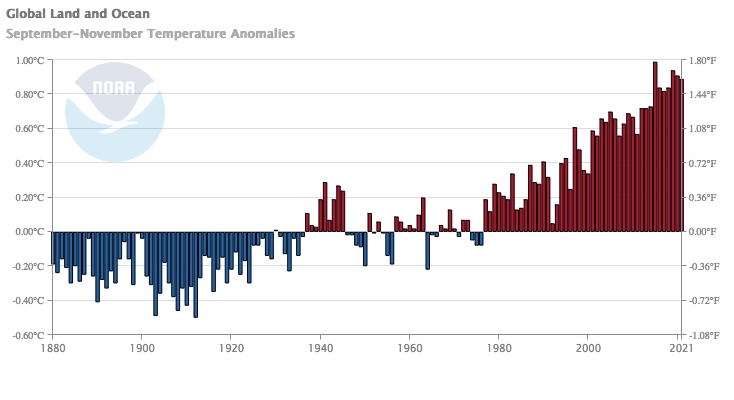
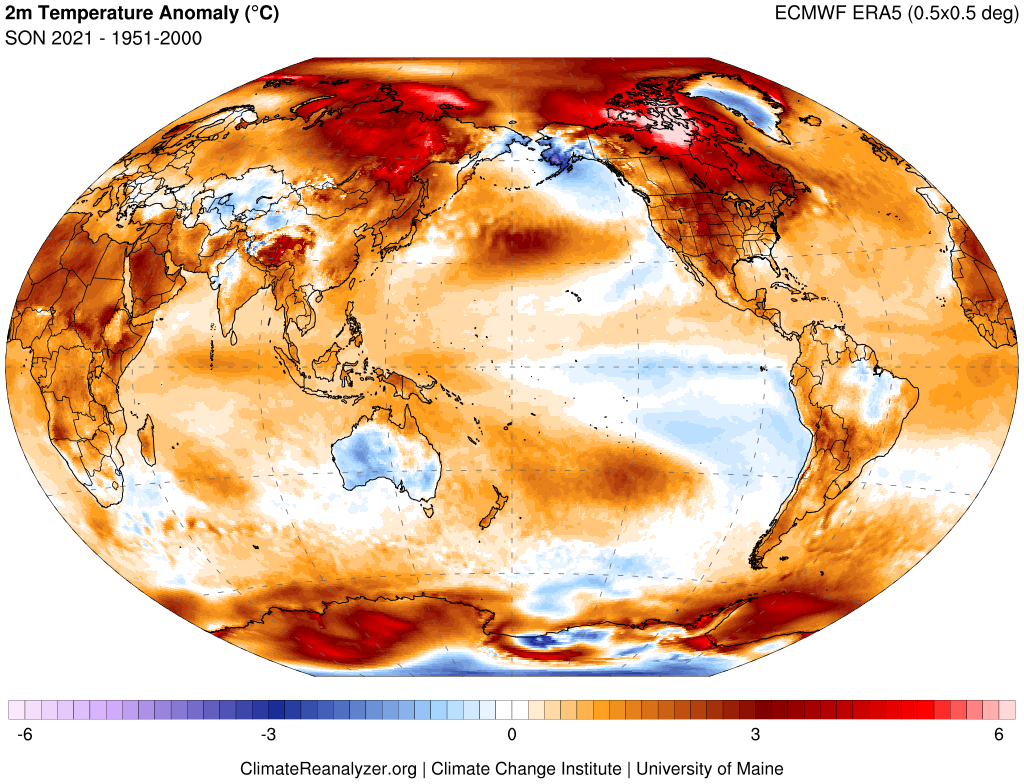
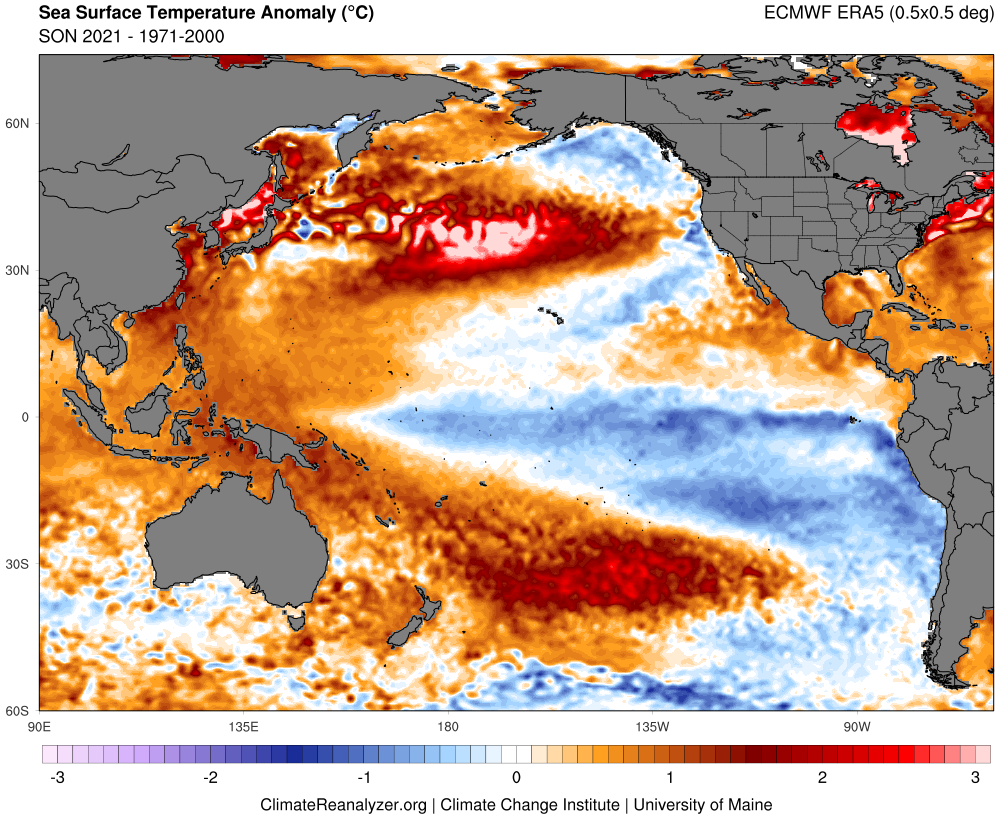
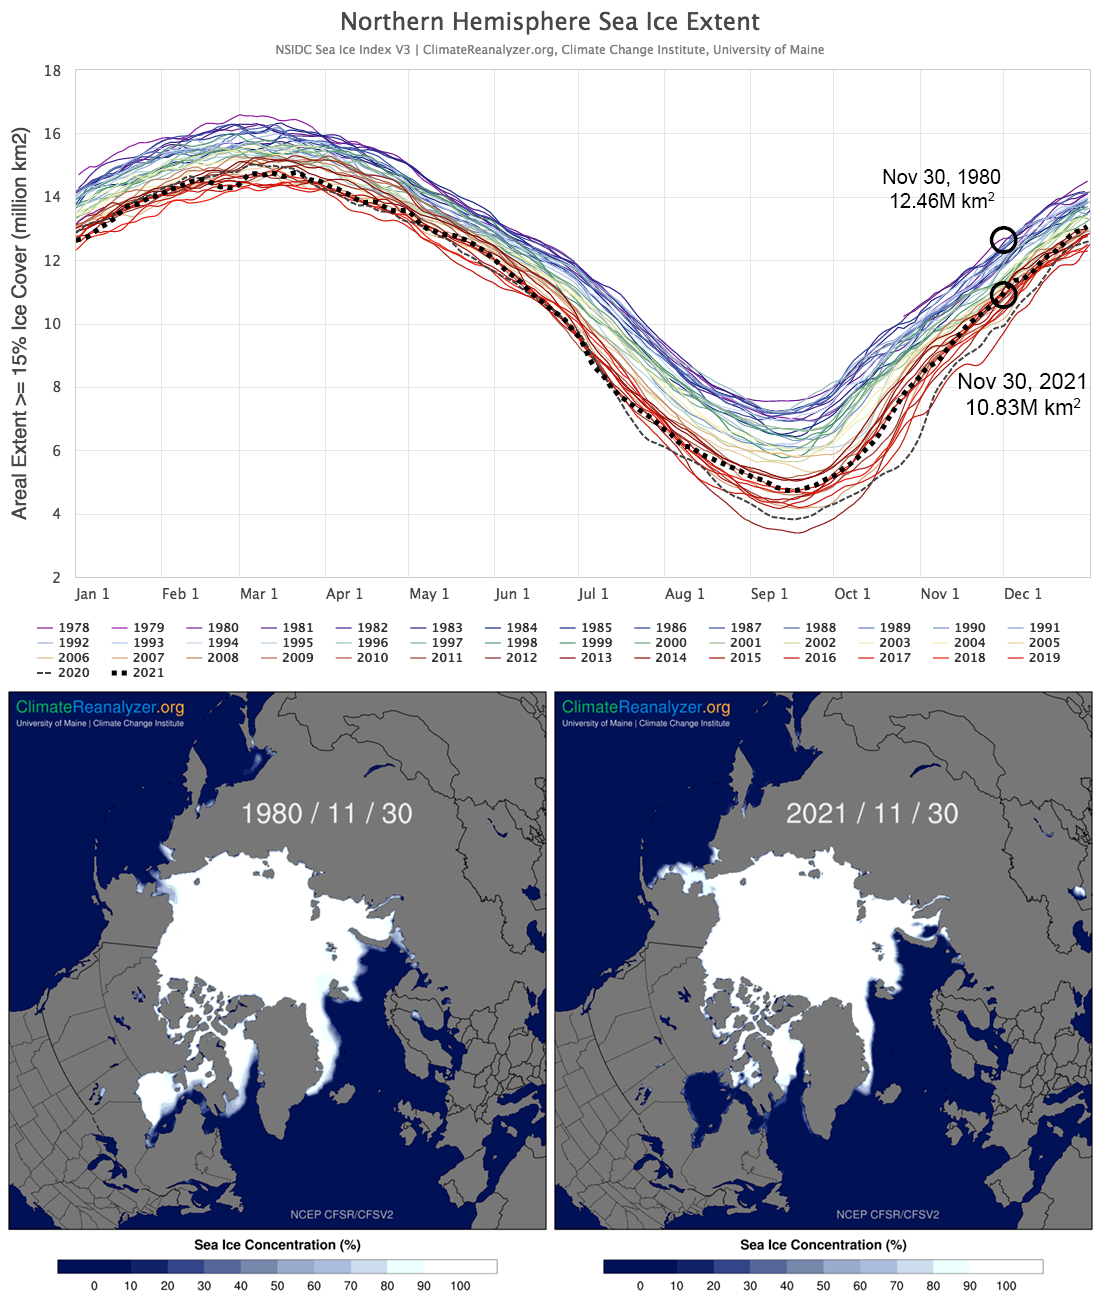
The SON 2021 global average near-surface temperature ranks 4th warmest on record since 1880 (Fig. 5). A map of the global distribution of SON temperature anomalies shows particularly warm values over eastern Siberia and the Canadian High Arctic (Fig. 6). The prominent pattern of cool anomalies off the western margins of North and South America and stretching across the equatorial Pacific are associated with La Niña, which will affect winter climate globally for a second year in a row (Fig. 7). It is notable that despite the persistence of La Niña, global mean temperatures remain historically high. In the Arctic, the sea-ice extent at the end of November has bucked the trend of recent years and is the most extensive since 2014 (Fig. 8). The 10.83 million km2 areal sea ice coverage ranks 13th lowest since continuous satellite observations began in late 1978. For comparison, late November sea ice extent in 2020 was 2nd lowest on record.
Maine historical climate data and current weather forecasts are available on the Maine Climate Office website. For U.S. and global climate and weather data, visit Climate Reanalyzer. The Maine Climate Office and Climate Reanalyzer are developed and maintained by Dr. Sean Birkel, the Maine State Climatologist and Assistant Extension Professor at the Climate Change Institute and Cooperative Extension at the University of Maine.