Spring 2018
Weather and Climate Review: Spring 2018
By Dr. Sean D. Birkel, Maine State Climatologist
- Overview
- Temperature
- Precipitation
- Snowpack
- Hydrology
- Expected Below-Average Atlantic Hurricane Season
Overview
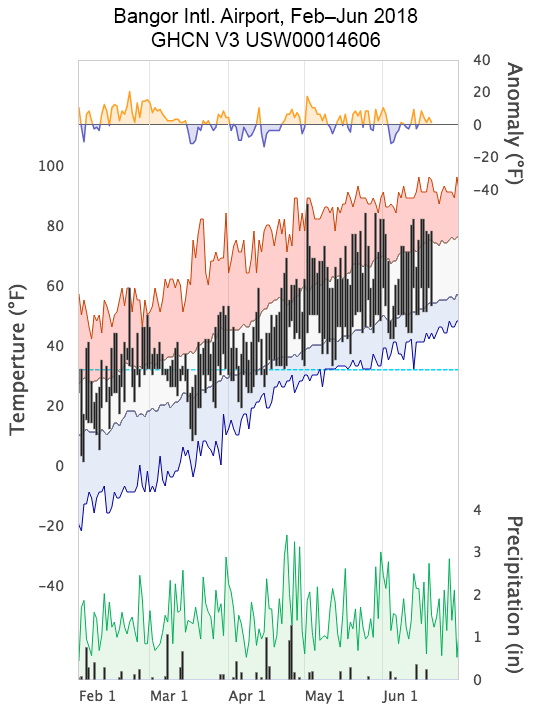
The statewide spring (March-May) 2018 season average was slightly warmer and drier than normal in comparison to 1901–2000 climatology. Variability within the season average can be gauged from daily station observations of temperature and precipitation, as shown for Bangor in Figure 1. The first half of March was warm and wet before a cold wave ushered in dry conditions; April was colder than normal and wet for the first three weeks of the month; May was warm and dry. Notable weather events to impact Maine during spring 2018 include significant nor’easters March 8 (Article: Nor’easter moves on but many remain without power in southern, coastal Maine, March 8 and 9, 2018, Portland Press Herald) and March 13–14 (Article: Third nor’easter in 2 weeks to dump at least a foot of snow across Maine, March 12, 2018, Bangor Daily News), an intense storm with strong wind and mixed precipitation April 16, and a brief heat wave May 2 with record or near-record high temperatures ranging from upper 70s to upper 80s (°F) from north to south. Spring snowpack at the beginning of April was less than in 2017 but considerably more than in 2016. Streamflows were likewise normal or above normal statewide for much of the season but then diminished to levels suggestive of emergent drought in response to below normal rainfall in May. On the larger scale, sea-surface temperatures across the subpolar and tropical latitudes of the North Atlantic cooled in response to persistent strong winds associated with the positive phase of the North Atlantic Oscillation. Cool North Atlantic surface waters, and also increasing wind shear tied likely emergence of El Niño over the equatorial Pacific suggest a below-normal storm activity for the 2018 hurricane season. These items are expanded upon below.
Temperature
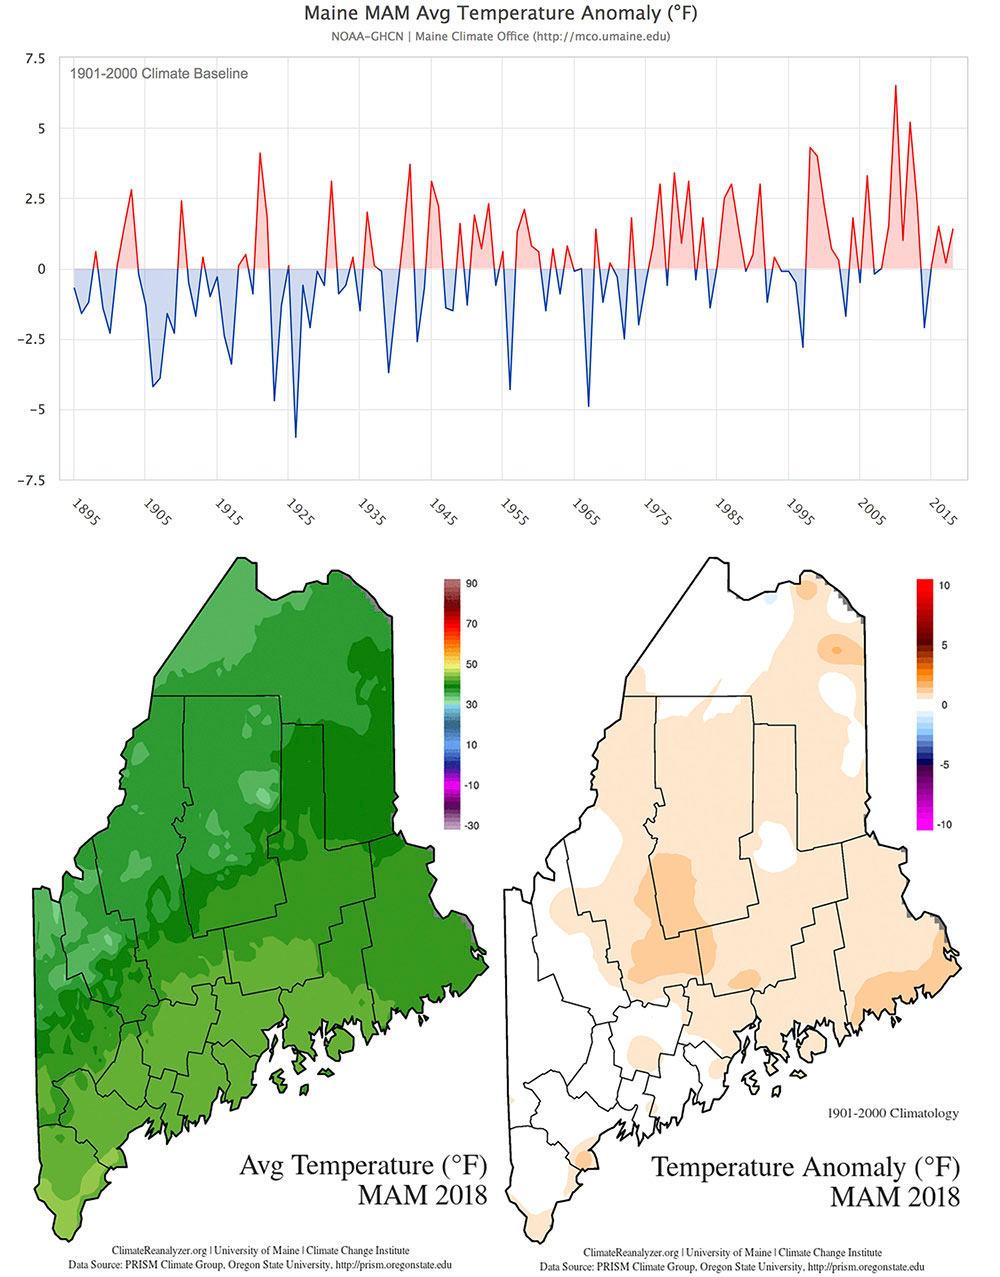
Maine statewide average temperature for the 2018 climatological spring (March-May) registers at 39.7 °F. This temperature is 1.3 °F warmer than that measured during the same period last year, and 1.4 °F warmer than the 1901–2000 historical mean. This spring ranks 33rd warmest for the record period beginning 1895.
Precipitation
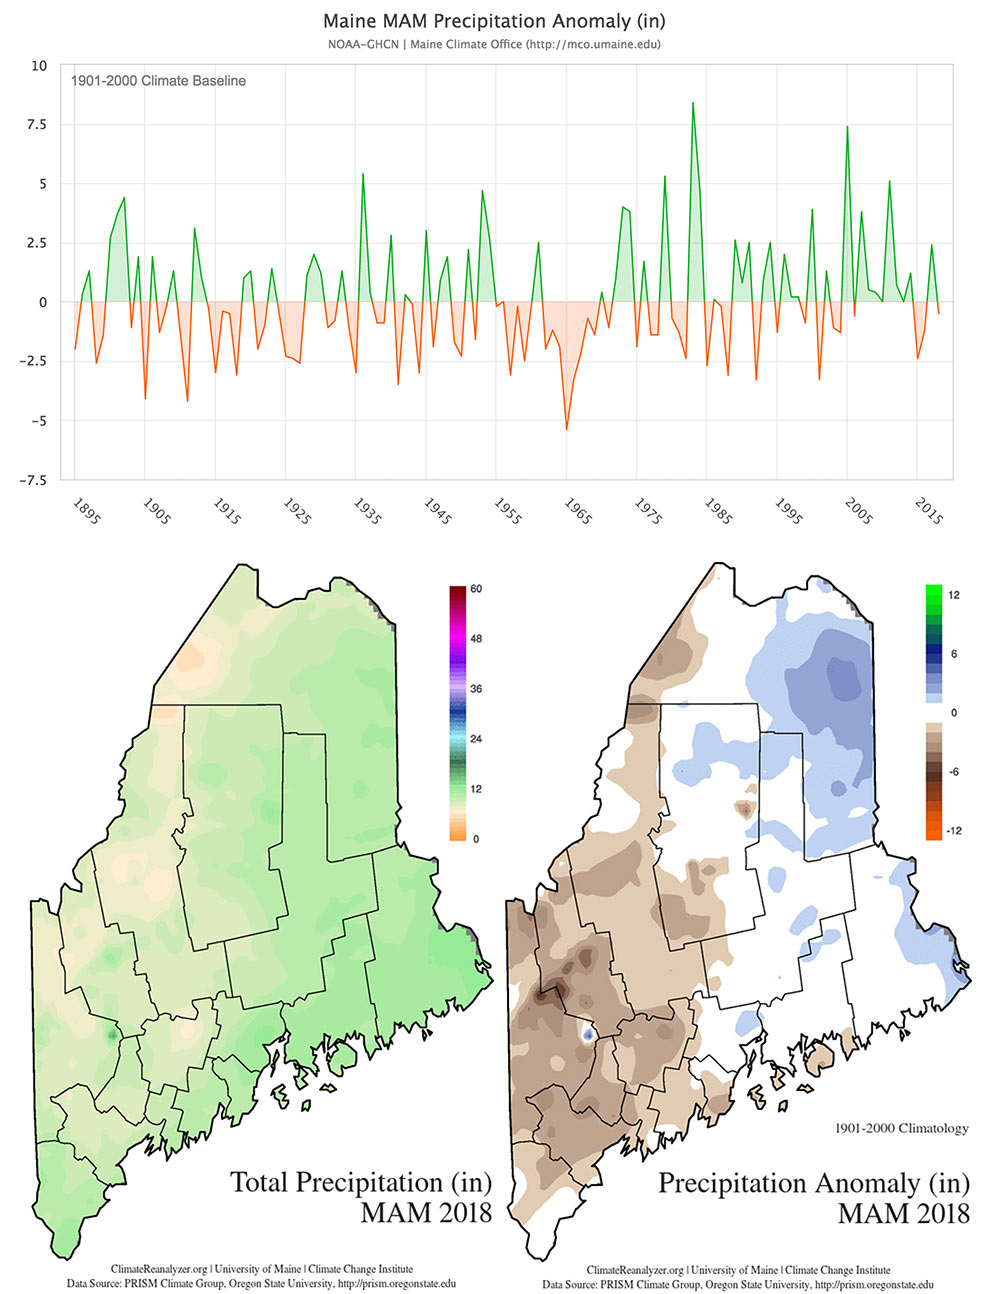
Maine statewide average accumulated precipitation for the 2018 climatological spring (March-May) registers at 9.6 inches. This amount is 2.9 inches less than that measured during the same period last year, and 0.5 inches less than the 1901-2000 historical mean. This spring ranks 69th wettest (or slightly below normal) for the record period beginning 1895.
Snowpack
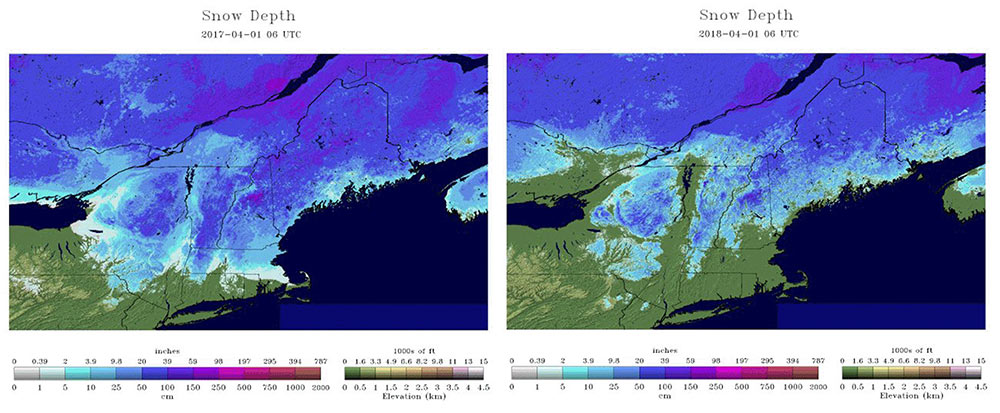
A February warm wave significantly diminished the snowpack across the coastal zone and south-central lowlands to where many areas saw bare ground and signs of an early spring. However, cold temperatures and snowfall developed after the first week in March, and as a result, there was a near continuous cover of snow inland from the coast at month’s end. April 1, 2018 snow cover was less extensive than on the same day in 2017 but considerably more extensive than in 2016. The snowline was slow to retreat into northern areas and western highlands due to persistent cold weather until the third week of April. But winter finally lost its grip on Aroostook County, and most snow had melted away statewide by May 1.
Hydrology
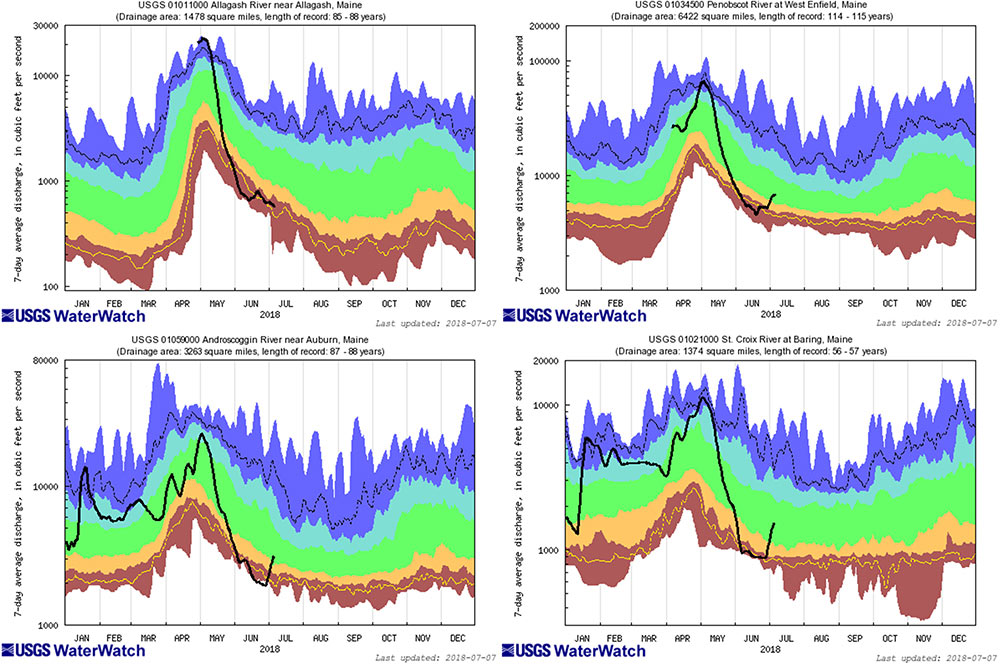
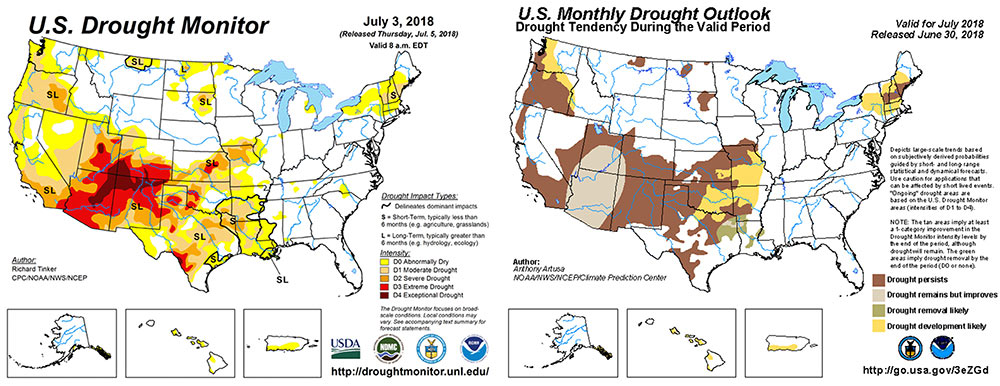
Streamflows across most of the state were near or above-normal throughout winter and for most of spring 2018. However, despite favorable April snowpack and months of near-normal precipitation, streamflows declined steadily in May driven by the development of dry, warmer-than-normal weather patterns. Update: June saw below-normal precipitation across much of the state, and as of July 7 NOAA reports that much of southern and western Maine are either abnormally dry or in moderate drought.
Expected Below-Average Atlantic Hurricane Season
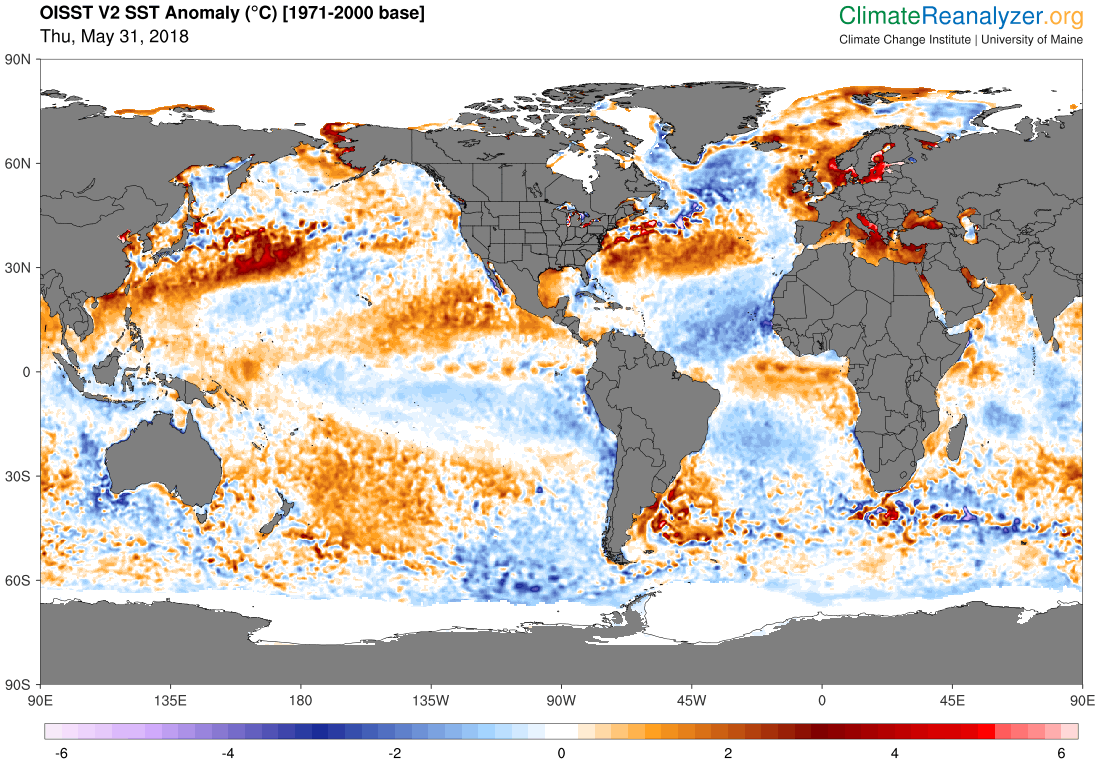
The NOAA 2018 Atlantic Hurricane Season Outlook issued on May 24 suggests 40% chance near-normal, 35% chance above-normal, and 25% chance below-normal hurricane activity. This prediction integrates model and statistical analyses, climate indices such as the Atlantic Multidecadal Oscillation (AMO), the expected emergence of El Niño, and cooler-than-normal sea surface temperature (SST) anomalies across the North Atlantic that would reverse the trend in summer. A few days later on May 31, the Tropical Meteorology Project of Colorado State University (OSU) released a similar outlook calling for near-average tropical storm activity. Most recently, on July 2, the OSU group issued an updated outlook that now suggests below-average hurricane activity owing to the persistence of cool surface anomalies in the North Atlantic. Major hurricanes can still develop and make landfall even during low activity years — even in Maine, however rare. But the projection of low storm activity this season has welcomed the news, particularly after the severe 2017 hurricane season (Article: Extremely active 2017 Atlantic hurricane season finally ends, November 30, 2017, NOAA website).
But why is the North Atlantic cooler than normal? The answer is “wind”. Since January of this year, a tripole of cool-warm-cool surface temperature anomalies has developed in association with persistent atmospheric patterns of the positive phase of the atmospheric North Atlantic Oscillation (NAO). NAO+ represents a steep poleward gradient and strong westerly and easterly winds over the middle and low latitudes. These wind belts are referred to the westerlies and trades, respectively. SSTs tend to decline under strong winds from a combination of factors: evaporative cooling, cold water advection (such from the Labrador Sea to the subpolar gyre south of Greenland), upwelling, and increased transport of dust off the Sahara. A similar cooling occurred over the North Atlantic in 2014–2015, but warm conditions have otherwise been the norm mostly for the past two decades. Thus, here is a good example of how natural variability can still bring cold spells in a warming climate.