Spring 2020
Weather and Climate Review: Spring 2020
By Dr. Sean Birkel, Maine State Climatologist
Statewide Overview
The Maine statewide climatological spring (March-May [MAM]) 2020 average temperature was 39.6 °F, or 72nd percentile for the 125-year record period beginning 1895 (Fig. 1). This temperature is 2.4 °F warmer than that observed for the same period in 2019, and 1.4 °F above the 1901-2000 historical mean. The observed MAM total precipitation was 9.4 inches, or 44th percentile for the record period (Fig. 2). This precipitation amount is 2.6 inches less than that observed in 2019, and 0.7 inches above the 1901-2000 historical mean, or near normal. In total for MAM 2020, there were 40 high and 33 low daily temperature, 32 high precipitation, and 42 high snowfall records either broken or tied statewide (data from NOAA Daily Weather Records).
-
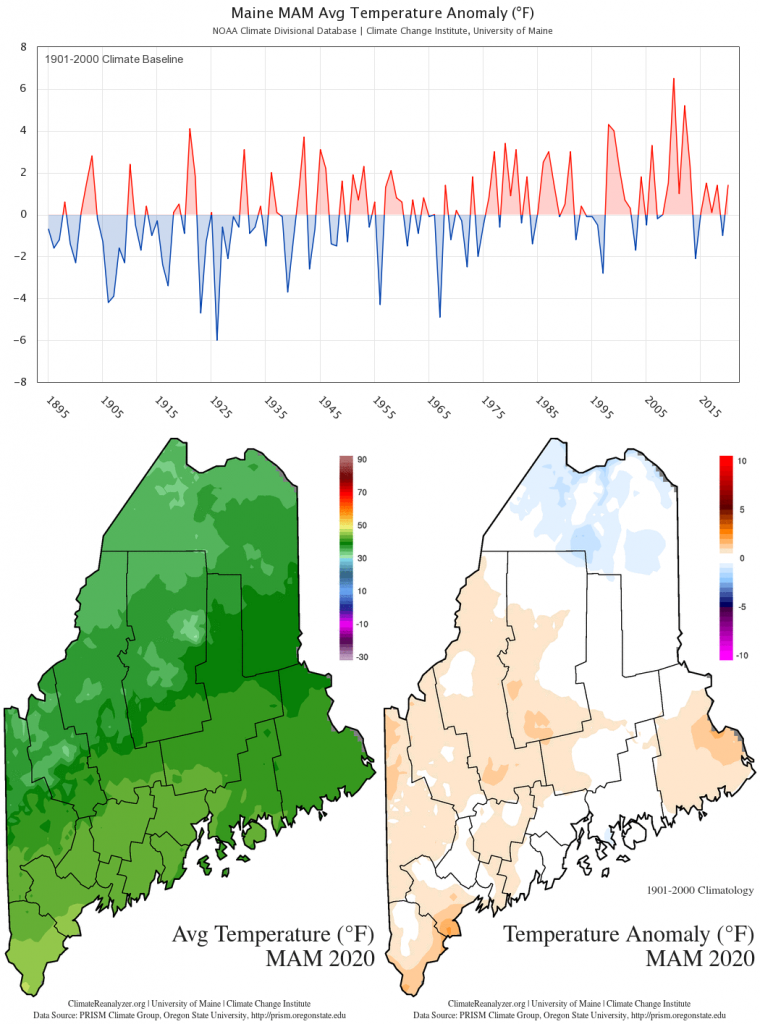
- Figure 1. Statewide MAM average temperature anomaly (1901-2000 baseline) timeseries and maps. Timeseries data from the NOAA U.S. Climate Divisional Database. Spatial data from the PRISM Climate Group. These charts are also available on the Maine Climate Office website.

-
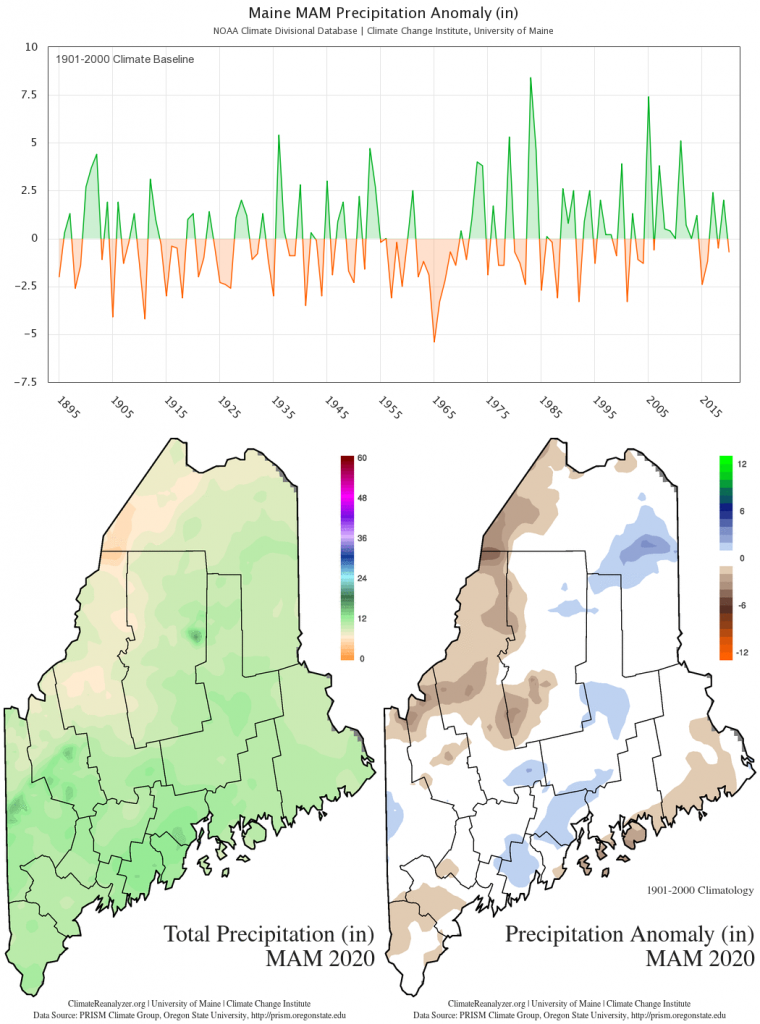
- Figure 2. Statewide MAM total precipitation anomaly (1901-2000 baseline) timeseries and maps. Timeseries data from the NOAA U.S. Climate Divisional Database. Spatial data from the PRISM Climate Group. These charts are also available on the Maine Climate Office website.

On the three-month average, spring 2020 was warmer than the 20th century baseline and had near normal precipitation. The season and individual month statistics are shown in Table 1.
| Temp / Anom (°F) | Percentile | Precip / Anom (in) | Percentile | |
|---|---|---|---|---|
| MAM | 39.6 / +1.4 | 72nd | 9.4 / -0.7 | 44th |
| Mar | 29.7 / +3.8 | 77th | 2.7 / -0.6 | 32nd |
| Apr | 37.9 / -0.4 | 40th | 4.1 / +0.8 | 75th |
| May | 51.4 / +0.9 | 63rd | 2.5 / -0.9 | 32nd |
Notable Weather and Climate Events
March: Unseasonably warm, especially across the coastal climate division and much of the central climate division where snow melted to expose bare ground by mid-month. March will also be remembered as the month the world changed, as on the 11th the World Health Organization declared COVID-19 a pandemic.
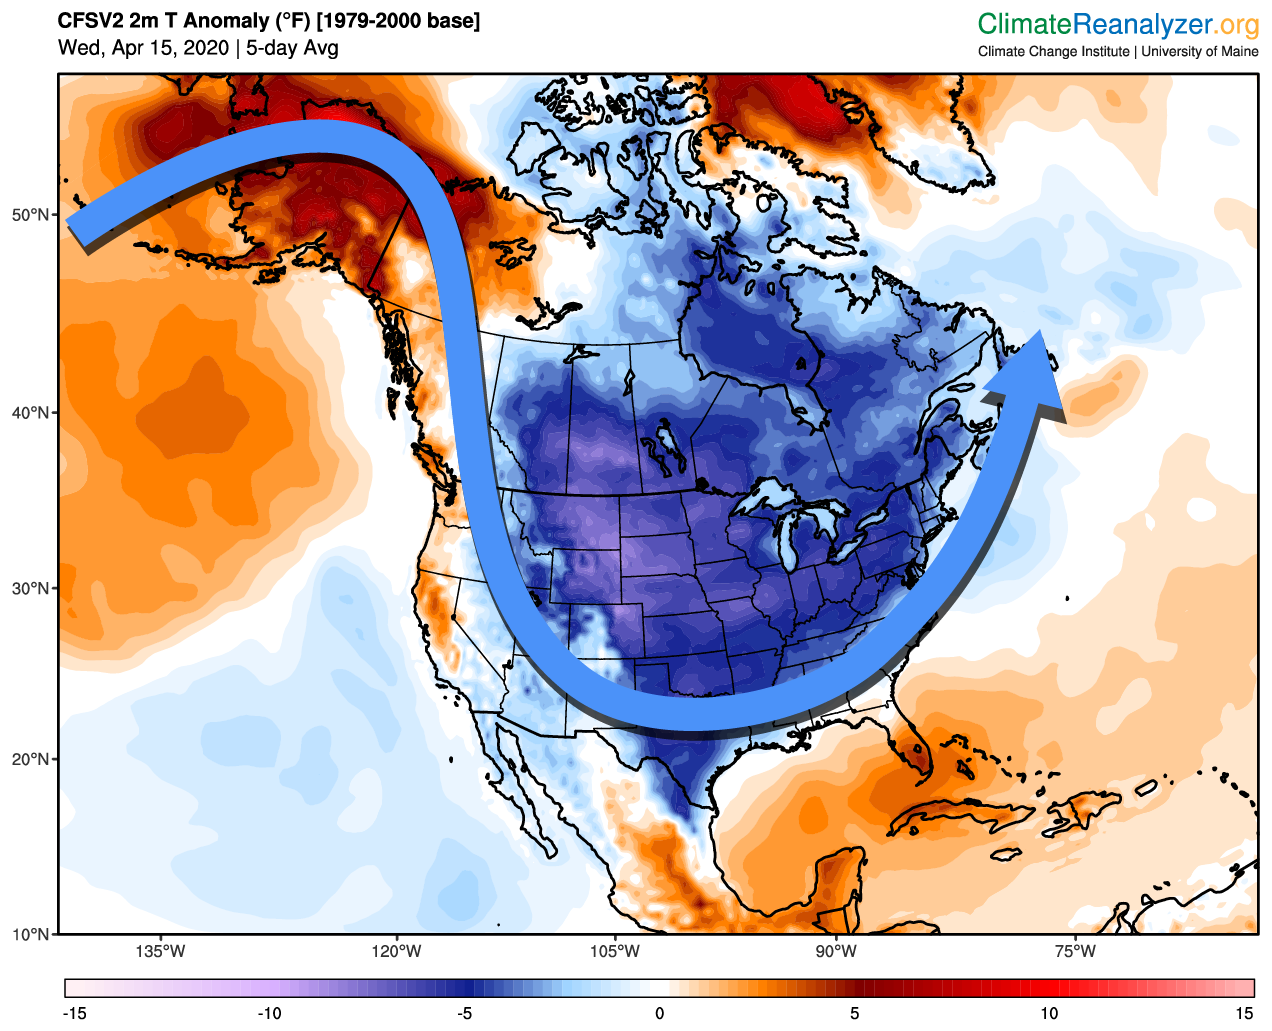
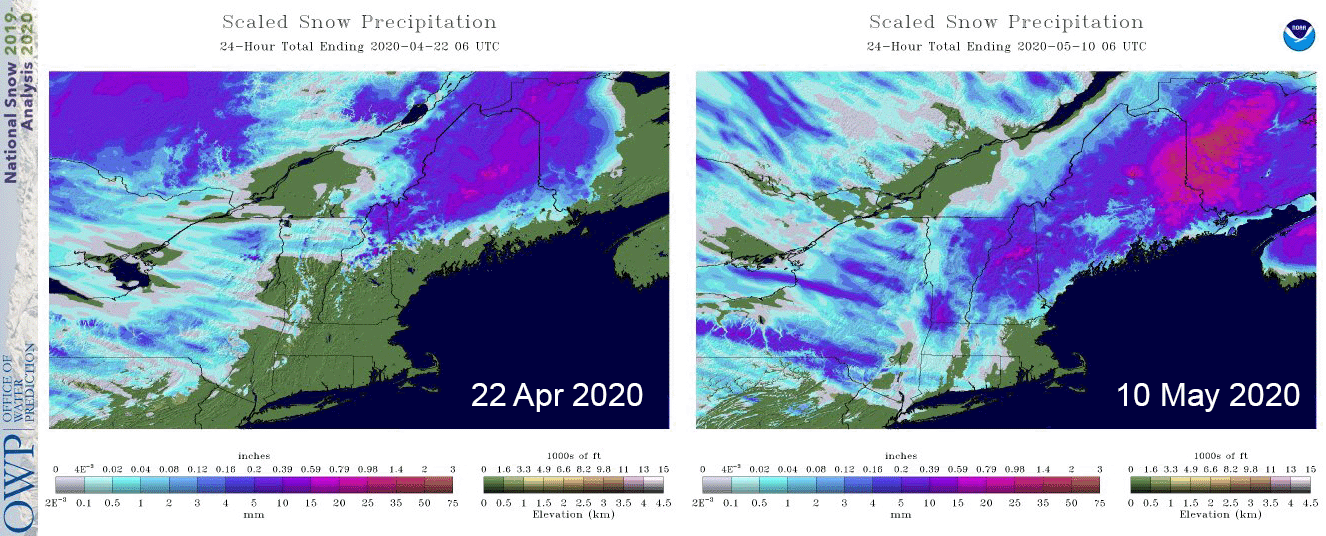
April-May: After a warm first week in April, unseasonably cold temperatures developed mid-month in association with a cool wave across the U.S. and southern Canada (Fig. 3). The change in weather pattern was accompanied by a powerful spring snowstorm on April 9-10 that dropped more than 10” of heavy, wet snow in some areas of coastal and central Maine, knocking out electricity to over 250,000 homes and businesses. Late season snowstorms also occurred April 21-22, and May 9 and 12 (Fig. 4) (also see snowfall total maps for the winter 2019/20 season produced by NWS-Caribou). In mid-May, the weather pattern changed from cool/wet to warm/dry, with the latter persisting into early summer.
Looking Farther Afield
Global Temperature: The MAM 2020 global average near-surface temperature ranks second warmest on record since widespread observations became available in 1880 (Fig. 5).
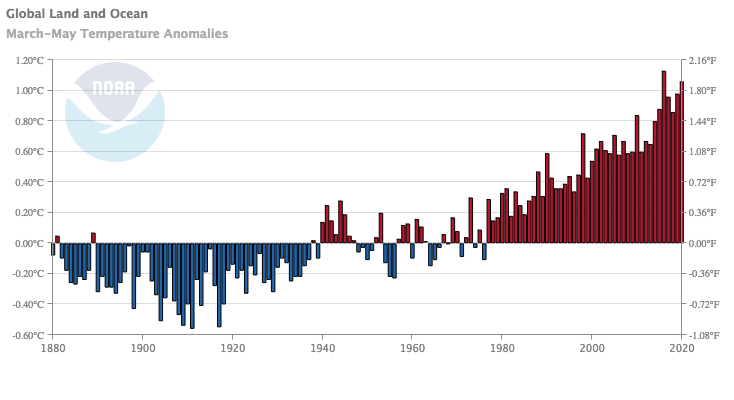
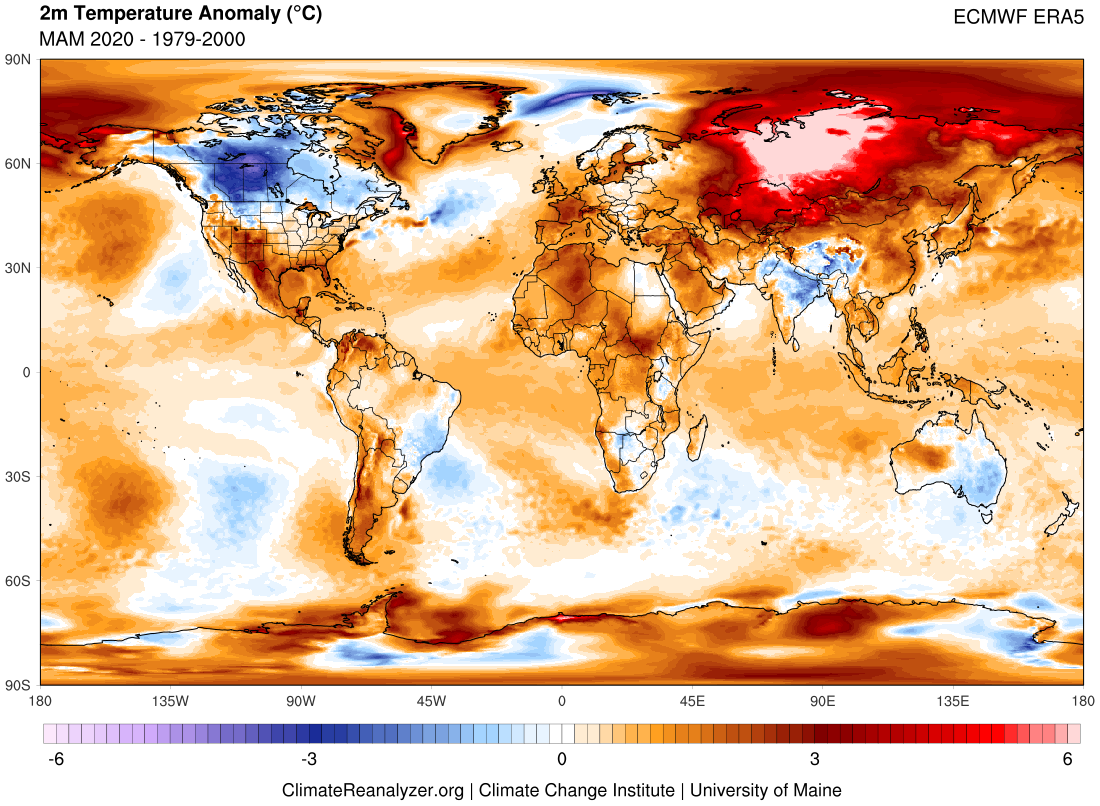
As with DJF 2020, the MAM global temperature is surprisingly high given the absence of a strong El Niño. However, the exceptionally strong positive phase of the Arctic Oscillation (AO) that developed early in the year persisted through March and into April, and restricted cold air mostly over Canada while temperatures soared to record highs across Siberia (Fig. 6).
Northern Hemisphere Sea Ice: The winter 2020 maximum sea ice areal extent in the Northern Hemisphere was reached 5 March, ranking 11th lowest for that day of year in the 1979-present satellite observation record (Fig. 7). By 31 May, the areal extent ranked 3rd lowest, tied with that of 2018, behind only 2019 and 2016. Much of the excess melting during this interval can be linked to warm airflow into the Arctic Basin via Siberia, associated with the aforementioned months-long heatwave.

Tools for accessing Maine historical climate data and current weather forecasts are available on the Maine Climate Office website. For U.S. and global visualizations, visit Climate Reanalyzer. The Maine Climate Office and Climate Reanalyzer are developed and maintained by Dr. Sean Birkel with supported from the Climate Change Institute at the University of Maine.