Summer 2019
Weather and Climate Review: Summer 2019
By Dr. Sean D. Birkel, Maine State Climatologist
Statewide Overview
The Maine statewide 2019 JJA average temperature was 64.1 °F, ranking 33rd warmest for the 125-year record period beginning 1895 (Fig. 1). This temperature is 1.2 °F cooler than that observed for the same period in 2018, and 1.4 °F warmer than the 1901–2000 historical mean. The observed JJA total precipitation was 12.6 inches, ranking 36th wettest on record since 1895 (Fig. 2). This precipitation amount is 1.1 inches greater than that observed in 2018, and 1.6 inches above the 1901-2000 historical mean. In total, there were 18 high and 6 low daily temperature records, and 69 high precipitation records either broken or tied statewide during the summer season (for detailed lists see the National Center for Environmental Information [NCEI] Daily Weather Records).
![Statewide JJA average temperature anomaly (1901-2000 baseline) timeseries and maps. Timeseries data from the NOAA U.S. Climate Divisional Database [2]. Spatial data from the PRISM Climate Group [3]. See also Monthly Climate Data [4] on the Maine Climate Office website.](https://extension.umaine.edu/maineclimatenews/wp-content/uploads/sites/37/2019/09/fig1-228x300.png)
![Statewide JJA total precipitation anomaly (1901-2000 baseline) timeseries and maps. Timeseries data from the NOAA U.S. Climate Divisional Database [2]. Spatial data from the PRISM Climate Group [3]. See also Monthly Climate Data [4] on the Maine Climate Office website.](https://extension.umaine.edu/maineclimatenews/wp-content/uploads/sites/37/2019/09/fig2-228x300.png)
In terms of individual months, June was relatively cool/wet, July was hot/dry, and August was warm/wet (Table 1). The particular conditions in June facilitated a “bumper crop of ticks, blackflies and mosquitoes”. Moreover, the cool/wet start to summer followed a cool/wet spring, where snowcover lasted into the second week of April across much of the southern half of Maine, and into early May in the northern climate division and highlands. There was also unusually late-lasting snow on Katahdin in Baxter State Park, where trails on the mountain remained closed until June 15th. The last vestiges of snow in sheltered areas high up lasted into the first half of July.
| Temp / Anom (°F) | Rank | Precip / Anom (inches) | Rank | |
| JJA | 64.1 / +1.4 | 33rd warmest | 12.6 / +1.6 | 36th wettest |
| June | 59.4 / +0.4 | 42nd coolest | 4.7 / +0.9 | 27th wettest |
| July | 68.4 / +3.1 | 10th warmest | 3.3 / -0.5 | 38th driest |
| August | 64.6 / +1.6 | 42nd warmest | 4.6 / +1.1 | 24th wettest |
Table 1. Statewide 2019 JJA season and monthly temperature and precipitation statistics. “Anom” refers to anomaly, or the departure from the 1901-2000 historical mean. Data are from the NOAA U.S. Climate Divisional Database accessible through NOAA/NCEI Climate at a Glance.
July 2019 ranked 10th warmest on average statewide since 1895. It was also during July that 15 of the summer’s 18 daily high temperature records were achieved. The most anomalous warmth was in southernmost section of the state, where Portland registered its warmest month on record (72.9 °F) since continuous local observations began in 1940.
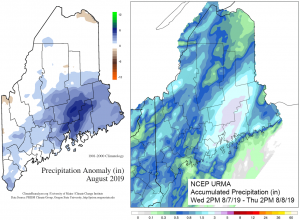
August was the wettest month of the 2019 JJA season on a statewide average. However, the surplus rainfall was largely concentrated in the coastal and central climate divisions, weighted towards the east, and with a conspicuous region of high precipitation across Knox, Waldo, Penobscot (southern two-thirds), and Washington counties (Fig. 3a). This latter pattern developed from a single storm event August 7–8, where some observation sites received 2-4 inches of rain (Fig. 3b). The northern climate division saw near-normal rainfall amounts in June and August, and less rainfall than usual in July.
Global Perspective
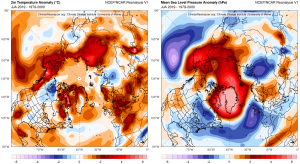
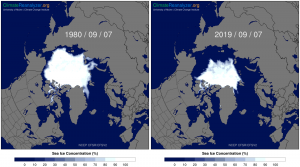
The 2019 JJA season saw a number of significant climate events. June and July both set global high temperature records for those respective months with observations beginning 1880. August tied with 2015 and 2017 for 2nd warmest; the three-month JJA mean also ranks 2nd, tied with 2016 for record warmest across the Northern Hemisphere. A major heat wave engulfed parts of Europe in late June toppling all-time high temperature records in several countries, including in France where a temperature of 114.6 °F was observed in a southern village. Unusual heat extended into the Arctic, where reanalysis data beginning in 1948 showed the 2019 JJA season ranking 2nd warmest behind only 2016 (Fig. 4). This Arctic heat was facilitated by anomalous high pressure that brought mostly cloudless skies and record or near-record melt across the Greenland Ice sheet and the Arctic Basin. This was also a record year for wildland forest fire activity over parts of the Arctic, including Alaska where July was the state’s warmest month on record. Arctic sea ice extent tracked at record low values for parts of June, July, and August. As of September 16th, this year’s sea ice minimum will be either third or fourth lowest on record since continuous satellite observations began in 1979 (Fig. 5).
Fall Outlook
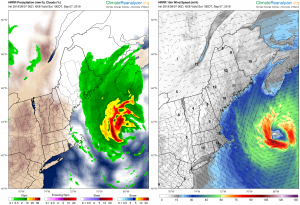
Much of Maine has seen cooler and wetter than normal conditions during the first two weeks of September. The current National Weather Service three-month fall (September-November) outlook suggests 65% probability of above normal temperature and equal chance for above, normal, or below normal precipitation (Fig. 6). This is of course the Atlantic hurricane season (June-November), and on September 7th Hurricane Dorian passed by the Gulf of Maine and then made landfall over Nova Scotia as an extratropical cyclone with 100 mph winds (Fig. 7). In Maine, impacts from the storm were limited to rain, gusty winds, and high surf, mostly Down East. A few days earlier, Dorian made a devastating landfall in the Bahamas as a Category 5 hurricane with 185 mph winds and gusts up to 220 mph before impacting Florida and the U.S. southeast coast with Category 2 and 3 winds. Hurricane Dorian ranks as the strongest Atlantic hurricane to make landfall (see Wikipedia for a detailed storm history). Refer to the National Hurricane Center for tropical weather outlooks.
![Three-month (SON) temperature and precipitation outlooks from the NWS Climate Prediction Center [17].](https://extension.umaine.edu/maineclimatenews/wp-content/uploads/sites/37/2019/09/fig6-300x147.png)