Summer 2020
Maine Summer 2020 Climate Summary and Drought Update
By Dr. Sean Birkel, Maine State Climatologist
Summary Statement
On the three-month average, summer 2020 was considerably warmer than the 20th-century baseline and saw the development of the most severe short-term drought since the early 2000s. The drought has caused a significant impact on water resources and agriculture across much of the state. Notable aspects of this drought are the record number of days without rainfall for some observation sites, and record low water level and flow on at least the Piscataquis and St. John rivers. Drought persists despite beneficial rainfall in late September and early October. Refer to the NOAA Climate Prediction Center for the latest temperature and precipitation outlook guidance.
Statewide Overview
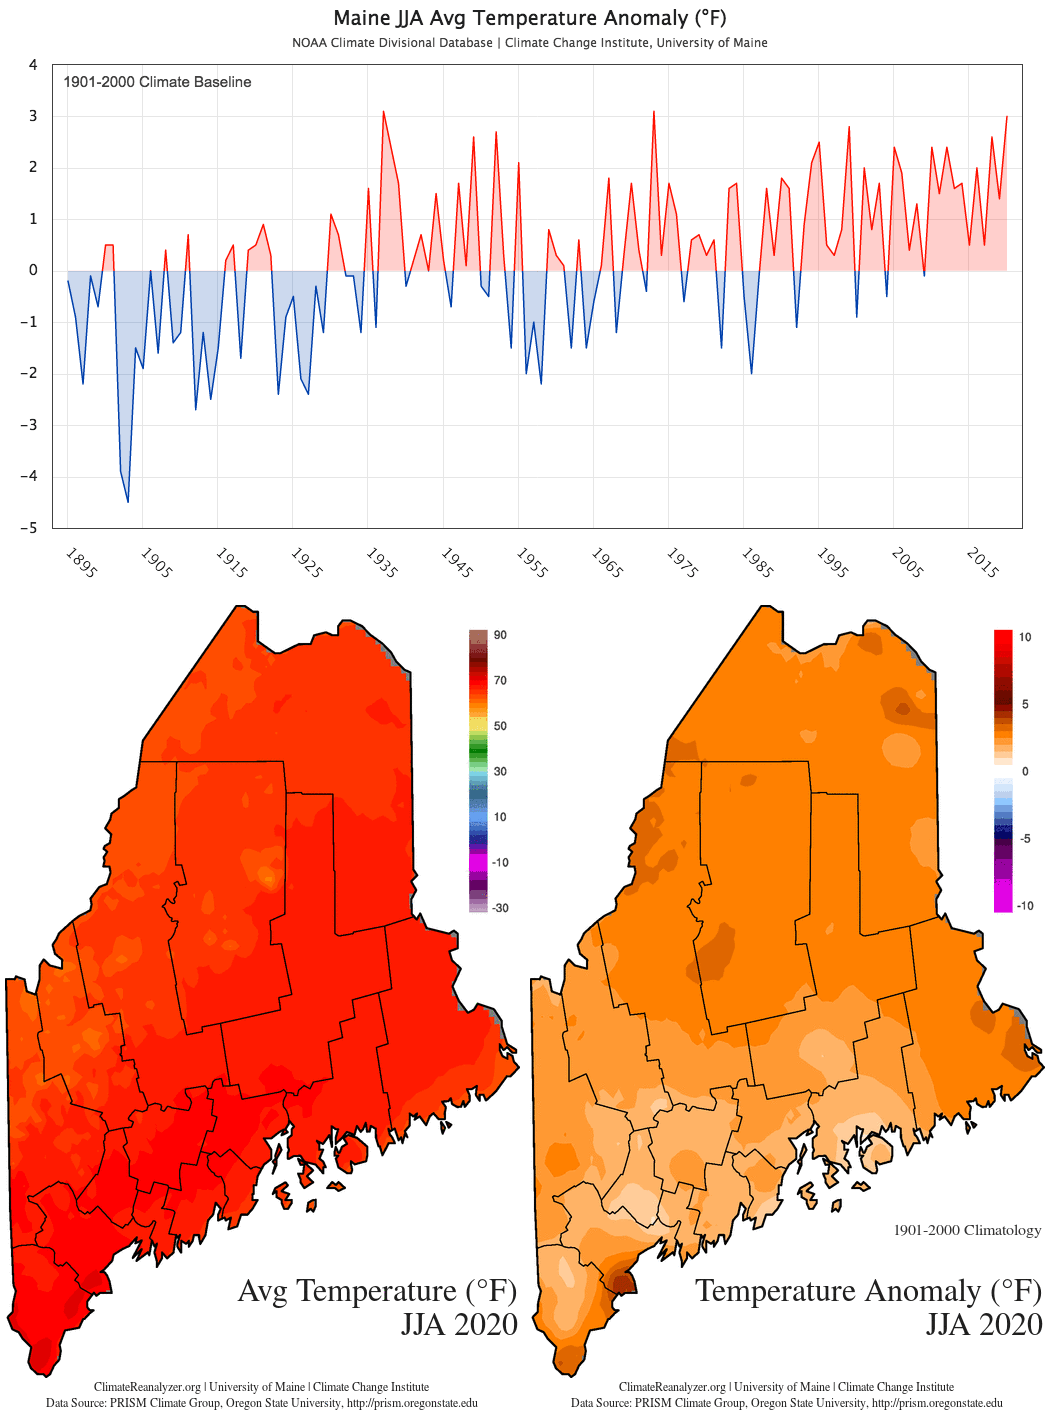
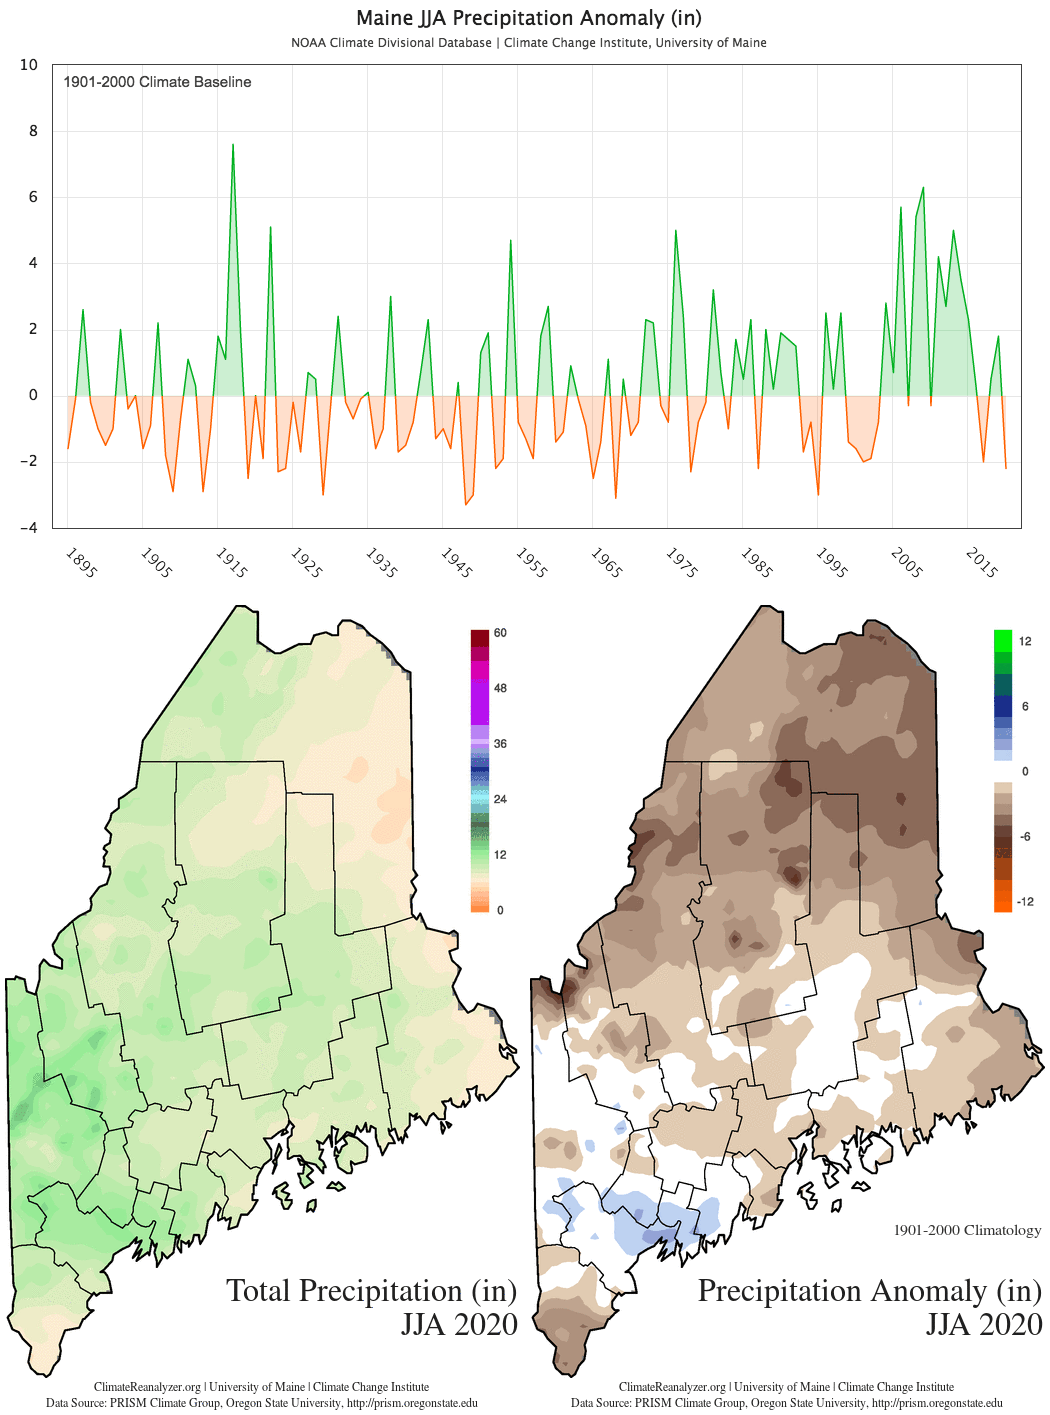
The Maine statewide climatological summer (June-August [JJA]) 2020 average temperature was 65.7°F or 3rd warmest on record for the 125-year period beginning 1895 (Fig. 1). This temperature is 1.6°F warmer than that observed for the same period in 2019, and 3°F above the 1901-2000 historical mean. The observed JJA total precipitation was 8.8 inches or 14th driest (10th percentile) for the record period (Fig. 2). This precipitation amount is 4 inches less than that observed in 2019, and 2.2 inches below the 1901-2000 historical mean, or near normal.
| Temp / Anom (°F) | Percentile | Precip / Anom (in) | Percentile | |
|---|---|---|---|---|
| JJA | 65.7 / +3.0 | 98th | 8.8 / -2.2 | 10th |
| Jun | 62.5 / +2.7 | 91st | 2.3 / -1.5 | 13th |
| Jul | 68.9 / +3.6 | 97th | 3.8 / 0 | 47th |
| Aug | 65.7 / +2.7 | 85th | 2.7 / -0.8 | 28th |
| Tied or Broken | |
|---|---|
| Highest Maximum Temperature | 63 |
| Lowest Maximum Temperature | 15 |
| Highest Minimum Temperature | 94 |
| Lowest Minimum Temperature | 24 |
| Highest Precipitation | 21 |
Drought (May – September)
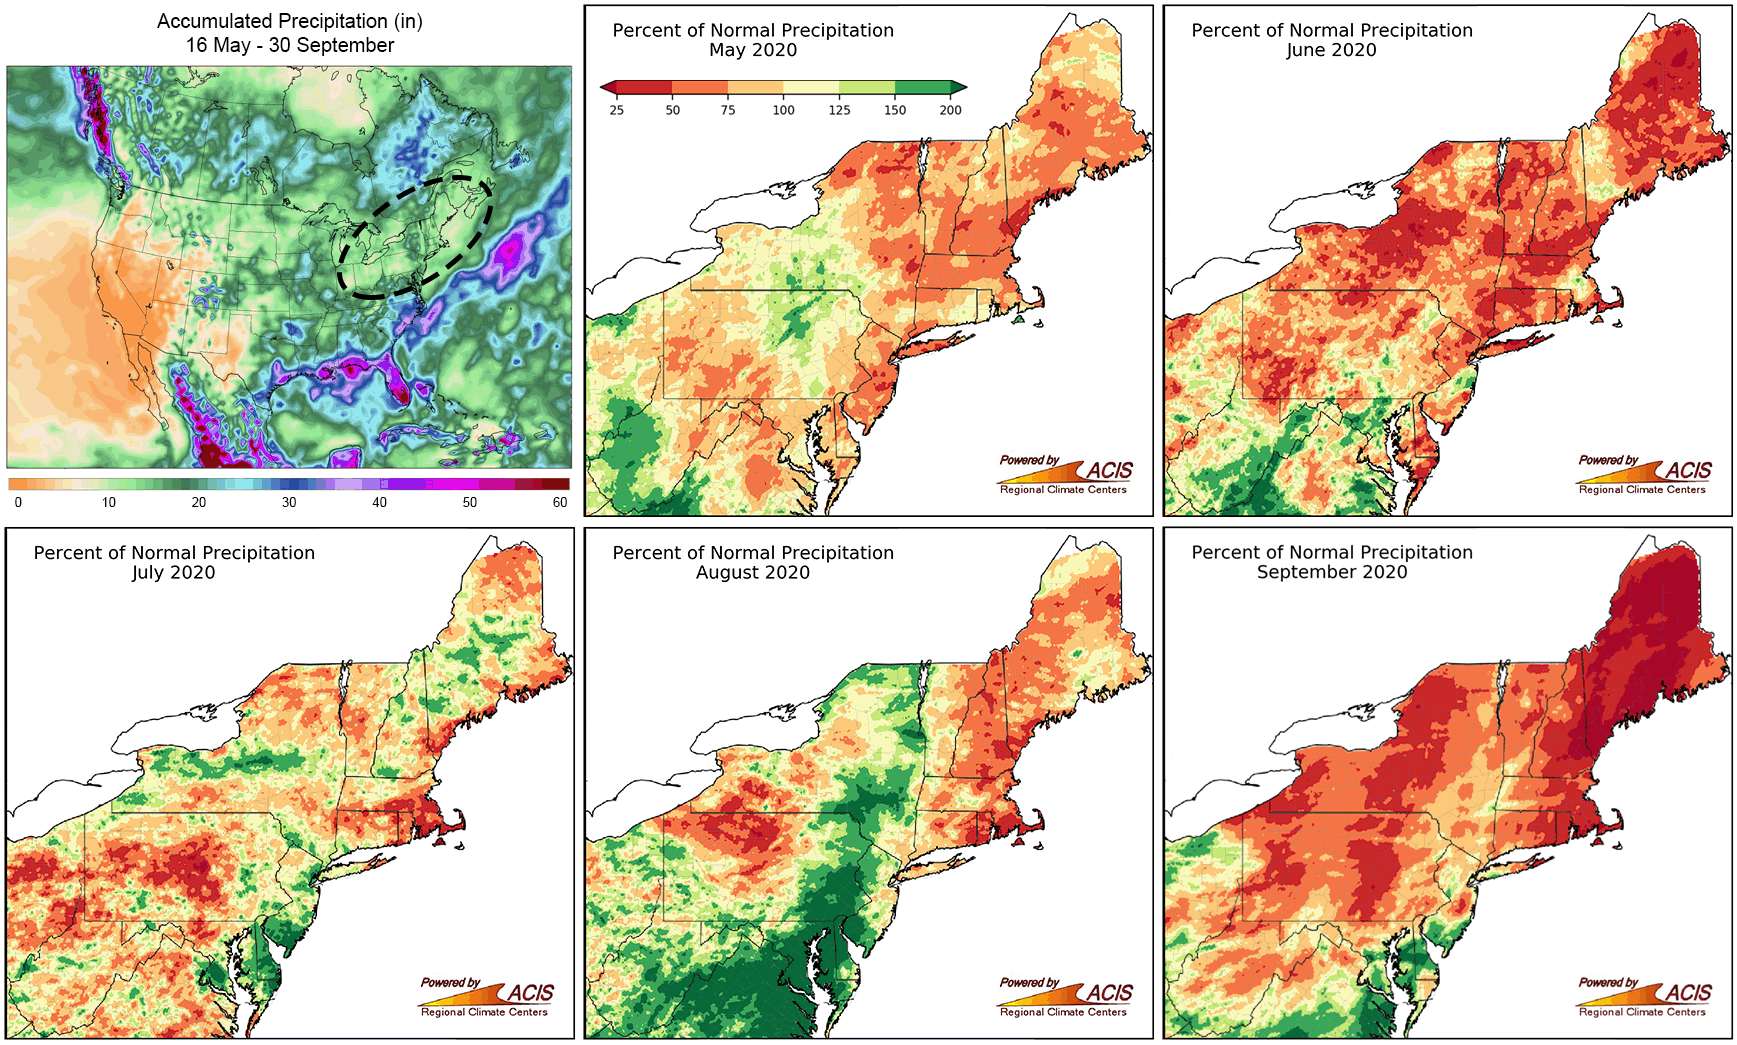
Until the middle of May, precipitation across Maine was near-normal, and late-season snowstorms and snowpack in the northern climate division gave little indication that the worst drought since the early 2000s would soon develop. But then rainfall deficits emerged across the Northeast region as week-after-week storm systems generally tracked either north of the St. Lawrence or to the south (Fig. 3). Most areas in Maine saw precipitation accumulations (Fig. 4) dip below normal in mid-May, and by mid-June much of the state was ranked abnormally dry by the U.S. Drought Monitor.
Despite some beneficial rainfall toward the beginning of the month, dryness intensified in July to moderate drought across much of the state, except for northern Aroostook County where conditions worsened to severe drought, and westernmost Maine where conditions improved. By this time Maine was also experiencing its worst fire season in over a decade. Moderate to severe drought persisted across the state throughout August, presenting mounting impacts to agriculture, especially to some farms without irrigation systems.
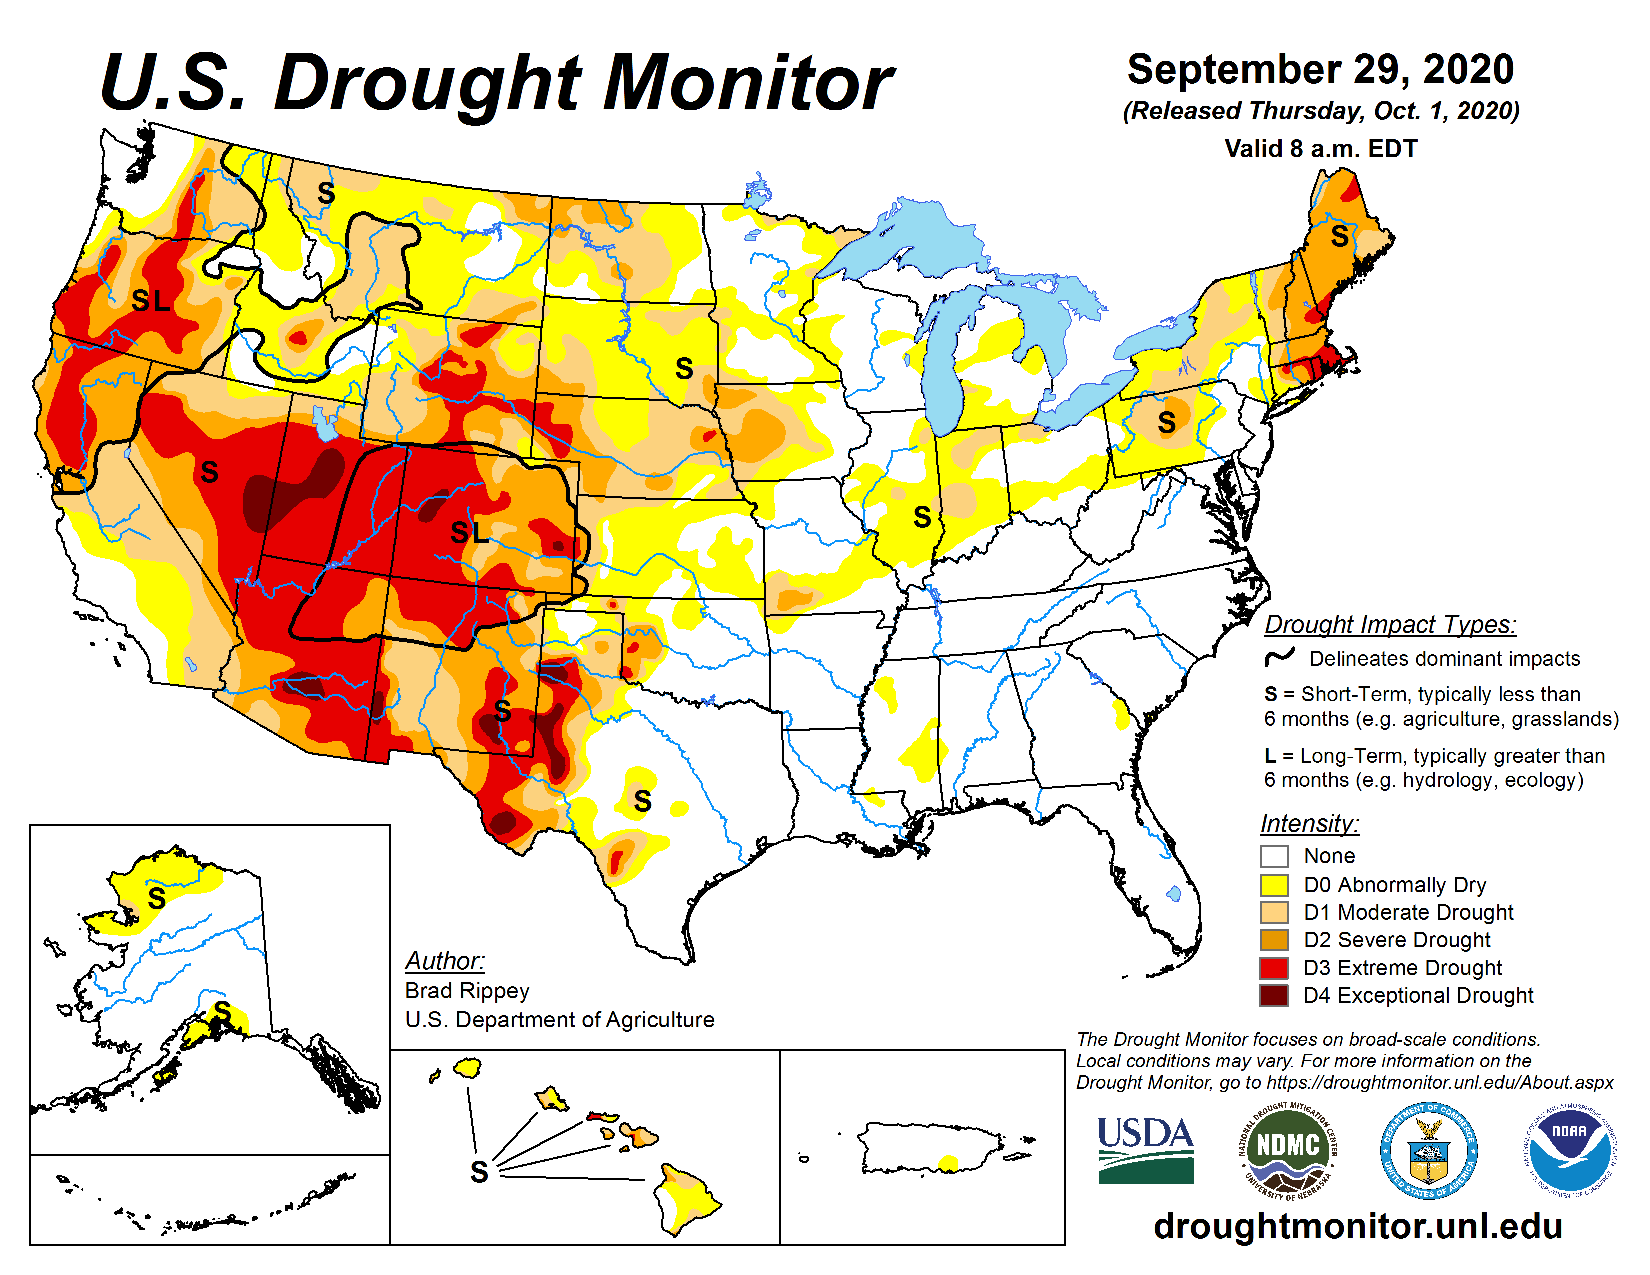
Yet again, despite beneficial precipitation at the end of August, conditions deteriorated further throughout September, and by month’s end, most areas were in severe drought (Fig. 5). Enclaves in southern and northern Maine were in extreme drought with increasing stress on groundwater and streamflows. For example, the Piscataquis River water level was the lowest for late September in 117 years of observation in the town of Guilford, and the Saint John and Aroostook River basins saw record low flows with significant bed riverbed exposure.
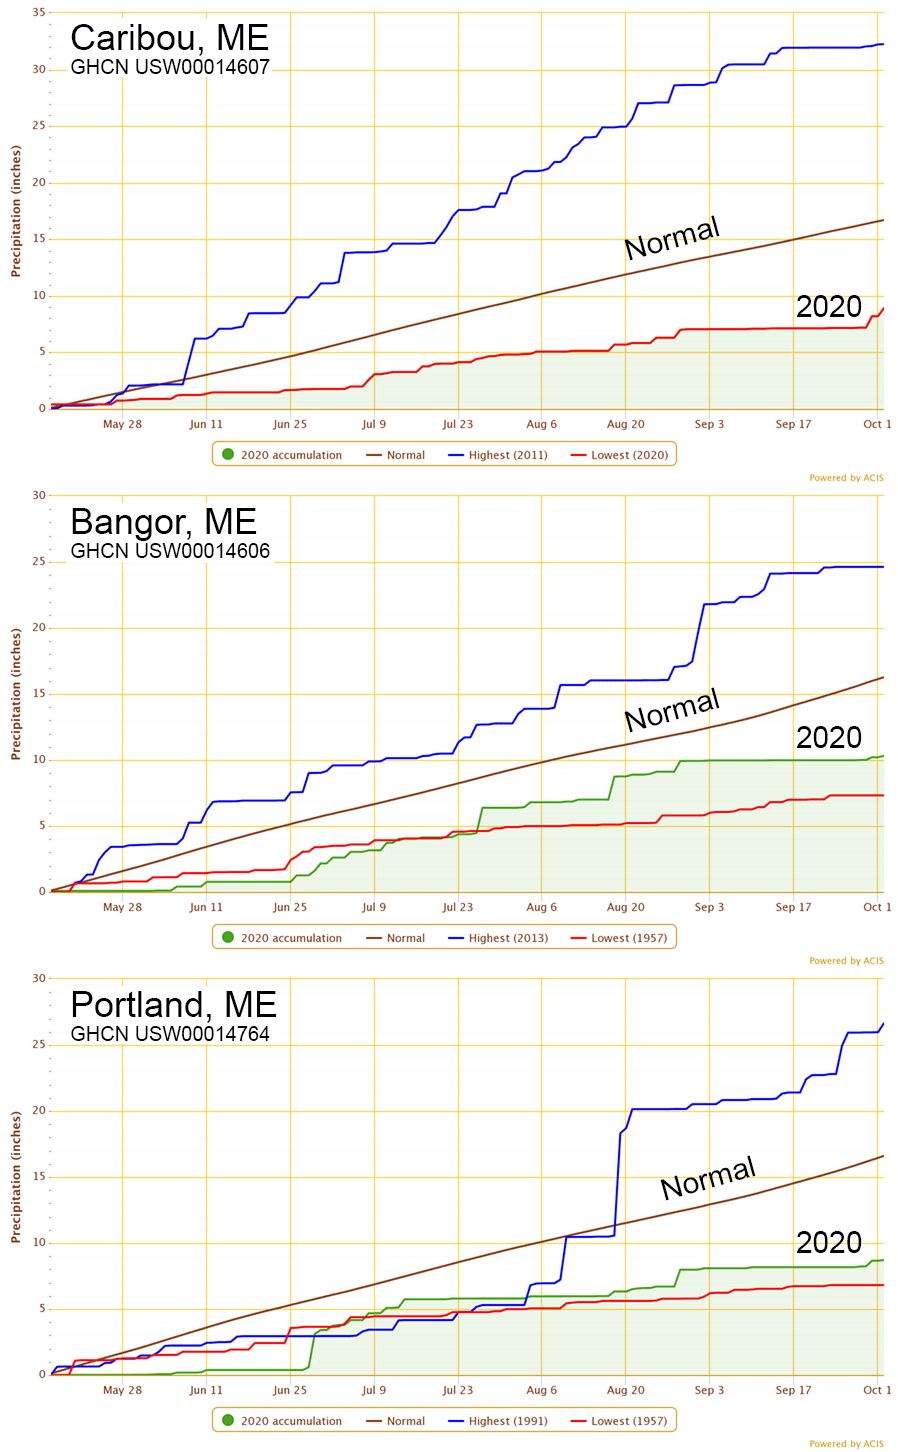
In late September, Aroostook County was designated as a drought disaster area by the U.S. Secretary of Agriculture, which made farm operators in Aroostook and adjacent counties eligible for emergency assistance from the USDA Farm Service Agency (see more information on the Maine Emergency Management Agency drought hazard notice and from this USDA list of drought programs and assistance). By 1 October, rainfall deficits reached 6.9 inches in Portland, 6.2 inches in Bangor, and 7 inches in Caribou (Fig. 4), and greater than 10 inches in Houlton. Likewise, Houlton had its driest period on record between 16 May and 15 September, and Bangor saw a record 31 days without precipitation from 30 August to 29 September. Rainfall on 30 September and 2 October, over an inch total in some areas, was helpful but not nearly enough to alleviate the drought.
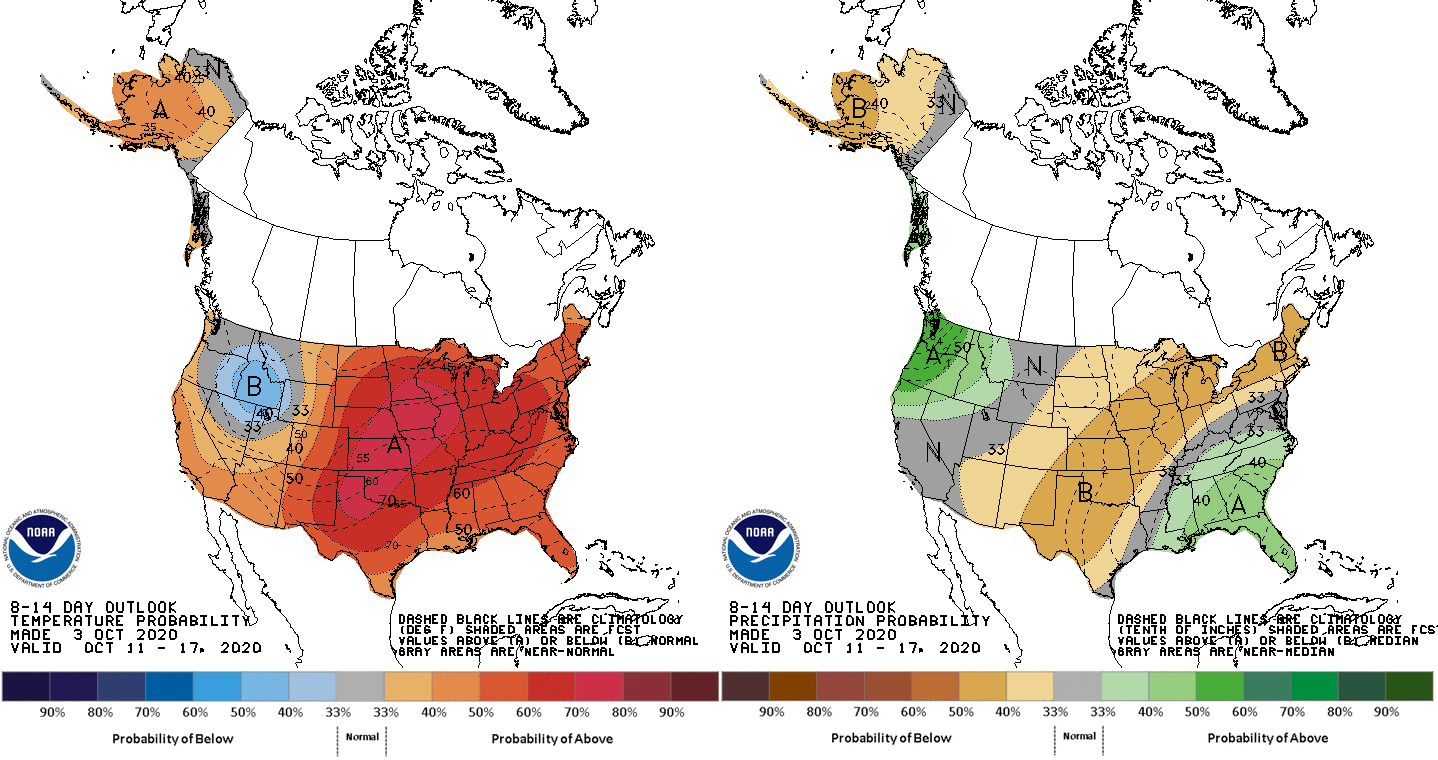
The latest guidance from the NOAA Climate Prediction Center suggests a likelihood of above normal temperature and below normal rainfall over the next two weeks (Fig. 6). Significant rainfall is needed in the next couple of months for groundwater to replenish before winter; otherwise, effects of the 2020 drought could carry into next spring. Additional drought information and resources can be found at the Northeast Regional Climate Center, Northeast Drought Early Warning System, and the Northeast Climate Hub.
Looking Farther Afield
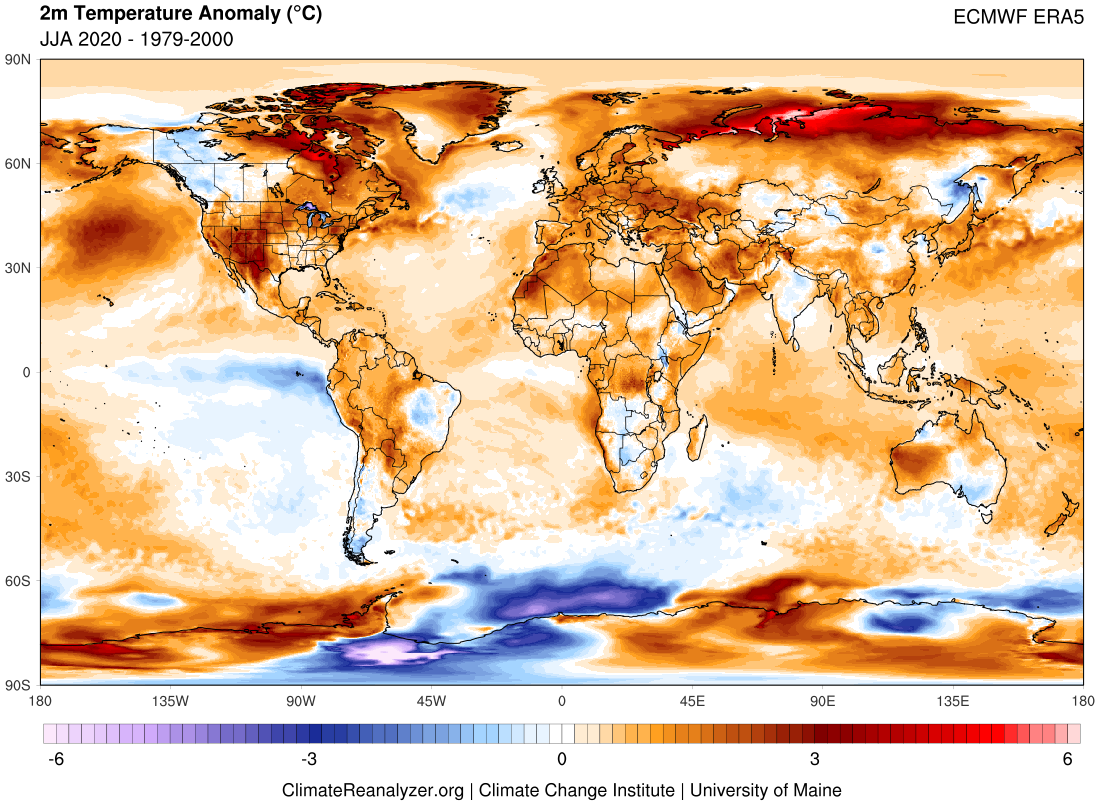
Global Temperature: The JJA 2020 global average near-surface temperature ranks third warmest on record since 1880 (Fig. 7). A global map of JJA temperature anomalies (Fig. 8) shows unusual warmth over the coastal areas of northeastern Siberia, and over Hudson Bay and parts of the Canadian High Arctic; the cool near surface conditions over the equatorial Pacific extending westward from South America are associated with the development of La Niña conditions. Elsewhere, JJA is austral winter, when large temperature contrasts are common. In a cursory examination of ERA5 reanalysis, the anomalous cold over Antarctica between 45W-90W (Filchner-Ronne Ice Shelf) may represent the coldest JJA for the area since 1979 in association with a persistent atmospheric blocking pattern.

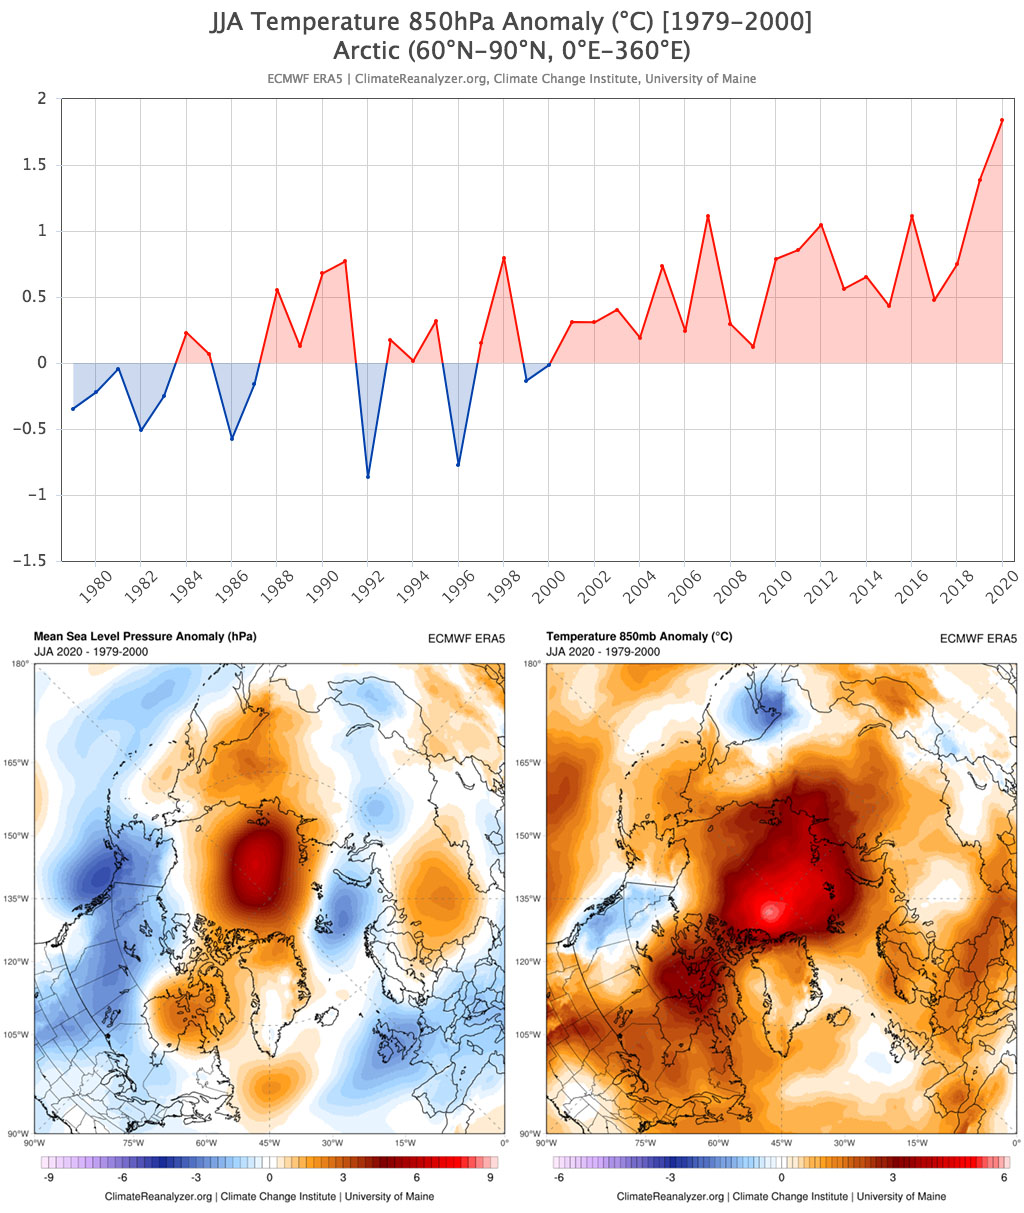
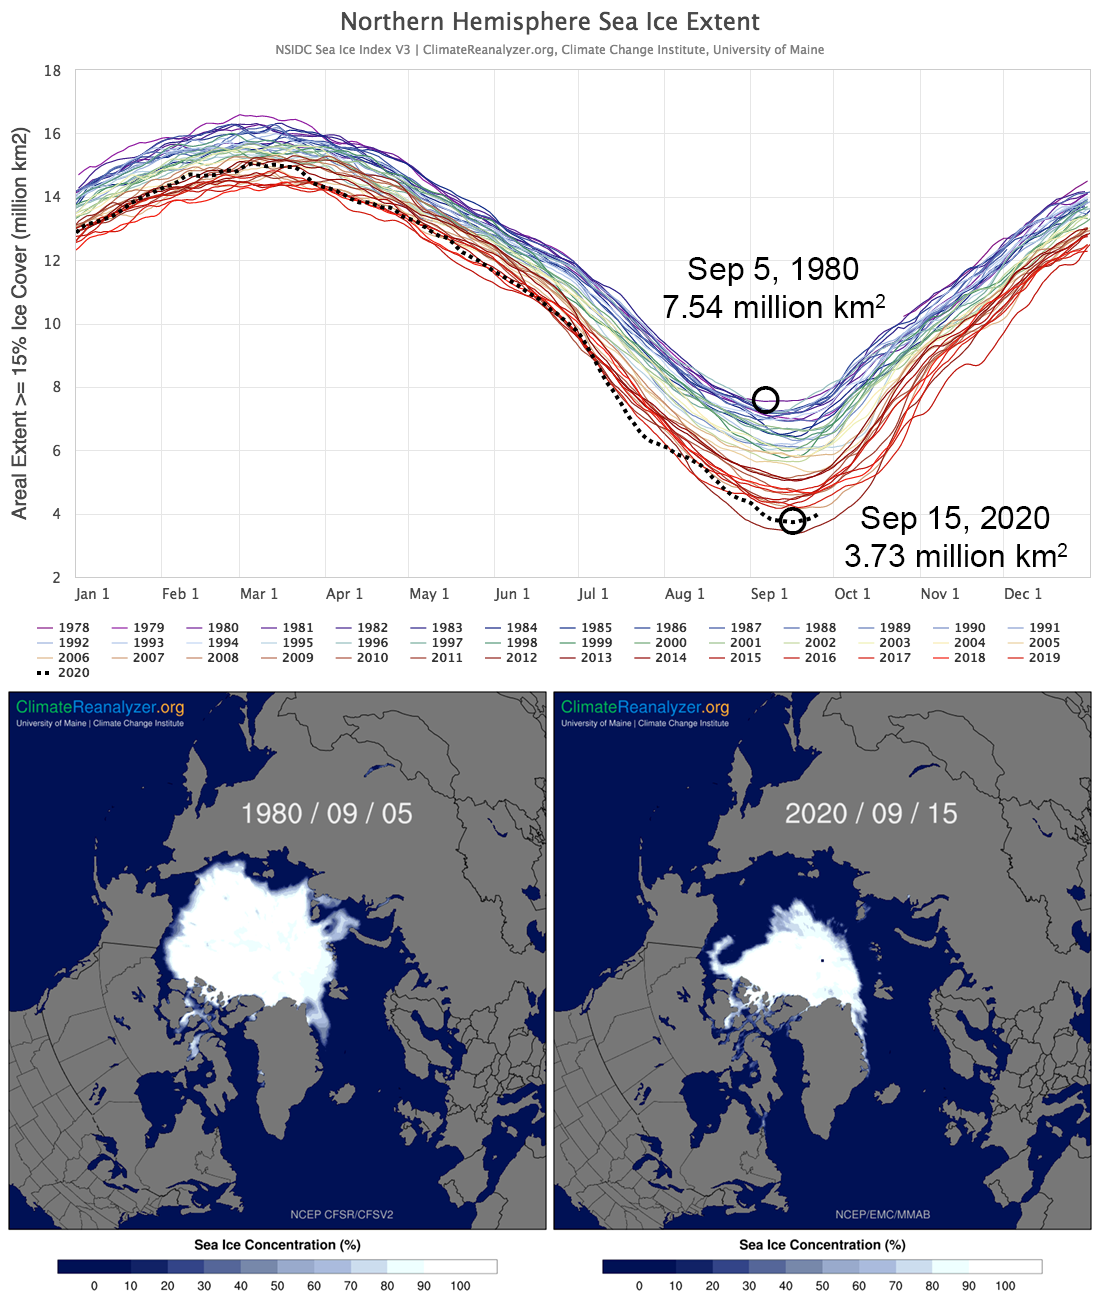
Arctic Temperature and Northern Hemisphere Sea Ice: The global map of near-surface temperature belies the record heat dome that developed across the Arctic this summer in association with a predominance of high atmospheric pressure (Fig. 9). Indeed, air temperature at 850 millibars (typically around 4,000 ft elevation), is about 1.3 °F (0.72 °C) above the previous high temperature records set in 2007, 2012, and 2016. The 2020 melt season got off to an early start, primed by the record Siberian heatwave and wildfires in spring, and many observers thought a new minimum sea-ice extent record might be on the horizon. However, after rapid ice melt under ideal atmospheric conditions through most of June and July, circulation patterns changed in August, melt slowed, and ultimately the September sea-ice minimum was the second lowest on record since satellite measurements began in late 1978 (Fig. 10).
Extremely Active Atlantic Hurricane Season: Near-record warmth across the North Atlantic Ocean and the emergence of La Nina over the equatorial Pacific have contributed to an extremely active Atlantic hurricane season, so far rivaled only by 2005. With well over a month before the season ends, there have already been 24 named storms, and the National Hurricane Center has, for only the second time, begun identifying storms using the Greek alphabet. So far, nine named storms have made landfall this season in the U.S., tying a record from 1916. Refer to the 2020 Atlantic hurricane season Wikipedia page for more information.
Western U.S. Wildfires: Unusually warm, dry weather set the stage for a record fire season across large swaths of the western U.S. The hardest hit states were California, Oregon, and Washington, whereby the middle of September a total of 5.2 million acres of land had burned, leaving many communities devastated. Smoke from the fires repeatedly spread aloft across large swaths of the U.S. (including Maine!) and caused unhealthy air quality particularly across significant areas of California. As noted in the news media and on the 2020 western U.S. wildfire season Wikipedia page, the fires were variously caused by lightning strikes, human accidents, and possible cases of arson. However, it is widely agreed upon that climate change underpins the increased wildfire risk in the west, as highlighted by several articles in the New York Times.
Maine historical climate data and current weather forecasts are available on the Maine Climate Office website. For U.S. and global climate and weather data, visit Climate Reanalyzer. The Maine Climate Office and Climate Reanalyzer are developed and maintained by Dr. Sean Birkel with support from the Climate Change Institute at the University of Maine.