Summer 2021
Maine Summer 2021 Climate Summary
By Dr. Sean Birkel, Maine State Climatologist
- Highlights
- Statewide Overview
- Drought Signal Carries into 2021, but Conditions Less Severe
- Looking Farther Afield
- Mid-November Update
Highlights
- The 2021 summer (June–July) was 4th warmest and 49th driest since 1895.
- A drought signal from 2020 carried into this year, but impacts during the summer were less severe due to sufficient beneficial rains.
- The 2021 August minimum monthly temperature was warmest on record owing to record high atmospheric moisture content.
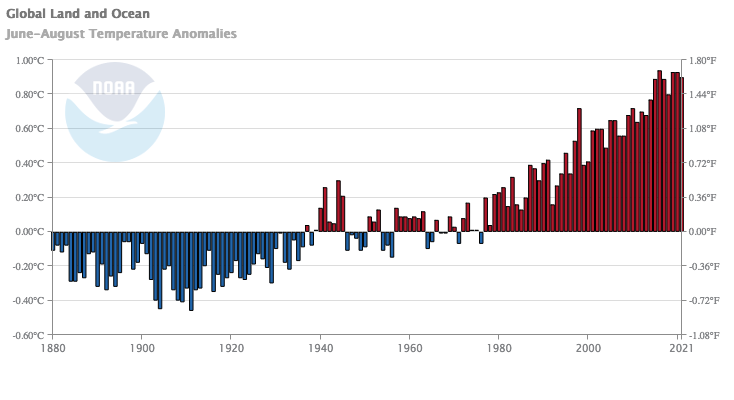
- Global JJA average temperature was 4th warmest since 1880.
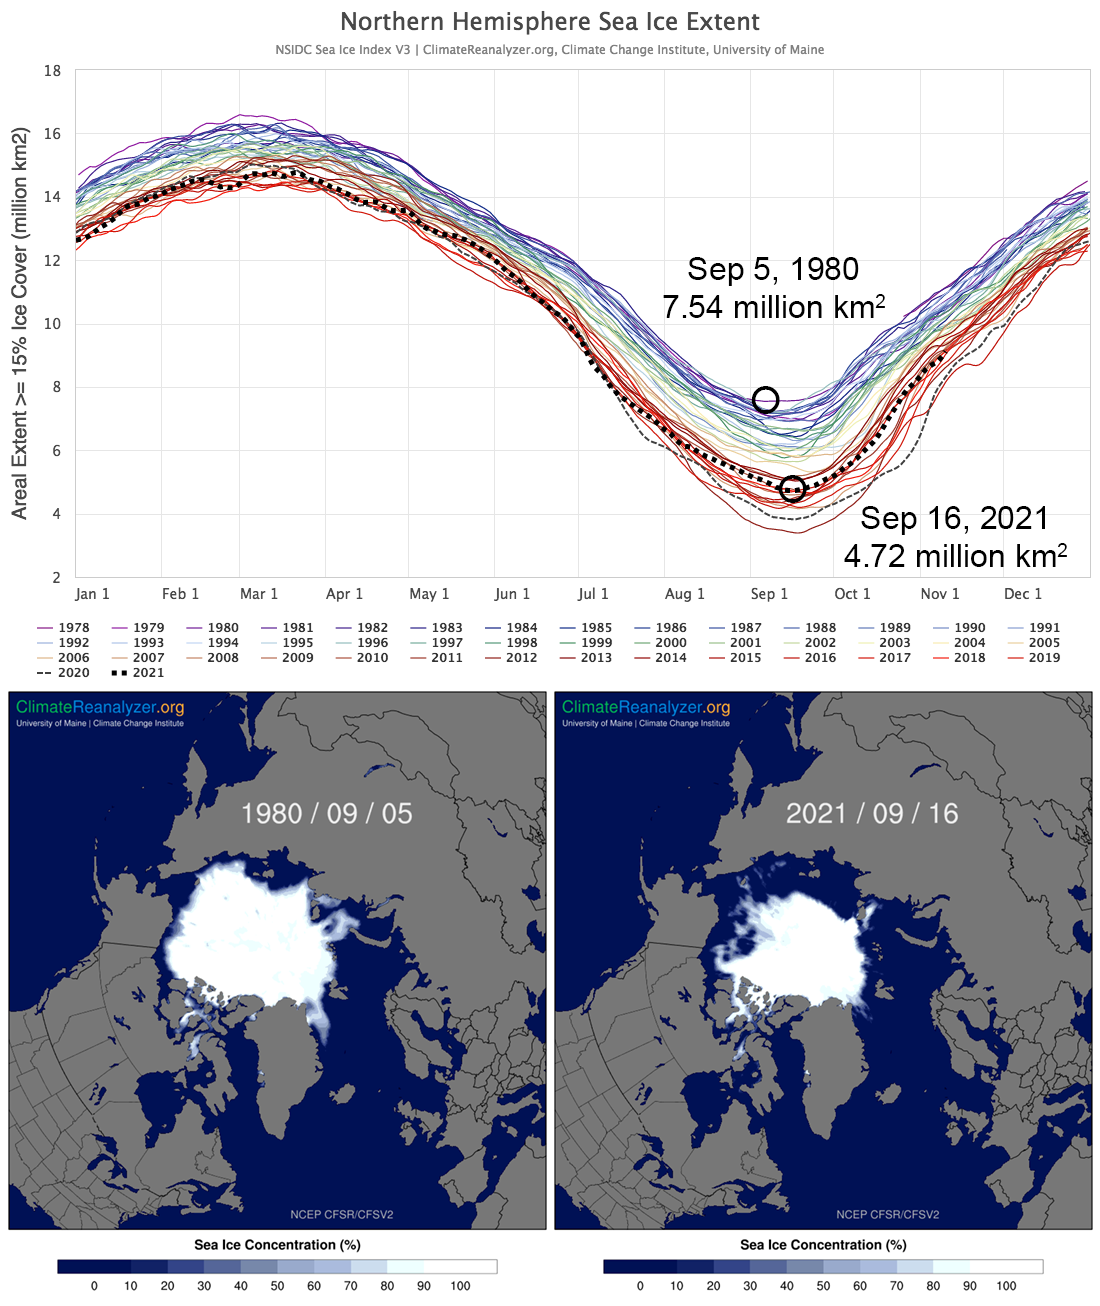
- The minimum extent of Arctic sea ice, which occurs annually in September, ranked 11th lowest for the era of satellite observations.
- Cool La Niña conditions have developed across the equatorial Pacific and are expected to influence global weather patterns this winter.
Statewide Overview
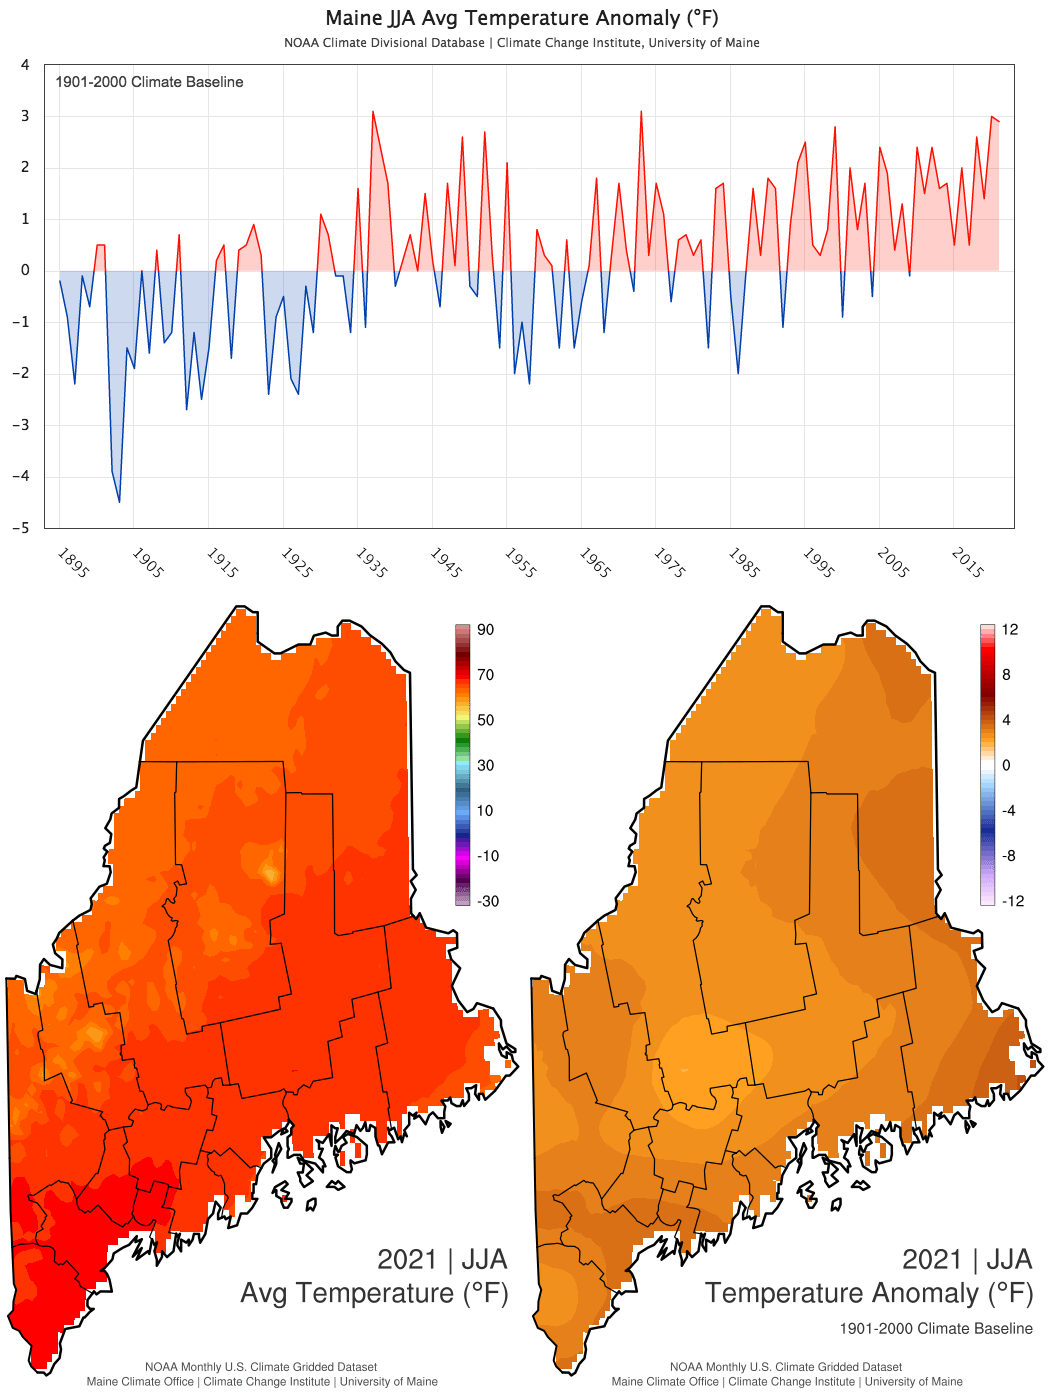
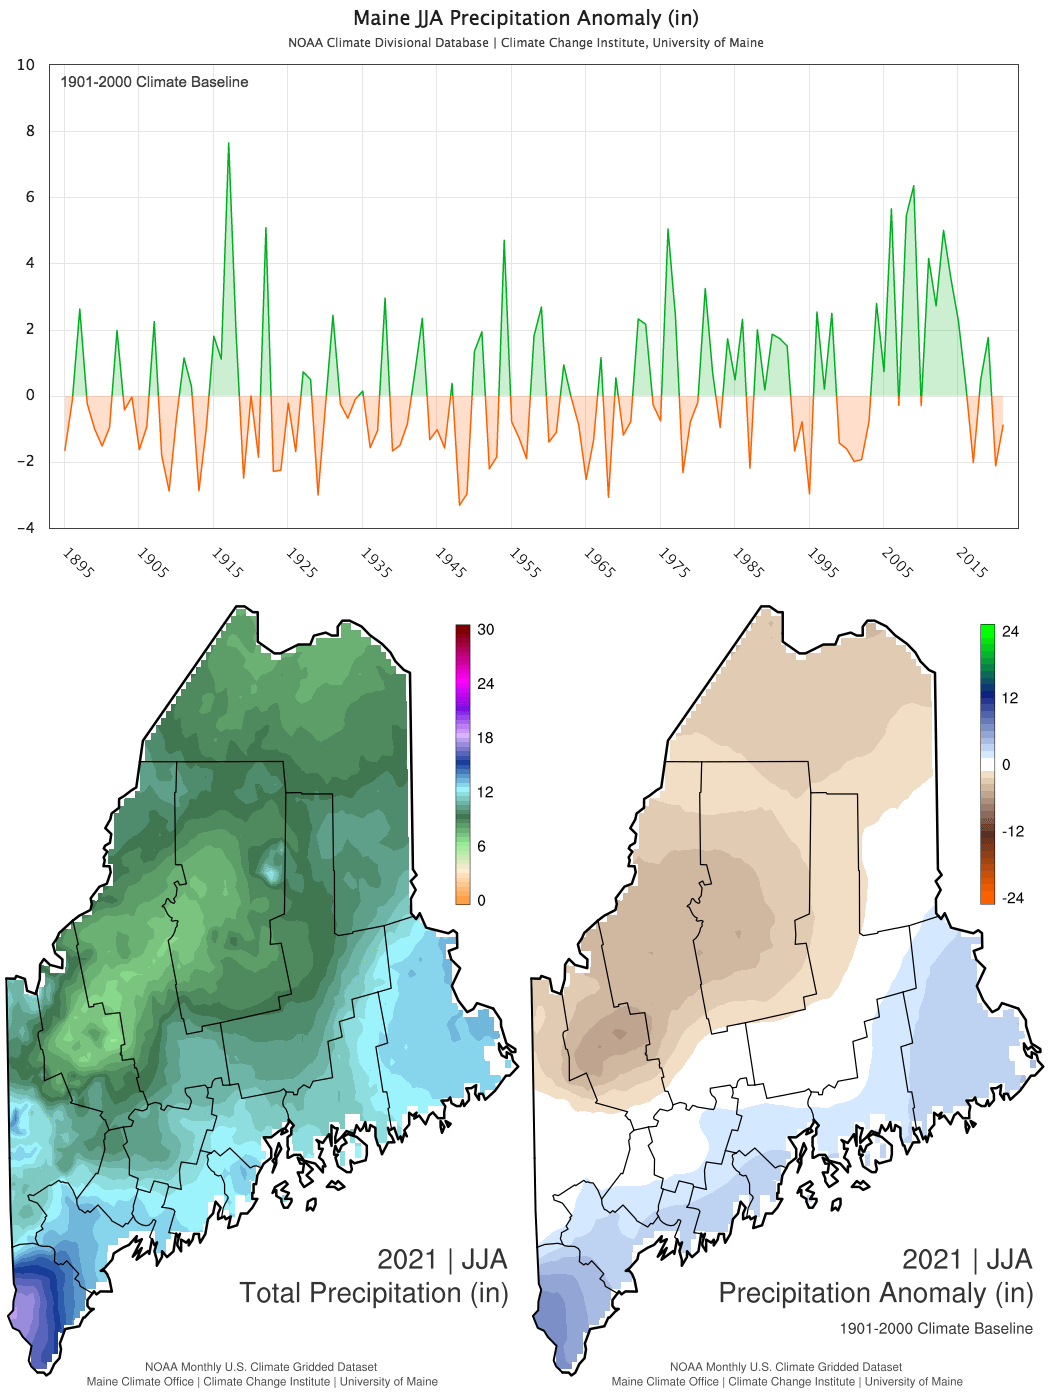
The Maine statewide climatological summer (June-August [JJA]) 2021 average temperature was 65.6°F or 4th warmest on record for the 127-year period beginning 1895 (Fig. 1). This temperature is 0.1°F cooler than for the same period in 2020, and 2.9 °F above the 1901-2000 historical mean. The observed JJA total precipitation was 10.2 inches or 49th driest for the record period (Fig. 2). This precipitation amount is 1.3 inches more than for the same period in 2020, and 0.8 inches below the 1901-2000 historical mean.
| Temp / Anom (°F) | Rank | Precip / Anom (in) | Rank | |
|---|---|---|---|---|
| JJA | 65.6 / +2.9 | 4th warmest | 10.2 / -0.8 | 49th driest |
| Jun | 64.8 / +5.0 | 2nd Warmest | 2.2 / -1.5 | 13th driest |
| Jul | 63.6 / -1.7 | 22nd coolest | 5.4 / 1.6 | 12th wettest |
| Aug | 68.3 / +5.3 | 2nd warmest | 2.6 / -0.9 | 34th driest |
| Jun | Jul | Aug | JJA | |
|---|---|---|---|---|
| Highest Maximum Temperature | 40 | 2 | 36 | 78 |
| Lowest Maximum Temperature | 0 | 28 | 1 | 29 |
| Highest Minimum Temperature | 91 | 7 | 71 | 169 |
| Lowest Minimum Temperature | 7 | 3 | 0 | 10 |
| Highest Precipitation | 2 | 21 | 5 | 28 |
Drought Signal Carries into 2021, but Conditions Less Severe
The period May through September 2020 saw unusually low rainfall that led to the development of extreme hydrologic drought across much of New England. Conditions were particularly extreme in September when some rivers saw record low levels for that time of year, and the U.S. Department of Agriculture declared Aroostook County a drought disaster area. Abundant precipitation statewide in October and December increased streamflows to near or above normal and brought needed recharge to groundwater resources.
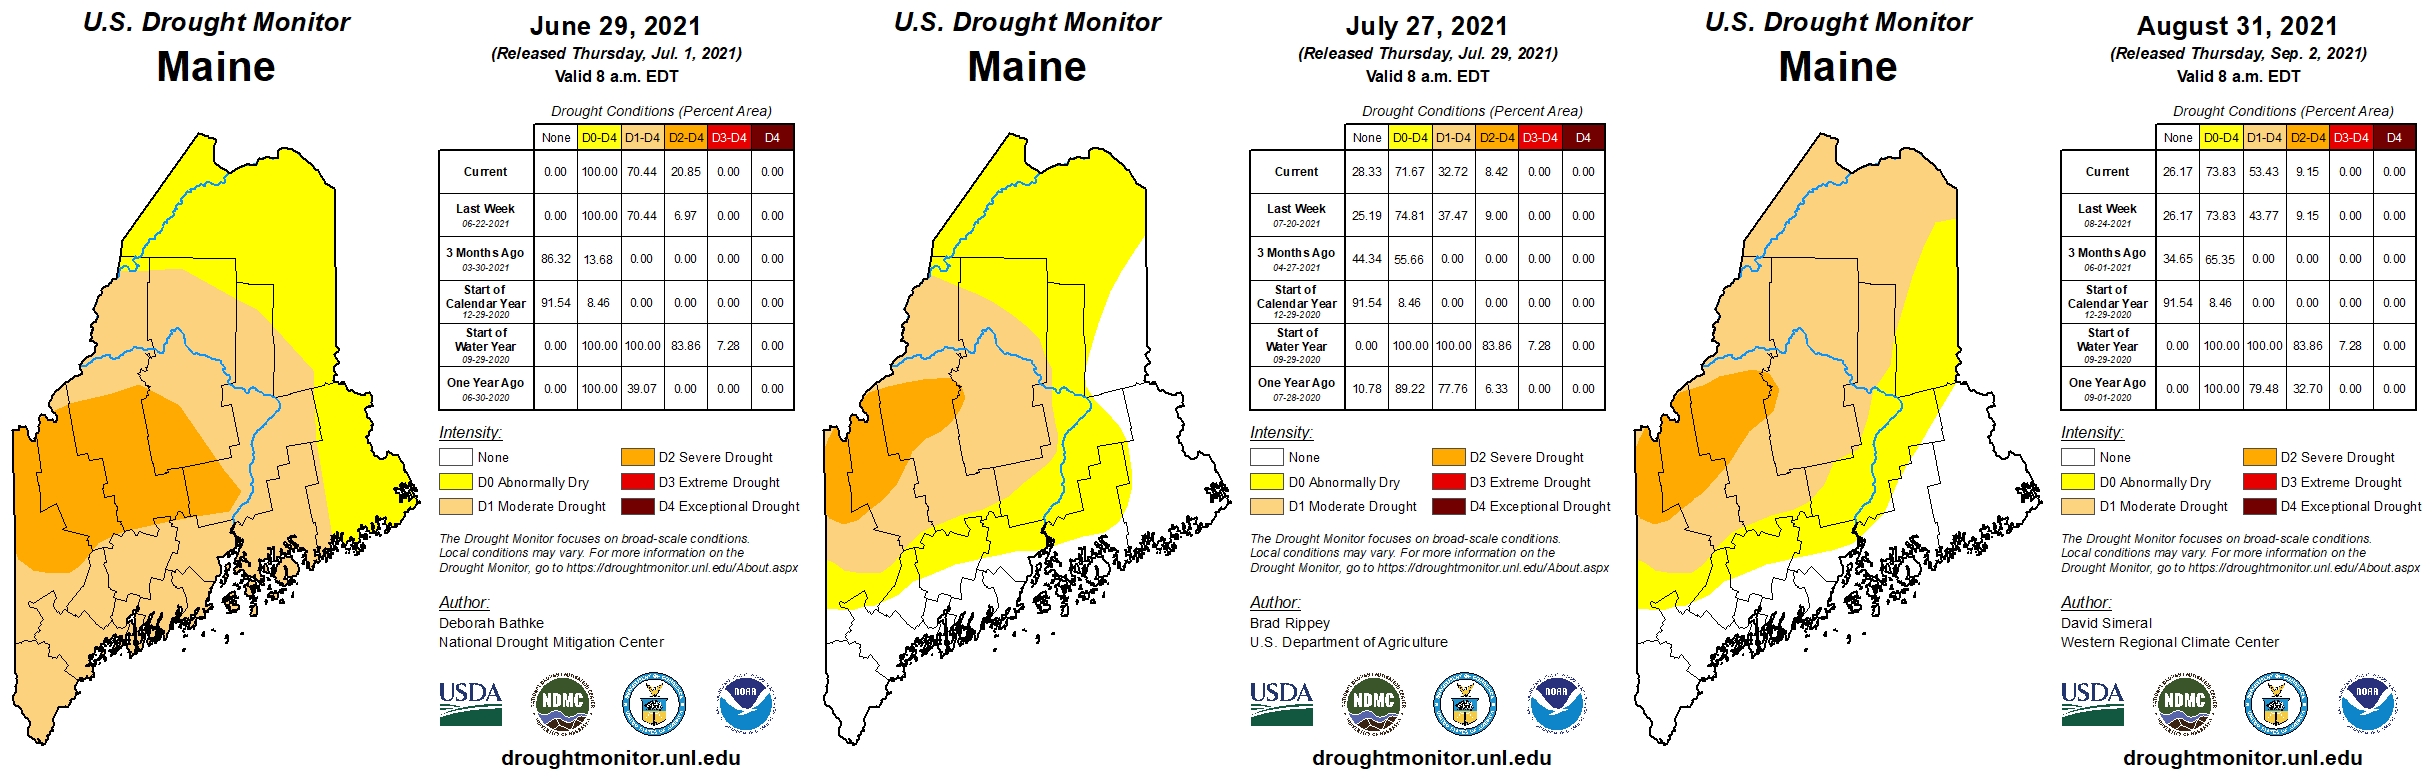
Optimism that the drought might be over faded as a very warm 2020/21 winter season led to a warm spring with below normal precipitation and early snowmelt. The Maine Drought Task Force was activated in April as abnormally dry conditions affected more than half of the state. Conditions worsened statewide through June, especially where severe drought developed across a large area extending eastward from Oxford to southern Penobscot County as shown in the U.S. Drought Monitor maps in Figure 3. In July, beneficial rains brought significant improvements to coastal, central, and eastern parts of the state in July. August brought enough rainfall to maintain the status quo across the southern two-thirds of the state. For a second summer in a row, record or near-record low streamflows were measured on the Piscataquis and St. John rivers, and at the end of August some areas needed over a foot of rain to end the drought.
Looking Farther Afield
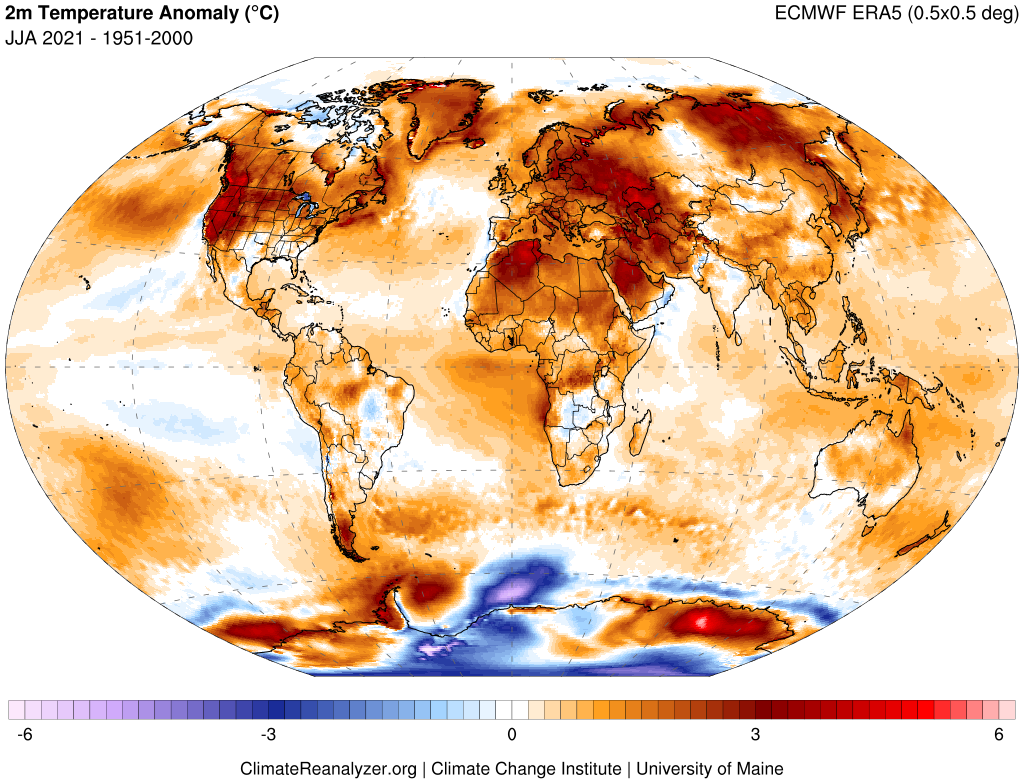
The JJA 2021 global average near-surface temperature ranks 4th warmest on record since 1880 (Fig. 5). The global distribution of temperature anomalies for JJA 2021 is shown in Figure 6. The end-of-summer minimum sea ice extent in the Arctic occurred around September 16th, with a rank of 11th lowest since continuous satellite observations began in late 1978. The September minimum extents in 2012 and 2020 were 1st and 2nd lowest, respectively.
Mid-November Update
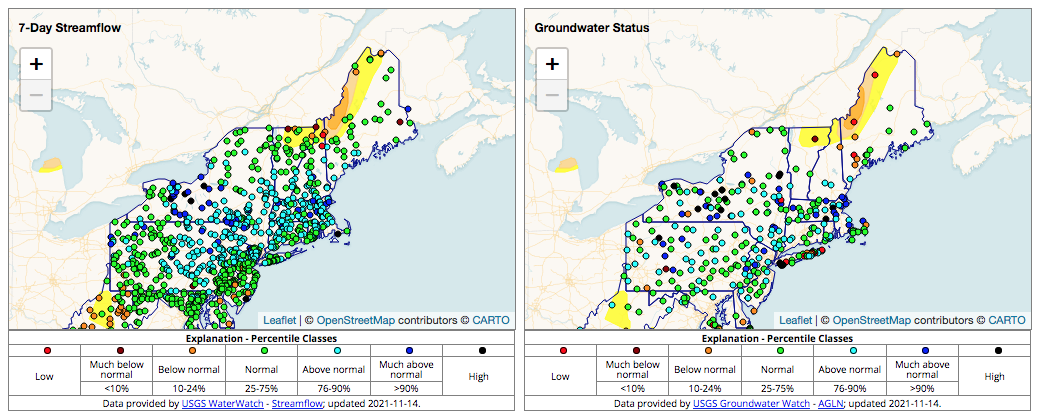
The U.S. Drought Monitor estimates that abnormal dryness or drought is currently found only in the western mountains and northwest Aroostook and Piscataquis counties, an area spanning about 28% of Maine. Most USGS monitoring sites show 7-day streamflows at or near normal for this time of year (Fig. 8). However, groundwater observations are more mixed: several sites from the southwest to north indicating below normal, whereas most sites across coastal and inland up the Penobscot River valley show normal conditions.
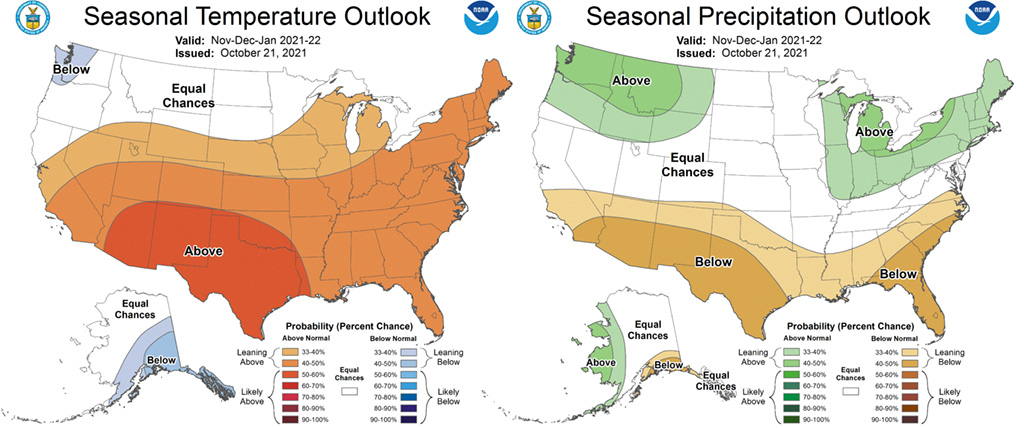
The latest NOAA Climate Prediction Center seasonal outlook maps for early winter (November–January) show moderate probability for above normal temperature and above normal precipitation (Fig. 9). La Niña conditions have developed across the tropical Pacific and will influence winter global weather pattern for a second season in a row. It is unclear how this will impact Maine and New England due to other factors, such as atmospheric teleconnections to the North Atlantic.
Maine historical climate data and current weather forecasts are available on the Maine Climate Office website. For U.S. and global climate and weather data, visit Climate Reanalyzer. The Maine Climate Office and Climate Reanalyzer are developed and maintained by Dr. Sean Birkel, the Maine State Climatologist and Assistant Extension Professor at the Climate Change Institute and Cooperative Extension at the University of Maine.