Winter 2014-2015
Climate Update: Maine’s 2014-2015 Winter Season
By Sean D. Birkel, Maine State Climatologist, April 2015
- Early November Blizzard
- December Warm Wave
- January, Cold and Snowy
- February Snowstorms and Record Cold
- March Continued Cold and Snow
- Meanwhile, in the Rest of the U.S. …
- Related Resources
The 2014-2015 winter season will be remembered as one of the harshest in Maine in recent decades. Defining elements of the season include a damaging blizzard in the first week of November, record-breaking cold in the month of February (indeed, February ranks the coldest month on record since 1895), and numerous storms with record and near-record snowfall totals. Although overshadowed by events of November and February, December was exceptionally mild, ranking sixth warmest on average statewide.
Early November Blizzard
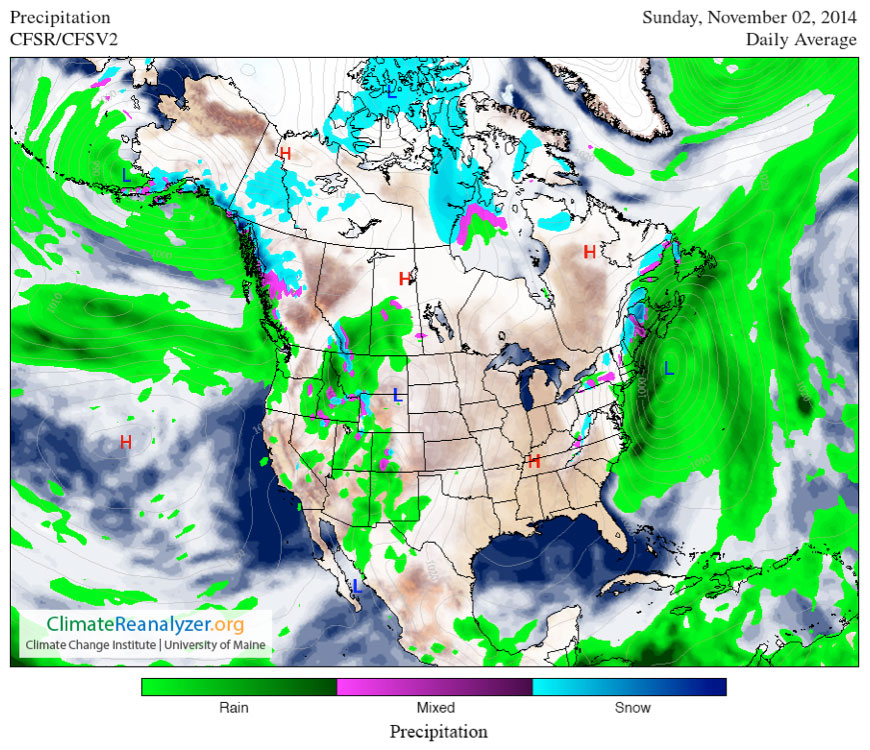
Winter weather began in the first week of November when a strong storm system tracked up the East Coast, and behind it drew in a cold air mass from Canada (Figure 1). This early season storm brought cold temperatures and a mix of sleet, freezing rain and snow to the Northeast region. The storm hit Maine hard, rendering more than 130,000 homes without electricity for a day or longer after wind and heavy, wet snow accumulation (12 inches in Bangor) downed trees and damaged infrastructure (Figure 2) (Related Resources, 1. November Blizzard). Trees may have been particularly vulnerable to effects of this strong winter storm because root systems had yet to freeze into the ground.
December Warm Wave
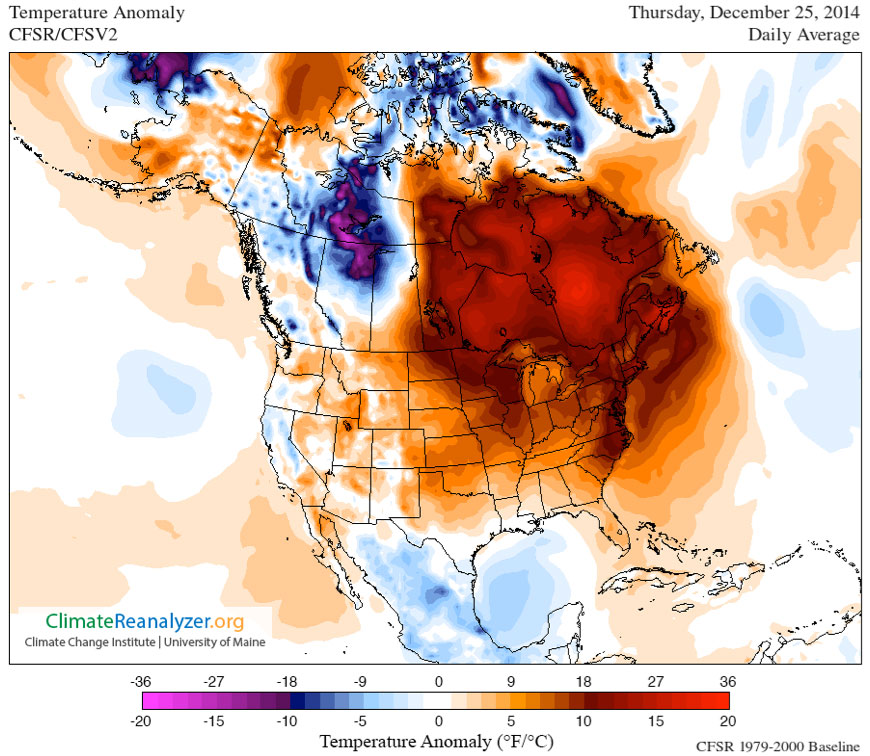
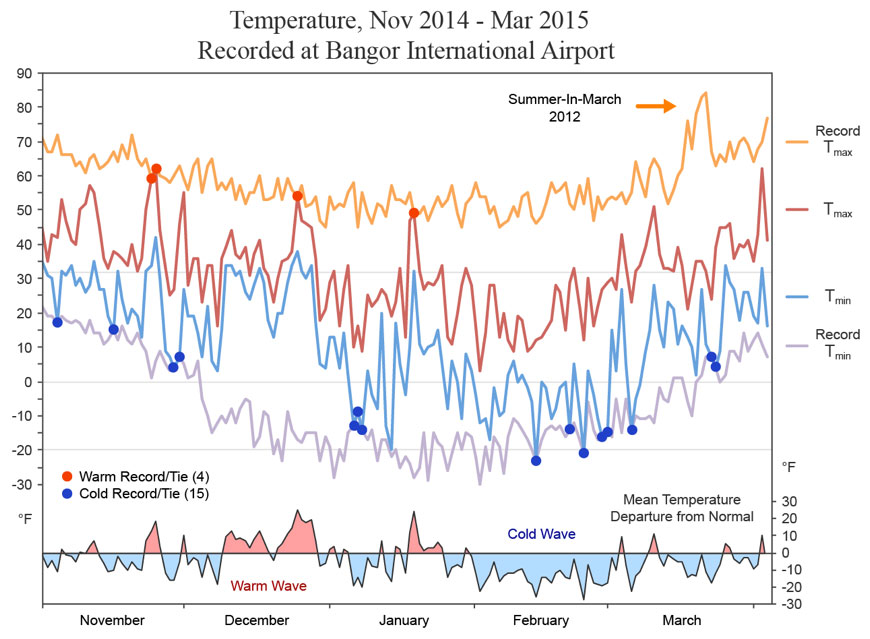
By the second week of December, warm circulation developed that would persist for the rest of the month. Warmth peaked on December 25, Christmas Day when temperatures rose into the 50s °F across much of the state (Figure 3). A record high of 54 °F was observed in Bangor; and a record high of 48 °F in Caribou (Figure 4). These warm temperatures caused widespread snowmelt and ice loss on some lakes and rivers that had started to freeze at the beginning of the month. The ice broke on the St. John and Allagash rivers, rare occurrences for late December (Related Resources, 2. December Warm Wave). Very little snow fell in December (Figure 5).
January, Cold and Snowy
Cold and snow typical of a Maine winter soon arrived, however, with an impressive uptick of snow accumulation leading into February (Figure 6). A blizzard on January 27 dropped more than a foot of snow across much of the state. Repeated southward-tracking storms both began and ended with below freezing temperatures, providing ideal powder-like snow conditions for outdoor recreation, the best in years.
February Snowstorms and Record Cold
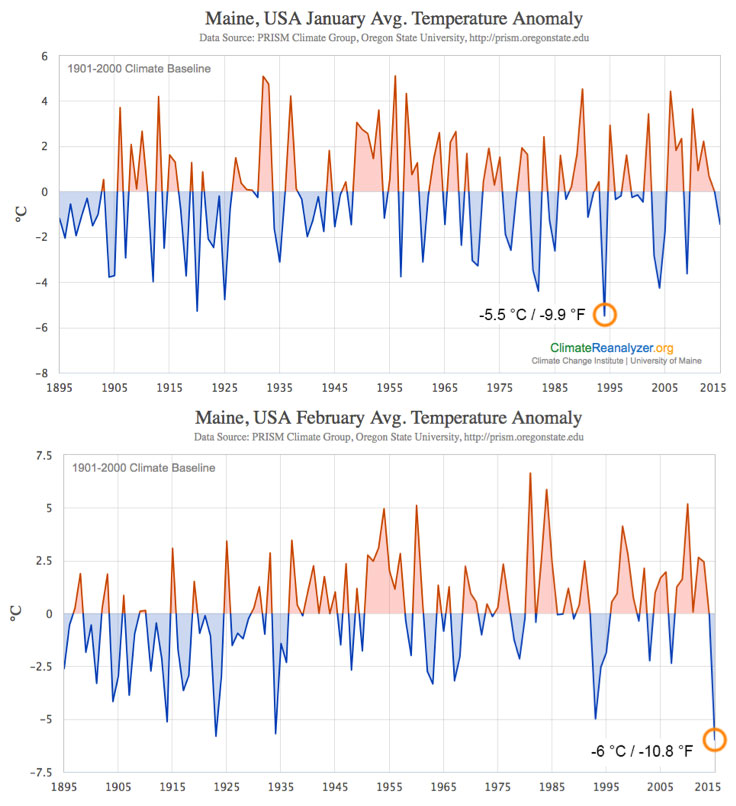
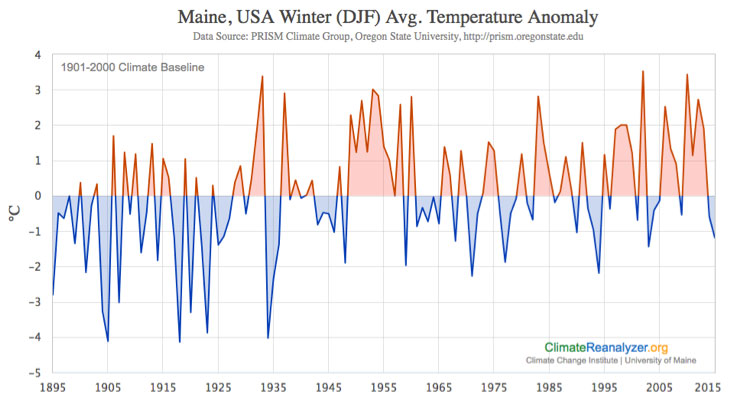
February saw several significant snowfall events, including on February 2, a blizzard that dropped another foot of snow (Figure 7). But the real story was the record-breaking cold. Not only did February register as the coldest on record statewide since 1895, but it also registered as the coldest month on record, besting even the cold January of 1994 (Figure 8). Nevertheless, the December-February average winter temperature falls well short of records set during the early part of the 20th century (Figure 9).
March Continued Cold and Snow
Climatological winter spans December-February, but Maine often experiences winter conditions from November-March. March 2015 indeed felt like winter, registering below normal temperature for most of the month, and four record low daily temperatures in Bangor (Figure 4). March also saw additional snowfall, including one significant storm on the 15 (Figure 10). In Bangor, 132 inches, or 11 ft., of snow fell between November 1 and March 31. Despite a snowfall deficit and unusual warmth in December, the 2014-2015 winter season ranks one of the snowiest on record (Related Resources, 5. Record Cold and Snowfall).
Meanwhile, in the Rest of the U.S. …
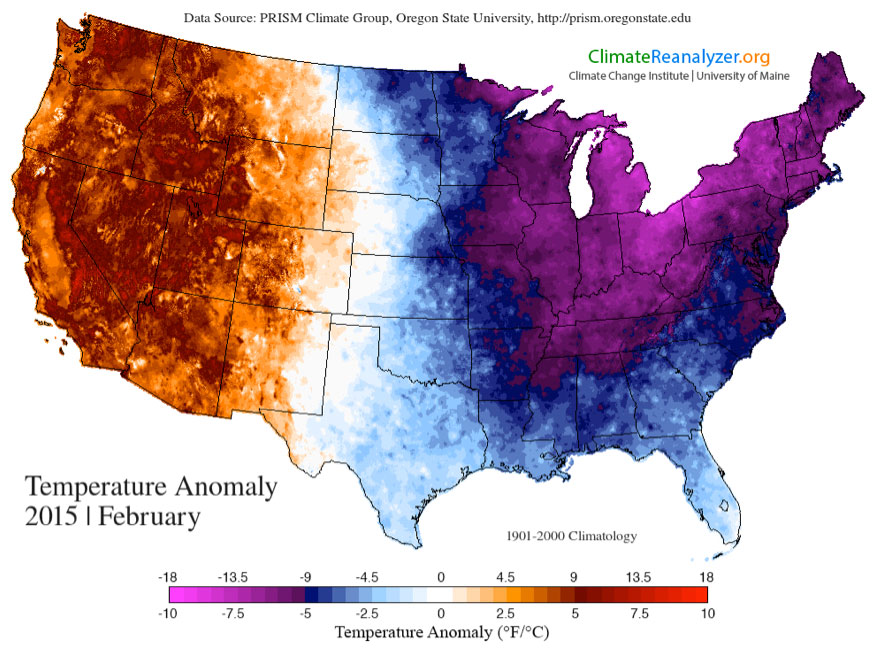
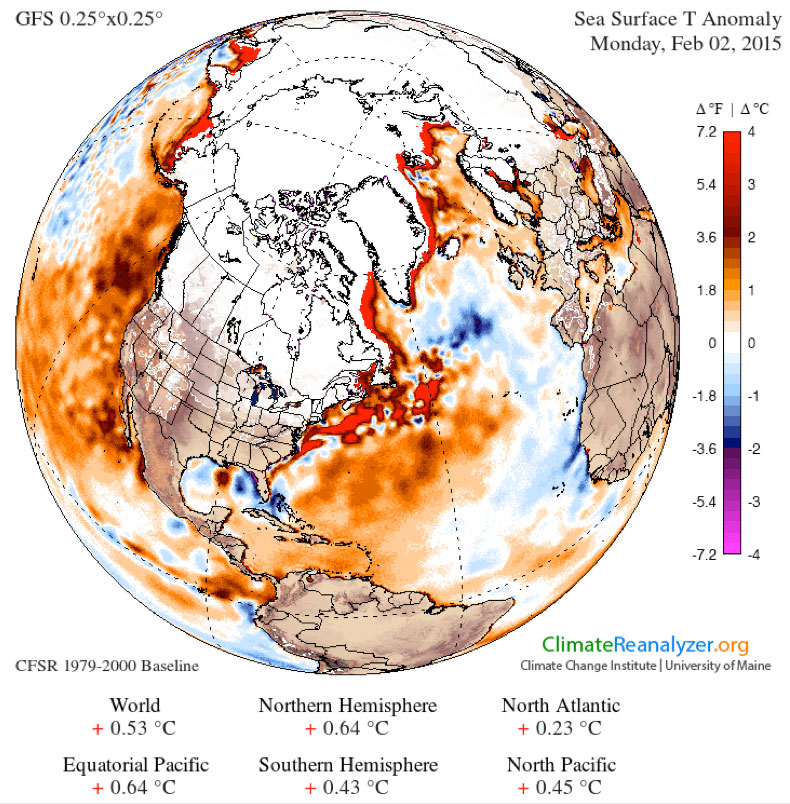
Although Maine experienced a harsh and snowy winter, conditions elsewhere in the nation were far different, particularly across the West where most regions saw record warmth for much of the winter. Record Californian drought continued unabated. The annual March snow survey in the Sierra Nevada measured an astonishing 9% normal snowpack (Related Resource, 6. California Severe Snow Deficit). Winter extremes across the continent developed from a persistent warm-air ridge over the west (linked to above normal sea-surface temperatures across the eastern Pacific), and a likewise persistent cold-air trough downstream to the east (Figures 11, 12). The abundant snowfall in Maine and across the Northeast this winter was fueled by moisture evaporated over the North Pacific and North Atlantic where surface waters were warmer than normal (Figure 13). The development of blizzards and other storms of intense snowfall likely resulted from very cold circulation from the Arctic interacting with warm, moist air mass to the south, facilitation the formation of deep atmospheric low-pressure systems.

Related Resources
- November Blizzard: Strong, early storm cuts power to 137,000 homes (November 3, 2014, Portland Press Herald)
- December Warm Wave: So long, December thaw: Seasonal low temperatures returning to Maine (December 29, 2014, Bangor Daily News)
- Summer-In-March 2012: (March 23, 2012, WunderBlog Archive)
- January 27 Blizzard: Live coverage of Maine’s Jan. 27 snowstorm (January 27, 2018, Portland Press Herald)
- Record Cold and Snowfall: Weekend snow secures winter records for Maine, New England (February 22, 2015, Bangor Daily News)
- California Severe Snow Deficit: California Statewide Snowpack Now Below Record Low Benchmark (March 24, 2015, The Weather Channel)