Winter 2020
Maine Winter 2020 Climate Summary
By Dr. Sean Birkel, Maine State Climatologist
Statewide Overview
The Maine statewide winter (December-February [DJF]) 2020 average temperature was 21.2 °F, ranking 6th warmest for the 125-year record period beginning 1895 (Fig. 1). This temperature is 4.3 °F warmer than that observed for the same period in 2019, and 5.6 °F above the 1901–2000 historical mean. The observed DJF total precipitation was 9.7 inches, ranking 53rd wettest since 1895 (Fig. 2). This precipitation amount is 2.2 inches less than that observed in 2019, and 0.1 inches above the 1901-2000 historical mean, or near normal. In total for DJF 2020, there were 29 high and 11 low daily temperature, 35 high precipitation, and 22 high snowfall records either broken or tied statewide (data from NOAA Daily Weather Records).
-
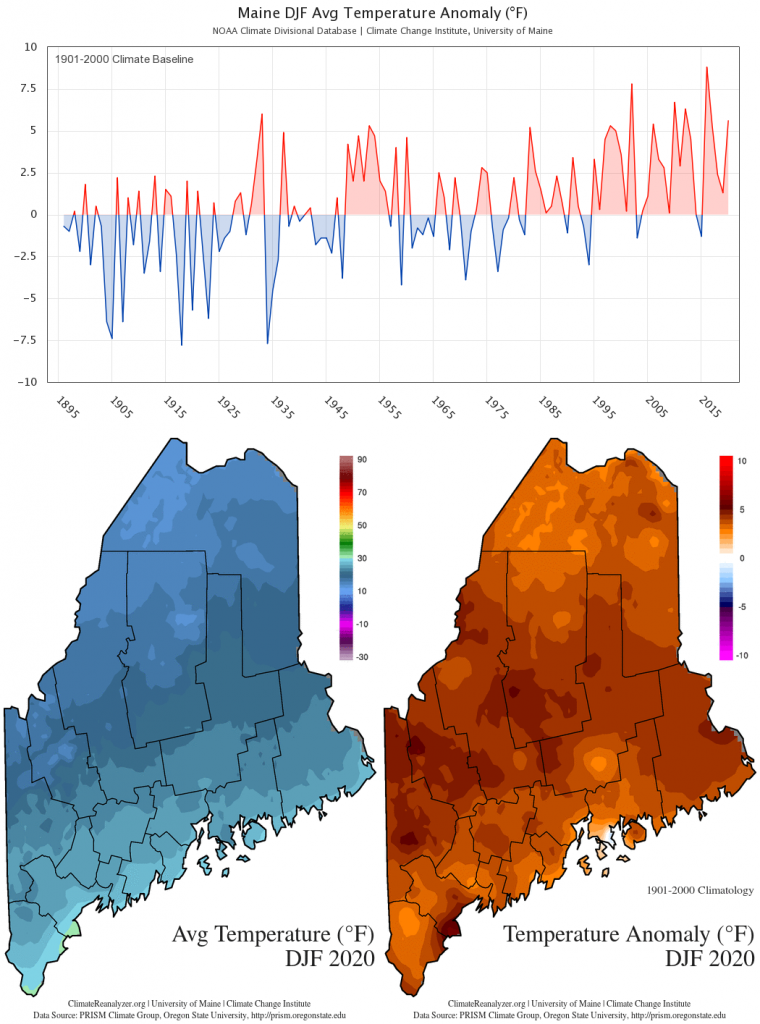
- Figure 1. Statewide DJF average temperature anomaly (1901-2000 baseline) timeseries and maps. Timeseries data from the NOAA U.S. Climate Divisional Database. Spatial data from the PRISM Climate Group. These charts are also available on the Maine Climate Office website.

-
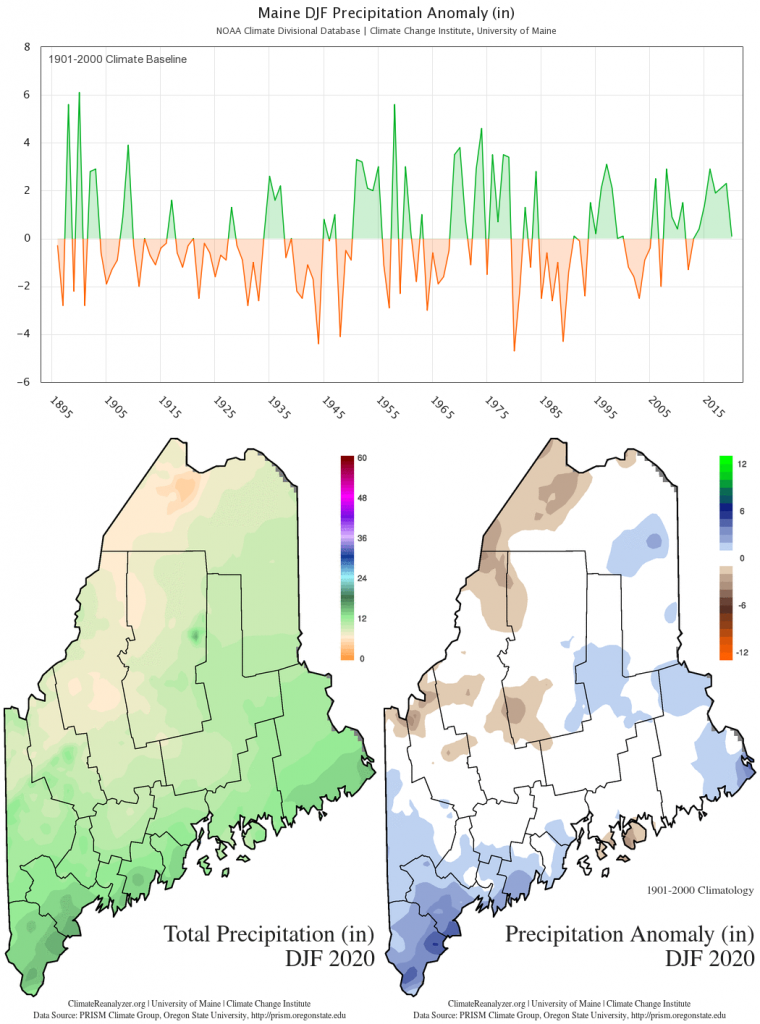
- Figure 2. Statewide DJF total precipitation anomaly (1901-2000 baseline) timeseries and maps. Timeseries data from the NOAA U.S. Climate Divisional Database. Spatial data from the PRISM Climate Group. These charts are also available on the Maine Climate Office website.

On the three-month average, winter 2020 was much warmer than the 20th century baseline, but with near-normal precipitation. December, January, and February were likewise warmer than normal with near-normal precipitation (Table 1).
| Temp / Anom (°F) | Rank | Precip / Anom (in) | Rank | |
|---|---|---|---|---|
| DJF | 21.2 / +5.6 | 6th warmest | 9.7 / +0.1 | 53rd wettest (nn) |
| Dec | 22.8 / +4.1 | 29th warmest | 3.8 / +0.2 | 51st wettest (nn) |
| Jan | 20.8 / +7.6 | 9th warmest | 3.1 / -0.2 | 64th driest (nn) |
| Feb | 20.1 / +5.2 | 16th warmest | 2.8 / +0.1 | 62nd wettest (nn) |
Snow conditions for the winter 2020 season as a whole were generally very good across the northern climate division with continuous cover and deep snowpack. In contrast, the central and coastal climate divisions saw far less favorable conditions owing to episodes of rain, and frequent days with high temperatures well above freezing that promoted snowmelt.
Looking Farther Afield
Global Temperature: The DJF 2020 global average near-surface temperature ranks second warmest on record since widespread observations became available in 1880 (Fig. 3).

Such a high DJF 2020 global temperature is unexpected in the absence of a strong El Niño, and in this case was driven by an exceptionally strong positive phase of the Arctic Oscillation (AO) that contained cold air within the high northern latitudes. Thus, the global temperature anomaly map shows warmer-than-normal conditions developed across most of the globe (Fig. 4). Record winter warmth was found across broad swaths of Europe and northern Asia, and in particular across Russia.

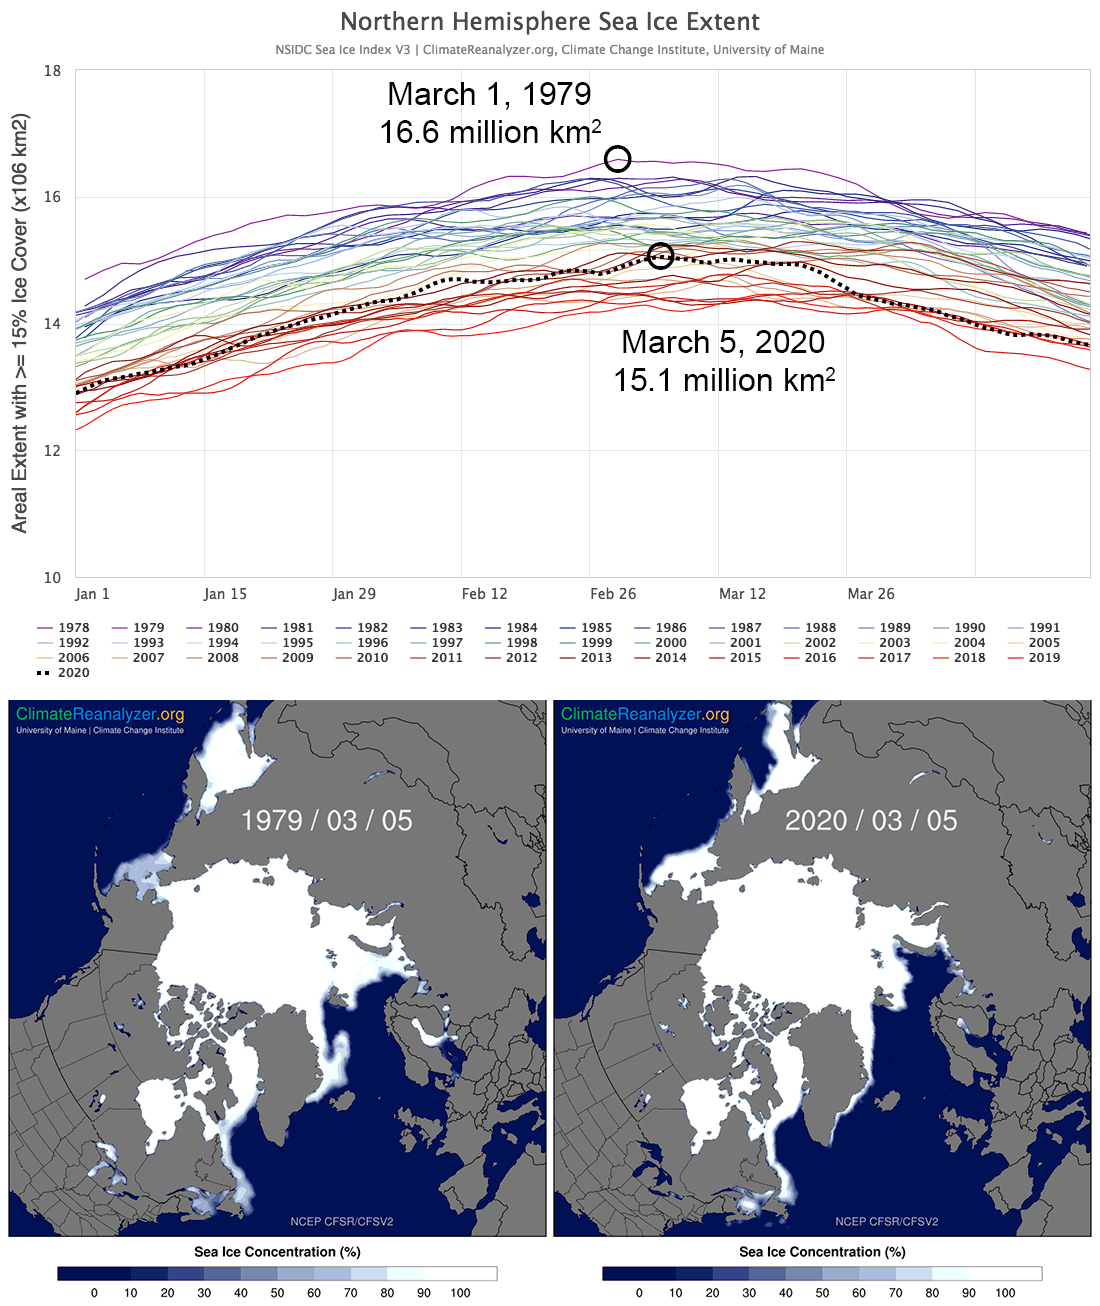
Northern Hemisphere Sea Ice: Despite very low sea ice extent in the northeastern Atlantic sector, the winter maximum ice extent across the Northern Hemisphere (typically reached in early to mid-March) was greater than in recent years, ranking 11th lowest in the 1979-present satellite observation era (Fig. 5).
Tools for accessing Maine historical climate data and current weather forecasts are available on the Maine Climate Office website. For U.S. and global visualizations, visit Climate Reanalyzer. The Maine Climate Office and Climate Reanalyzer are developed and maintained by Dr. Sean Birkel with supported from the Climate Change Institute at the University of Maine.