Year In Review: 2016
Weather and Climate Year In Review: 2016
By Sean D. Birkel, Maine State Climatologist, January 4, 2017
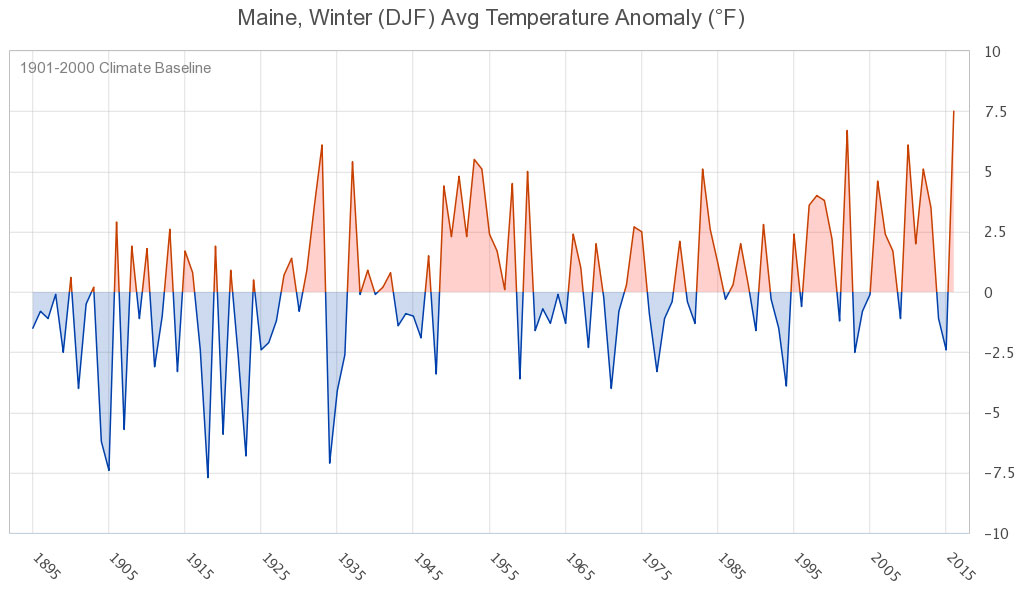
Two stand-out weather events impacted Maine in 2016: a record warm December-February winter season and drought for much of the year across the southern half of the state. I wrote about the unusually warm winter in a previous MCN article Weather and Climate Review: December 2015-March 2016. As shown in the graph below, the 2015-2016 winter registered 7.5°F above normal, besting the previous record of +6.7°F in 2001.
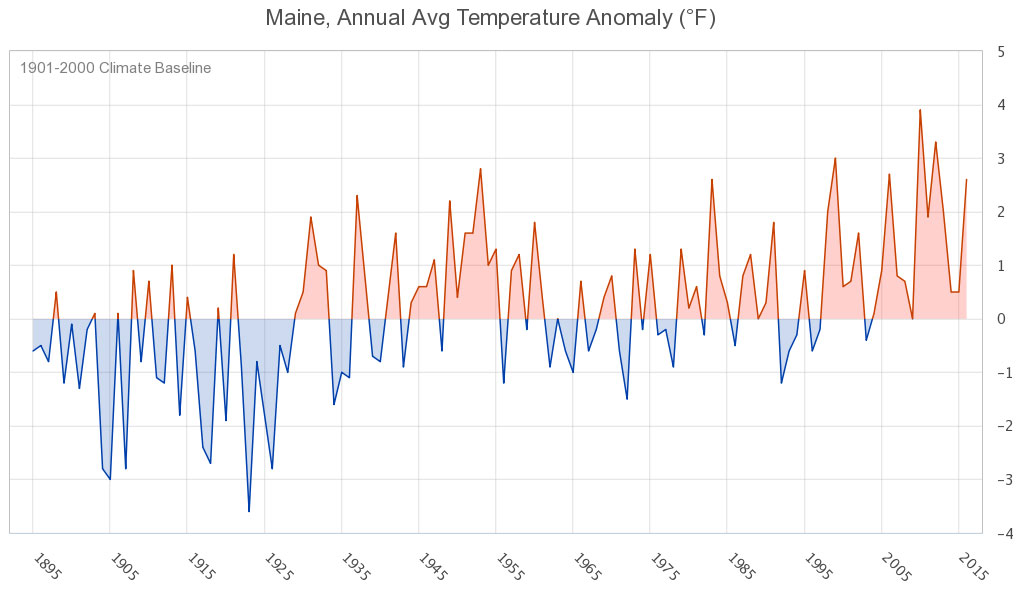
On the other hand, the 2016 annual average temperature was +2.6°F, the 7th warmest on record.
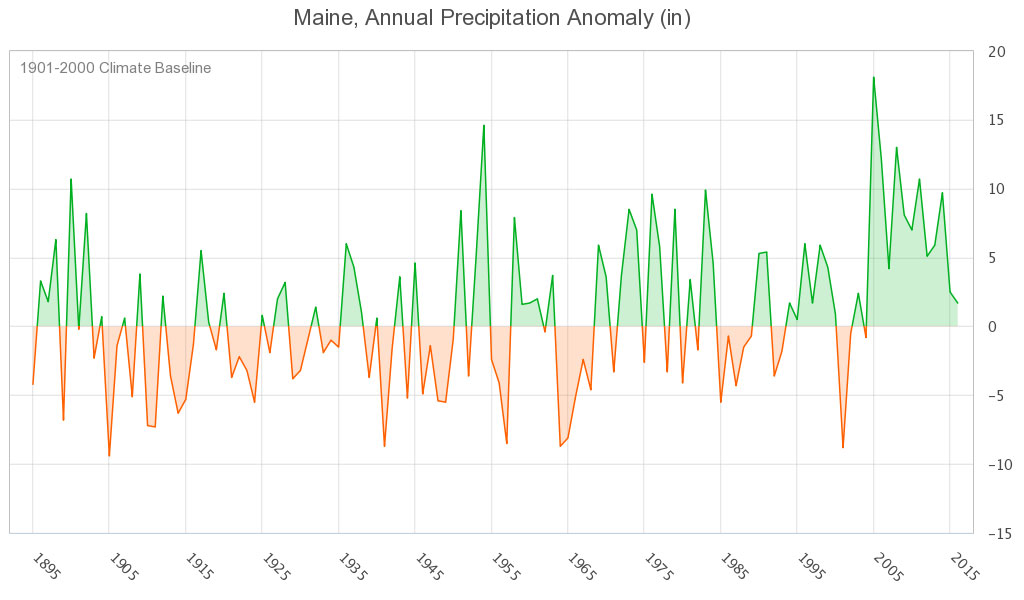
The record warm winter was followed by drought conditions developing across much of the state over several months. Perhaps surprisingly, the statewide average total annual precipitation for 2016 ranks slightly above the longtime historical average.
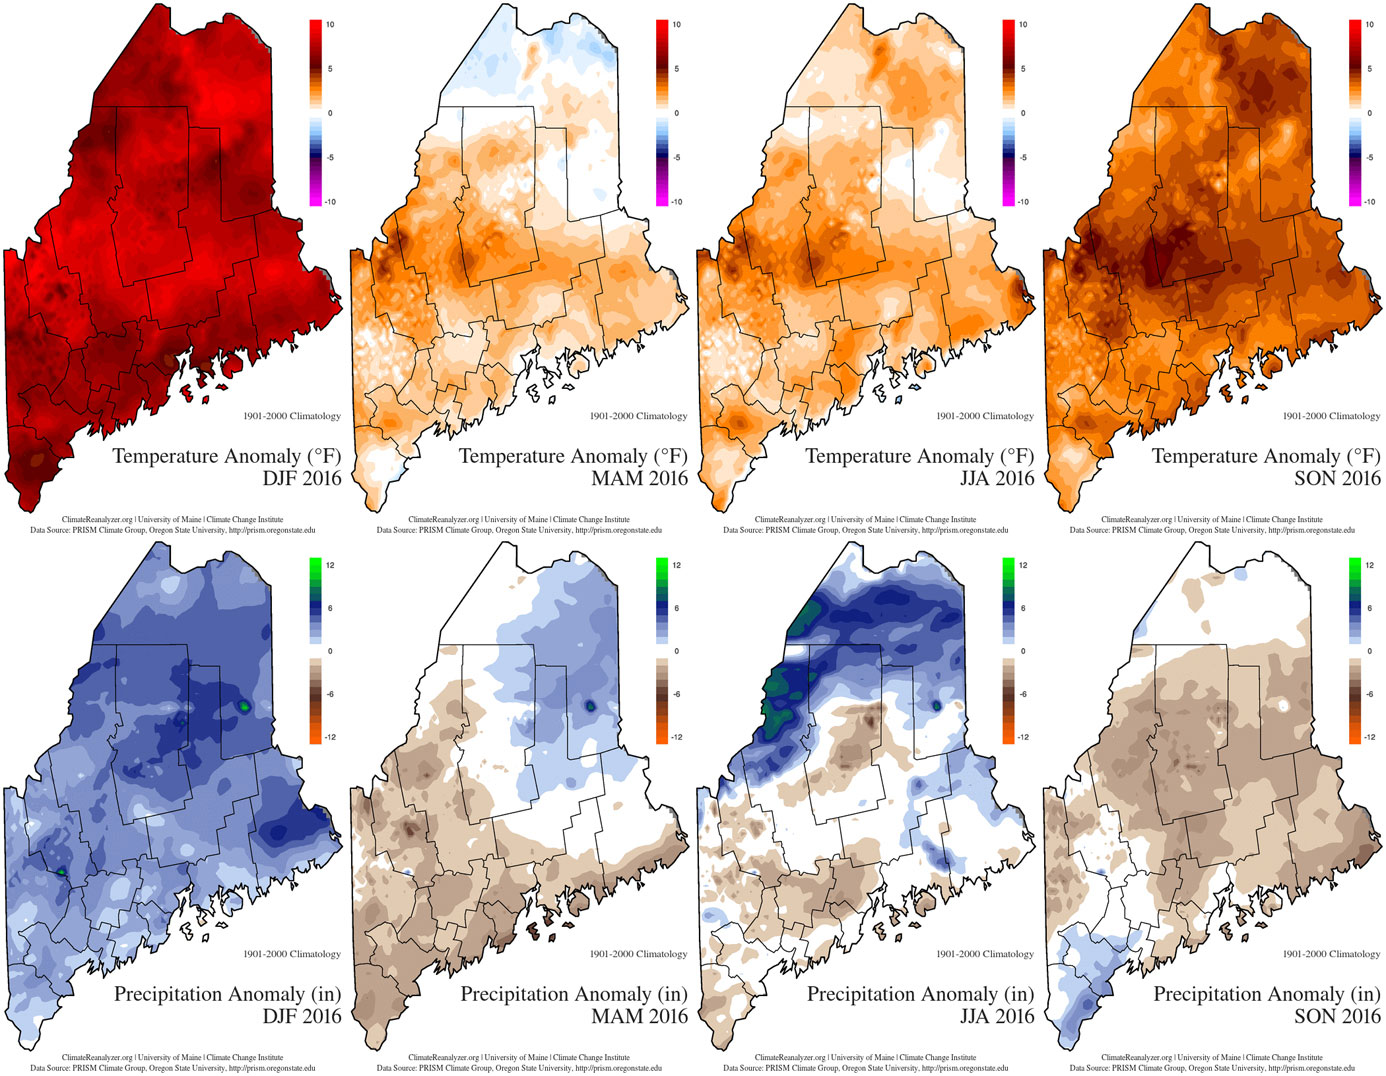
This underscores the significant regional and distribution of precipitation, where central and southern parts of the state were most heavily impacted by drought, while northernmost Maine received a rainfall surplus.
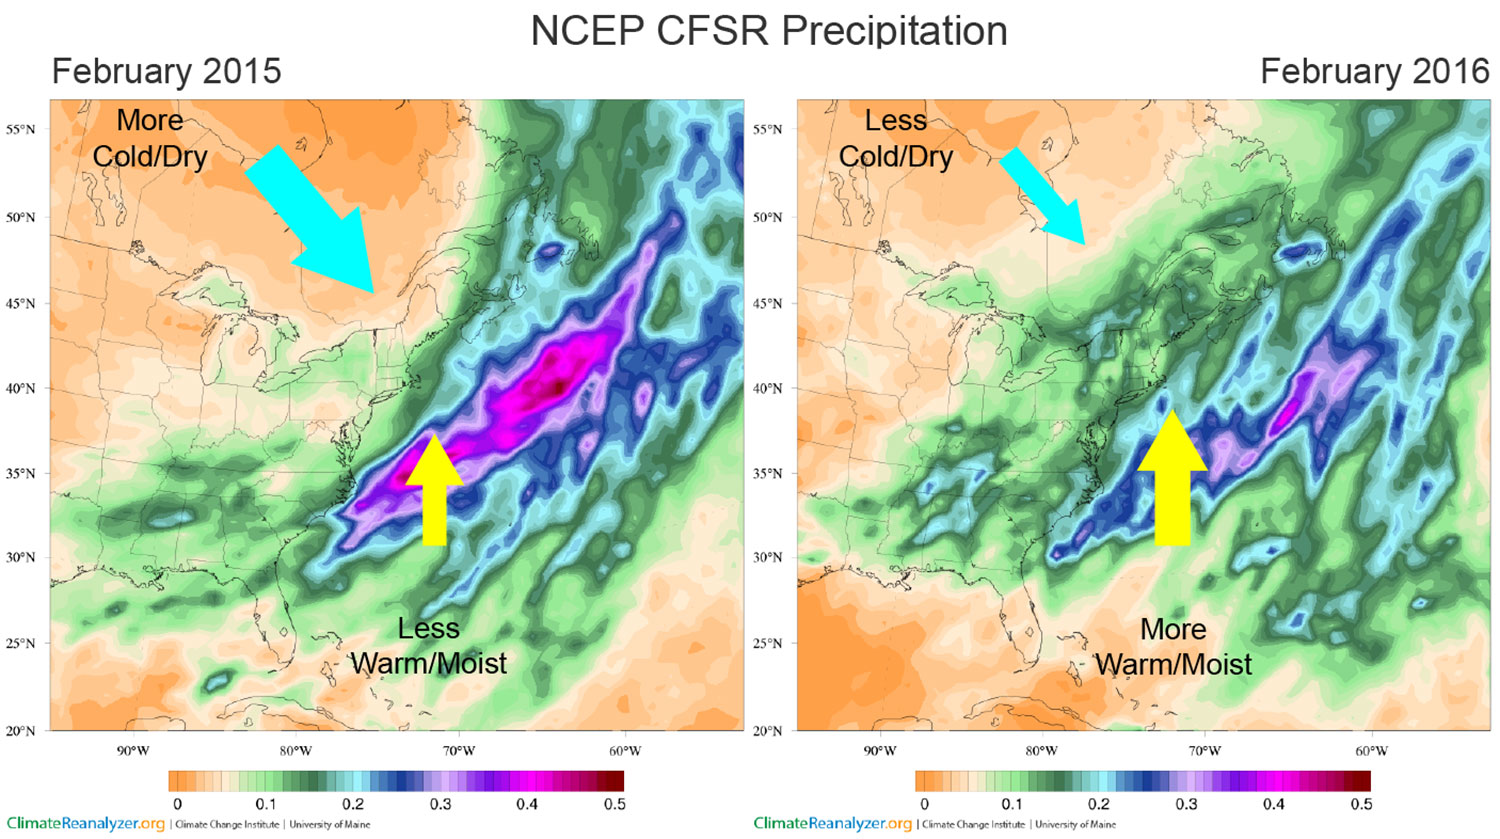
Moreover, we can see from the above maps of seasonal precipitation and temperature departures that the record warm winter was also very wet. Why? Because a warm winter brings more warm/moist southerly flow than usual, owing to atmospheric ridging and a poleward displacement of the storm track. Likewise, a cold winter brings more cold/dry northerly flow than usual from atmospheric troughing and displacement of storms south toward the equator.
The relationship between temperature and precipitation is a little different in the summer when the westerly jet stream is weaker and more poleward than during winter. Hot/humid summers in Maine see prevalent southerly flow and subtropical high pressure that tends to bring hazy, cloudless skies, and little rainfall. Frontal storms during warm summers will generally track over northern Maine and southern Quebec, as that is where the cold/warm air boundary lies. Such a pattern was typical for the warm months of 2016, and this is reflected in the maps above where northernmost parts of the state saw more moderate temperatures and normal or above normal rainfall.
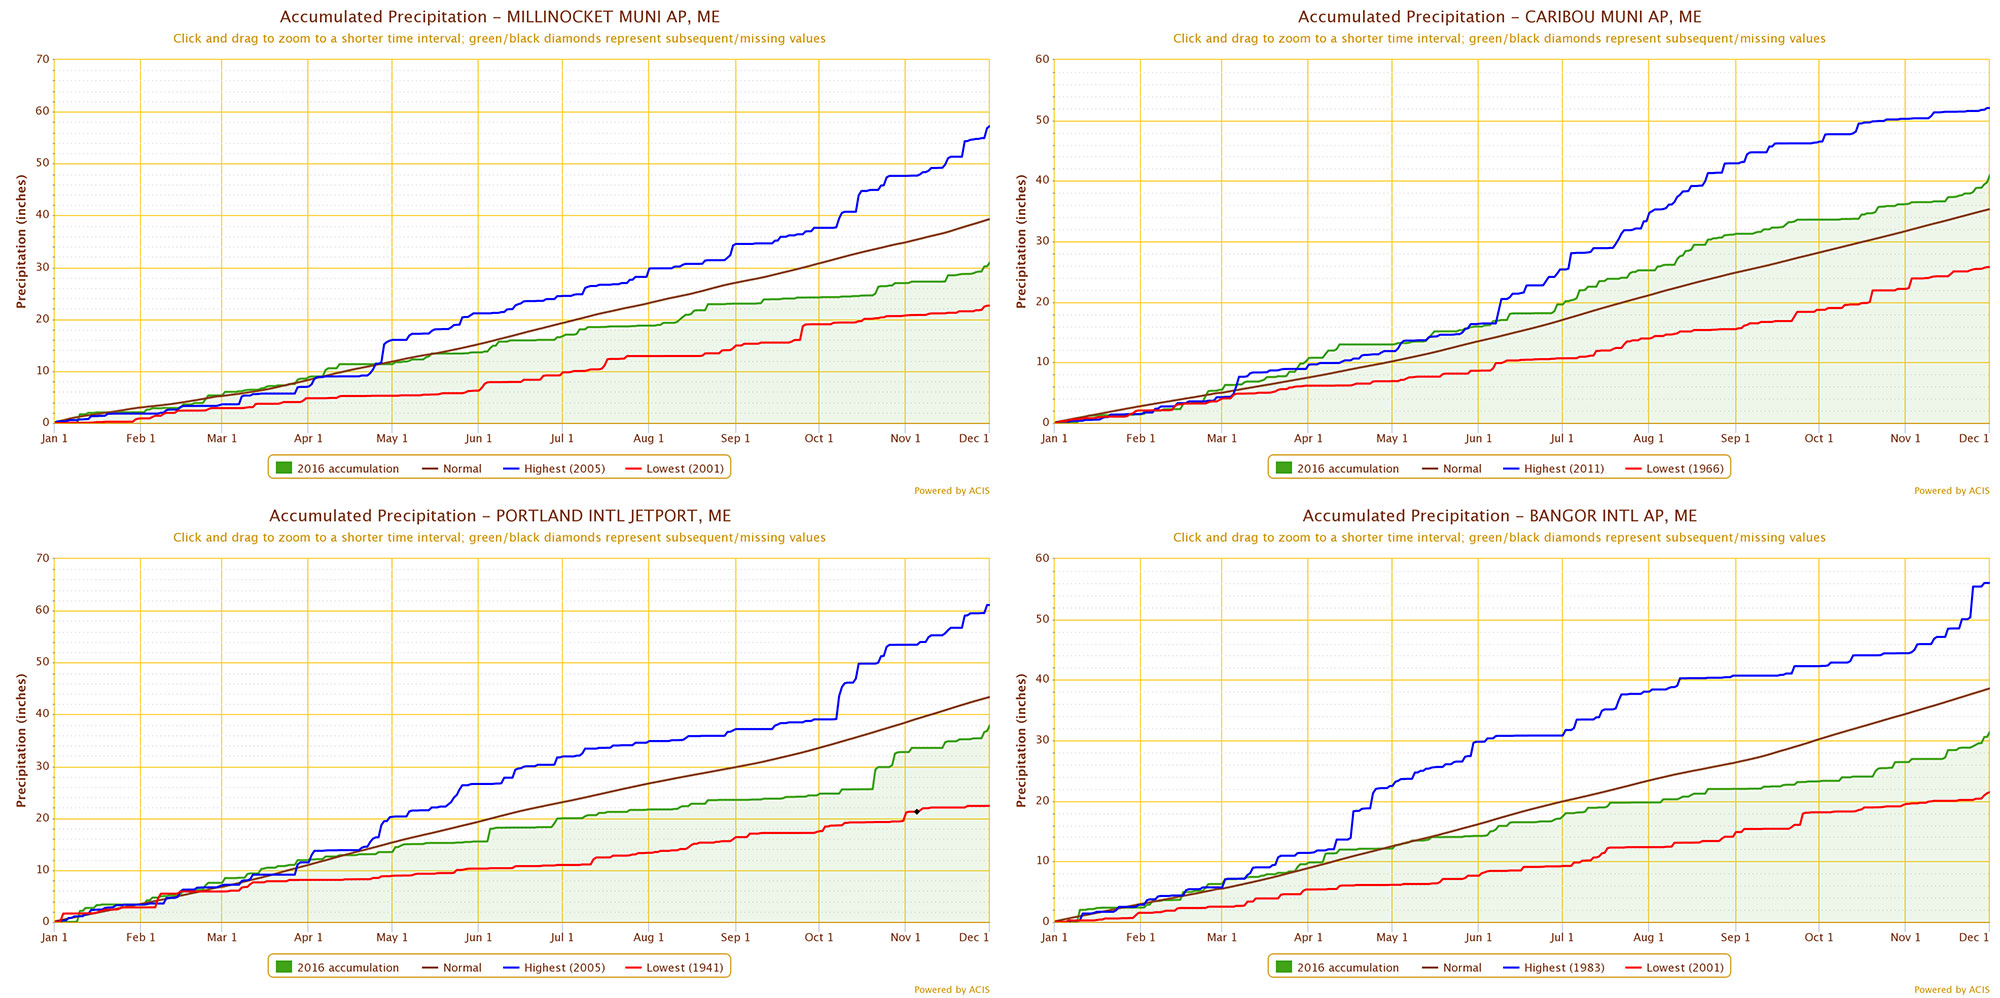
Below are precipitation accumulation graphs for Portland, Bangor, Millinocket, and Caribou. From these, we see that accumulation started to dip below normal mid to late April, and recovery did not begin until mid to late October.
For more information on the 2016 drought, view the NOAA’s Northeast Region Drought Impacts and Outlook, Weather Patterns & Drought Monitor (PDF). The latest NOAA outlook at the time of this writing indicates that there should be drought removal or improvement during January for affected areas.

A Global Perspective
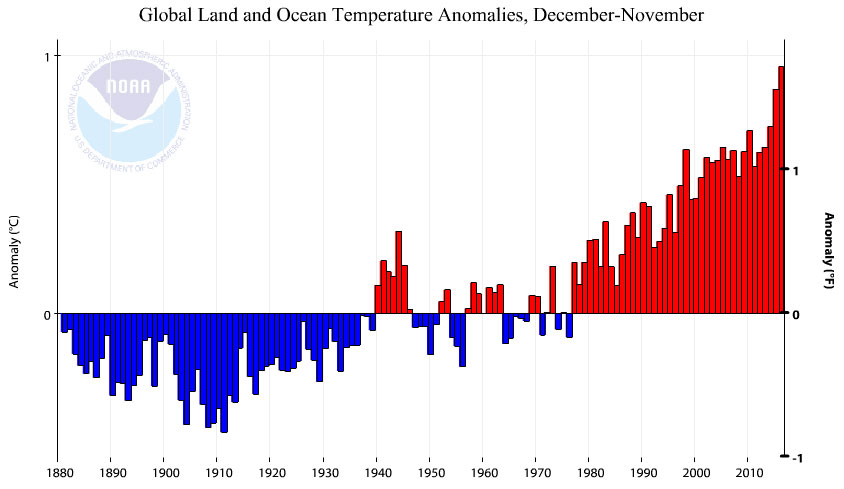
NOAA has not yet released an official summary of the 2016 January-December annual average global temperature, but from the December-November average, it seems certain that 2016 indeed sets a new record.
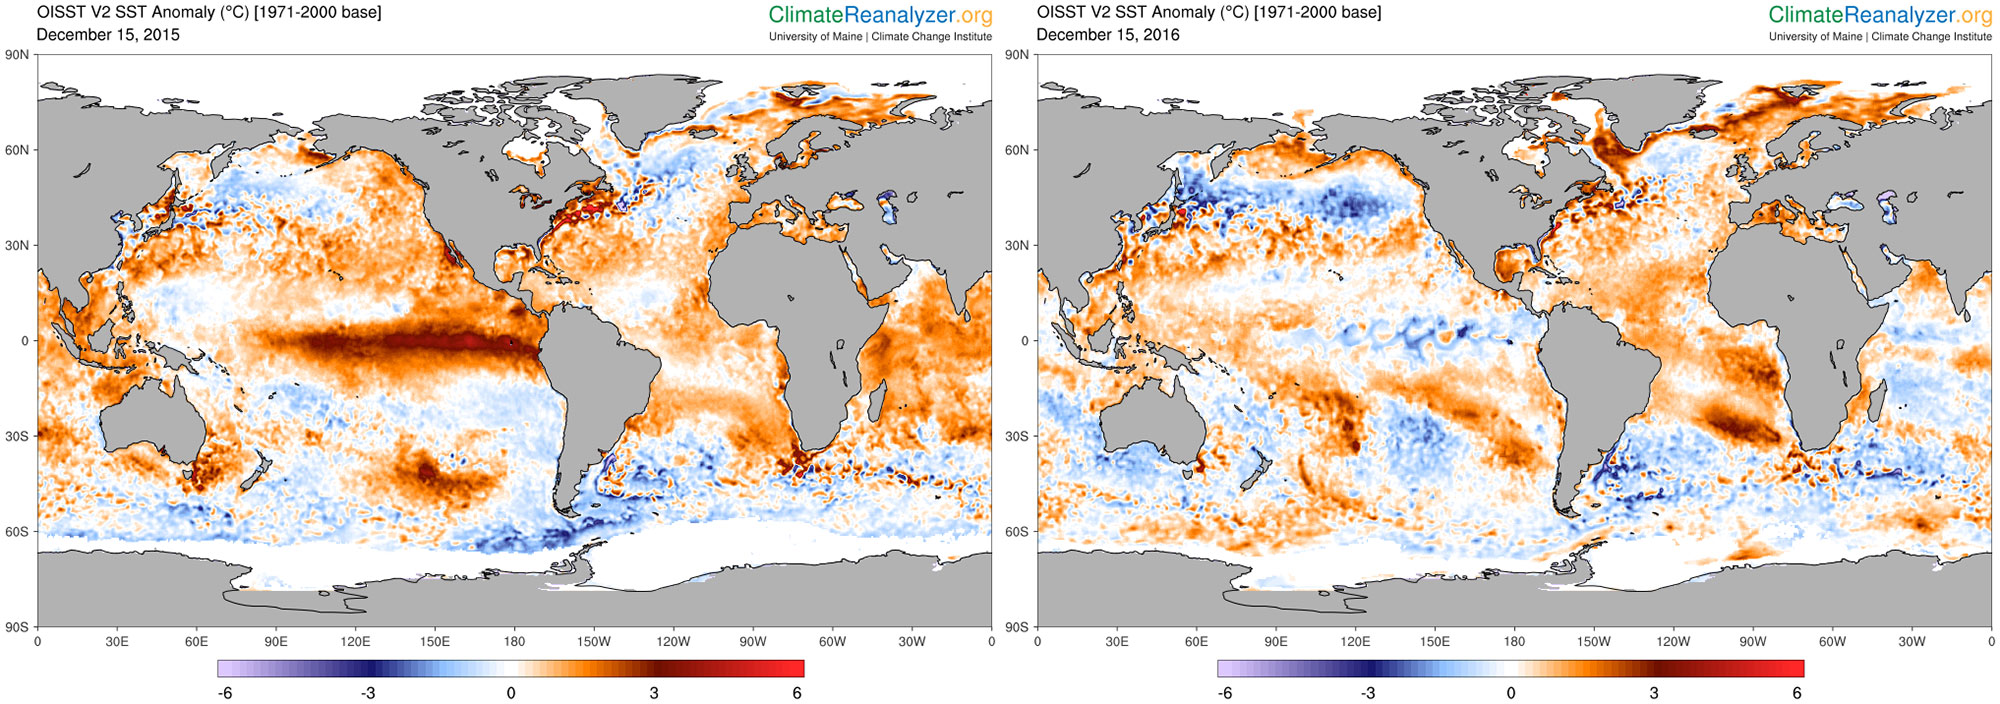
In addition to gradual warming from rising greenhouse gas concentrations in the atmosphere, the spike in global average temperature over the past two years resulted in part from the emergence in 2015 of the strongest El Niño to develop across the equatorial Pacific since 1998. A particularly unusual feature of the 2015 El Niño, which peaked in early 2016, was the coincident record warming of surface waters across the eastern North Pacific. The latter developed beneath persistent atmospheric ridging in the atmosphere.
Remember the record cold in Maine in February 2015? That was delivered to us from a deep trough of cold Canadian air that developed downstream of the ridge described above.
El Niño is the warm phase of the El Niño-Southern Oscillation (ENSO), a quasi-periodic phenomenon in which wind patterns and sea-surface temperatures vary across the tropical latitudes of the Pacific Ocean. La Niña is the cool phase. ENSO modes can have a significant impact on seasonal weather patterns around the globe due to inherent changes in large-scale moisture and atmospheric pressure patterns. La Niña typically follows El Niño, and indeed a moderate La Niña is now established in the equatorial Pacific and expected to persist through winter 2017.
Another important contributing factor in the record high global temperature in 2016 was amplification over the Arctic. It is widely understood that the Arctic is warming in response to rising greenhouse gas concentrations at a faster rate than any other part of the world. The key reason is a directional feedback between air and water temperature in response to shrinkage of snow and ice cover. As the temperature warms, snow and ice cover decline, enabling more heat from the sun to be absorbed by the land and ocean surfaces, thereby further warming the overlying atmosphere.
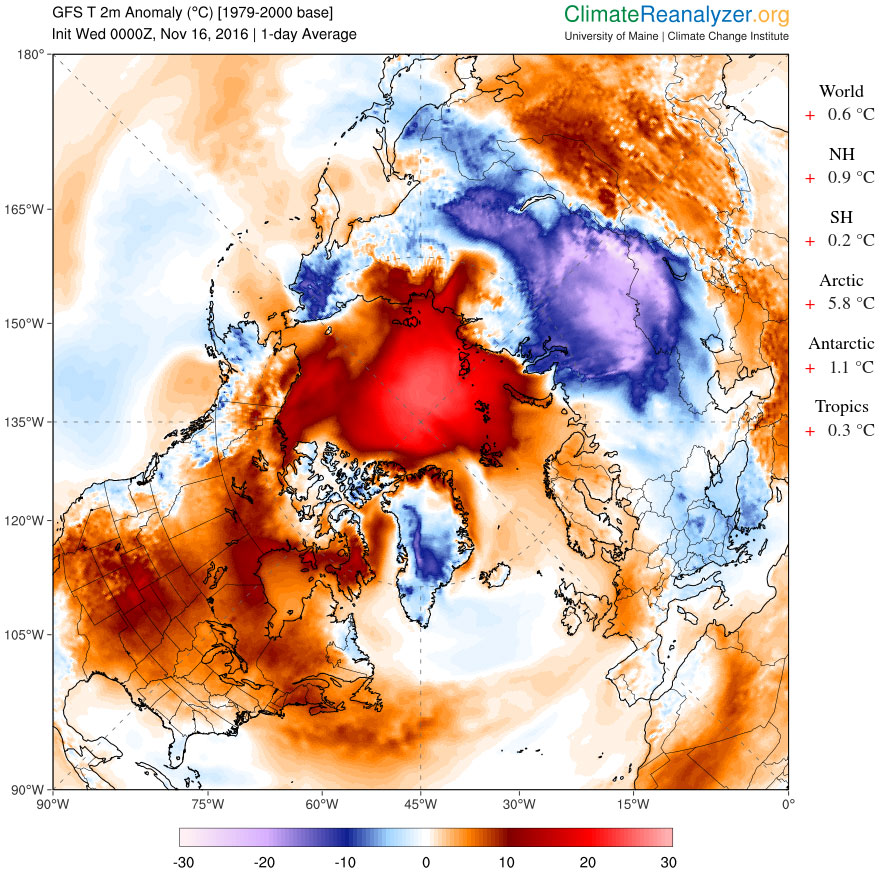
This past year 2016 was the warmest on record across the Arctic and also saw record late onset of winter conditions. The minimum sea-ice extent reached in September was the second lowest on record, bested only by 2012. Three prominent warm waves developed over the Arctic in October, November, and December and received considerable media attention. Visit the Record early-October warmth across the Arctic page to read about the October event.
A map of the temperature departure from the average across the Arctic for mid-November follows. In this event, a ridge of warm air pushed towards the North Pole from the eastern North Atlantic, causing cold air to spill into Siberia with record early-season cold.
A lot of notable weather-climate events happened in 2016. What will 2017 bring?
Predicting the future is not an easy task. But climate models that consider the interactions of ocean, atmosphere, and sea ice can give us a reasonable idea of what to expect for the next month, or even season. Statistical inferences can also be made using current ENSO conditions in the Pacific and from historical weather data. To this end, the NOAA Climate Prediction Center is a valuable resource, one that will be worthwhile to check periodically in 2017.