Appendix A. A Complete Example for Making and Recording Plant and Animal Observations
This section provides an example of how to make plant or animal phenology observations and how to complete the Phenophase Datasheets and Cover Sheet.
In this example, you are observing at one site: My Backyard.
While at site, My Backyard, you are observing the following:
- One red maple (red maple-1)
- Three common milkweed plants (milkweed-1, milkweed-2, and milkweed-3)
- Monarch butterflies
- American robins
Making Observations in My Backyard
 A. Taking animal observations in My Backyard
1. Imagine that it is early summer.
2. You travel to your site (perhaps by walking out your back door) and decide to observe your animal species before checking your plants.
3. Go to the beginning point of your transect.
4. Look and listen for three minutes while you slowly walk along your transect from beginning to end. Don’t forget to look for caterpillars on the underside of leaves when you walk by common milkweed plants!
Note: The common milkweeds on which you are observing monarch caterpillars do not have to be the same milkweed plants that you are monitoring for plant phenology, although they can. It is most important that the milkweeds you observe for caterpillars are near your transect.
5. Observation:
- You see two robins fly through the site
- You hear one robin singing.
- You don’t see any monarchs.
- You also didn’t see any caterpillars on common milkweed plants.
![]() Filling in the Phenophase Datasheet for American robin
Filling in the Phenophase Datasheet for American robin
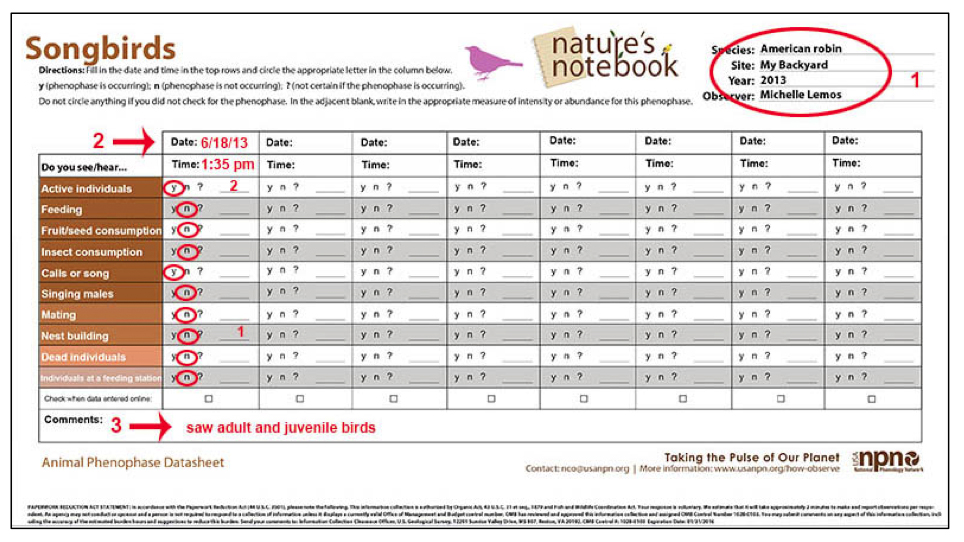
6. On your American robin Phenophase Datasheet (Fig. 1):
- Fill in the information block in the upper right corner with: Species, Plant nickname, Site, Year and Observer (your name) (Fig. 1, Note 1)
- Enter date of observations (Fig. 1, Note 2) and fill in your observations for today (Do you see/hear…?)
- You saw two robins flying, so circle “y” for ‘active individuals’ and indicate the abundance as ‘2’.
- You heard one robin singing, so circle “y” for ‘calls or song’ and indicate the abundance as ‘1’.
- You weren’t certain whether it was a male or a female robin singing, so circle “?” for ‘singing males’.
- Circle “n” for the rest of the phenophases, as you did not observe robins that were:
- Feeding
- Eating fruit or seeds
- Eating insects
- Mating
- Building a nest
- Dead
- At a feeder
- Add any comments (e.g., saw adult and juvenile birds) (Fig. 1, Note 3)
![]() Filling in the Monarch Phenophase Datasheet (Fig. 2)
Filling in the Monarch Phenophase Datasheet (Fig. 2)
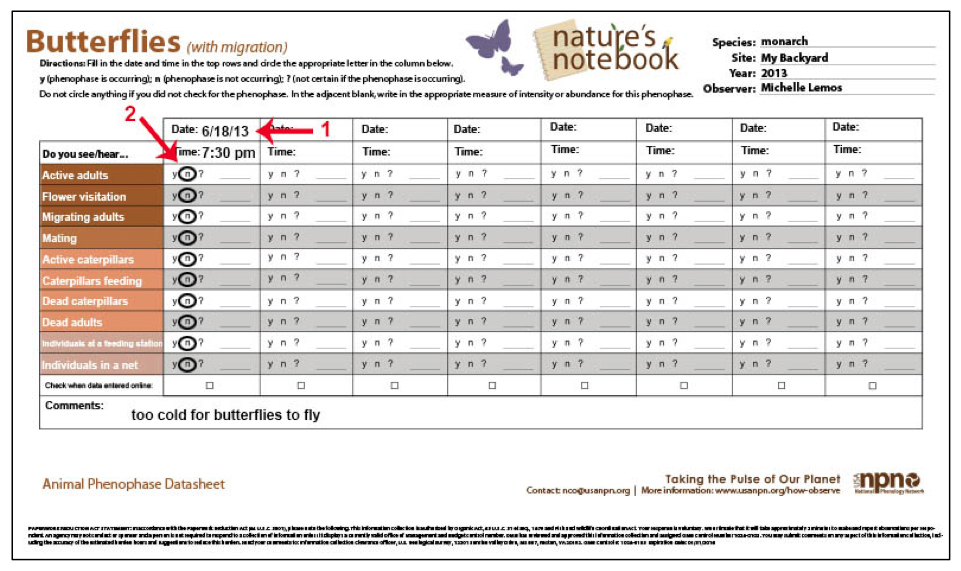
7. On the Monarch Phenophase Datasheet (Fig. 2):
- Fill in the information block in the upper right corner with Species, Site, Year and Observer (your name).
- Enter the date (Fig. 2, Note 1) and fill in your observations for that day.
- You did not see any monarchs or caterpillars; so circle “n” for all phenophases (Fig. 2, Note 2).
- Add comments (e.g., too cold for butterflies to fly)
Note: Remember – do not circle anything if you did not check for a phenophase.
Now you are ready to make your plant observations.
B. Taking Plant Observations in My Backyard
1. You walk to red maple-1 and look carefully to compare what you see to the phenophases you are asked to observe for red maple.
2. Looking up you see that the tree is full of green leaves and you can see the petioles (leaf stalks) that attach the leaves to the branch.
3. You also see samaras (winged fruits) on the tree and on the ground.
On your Maple Side Yard Phenophase Datasheet
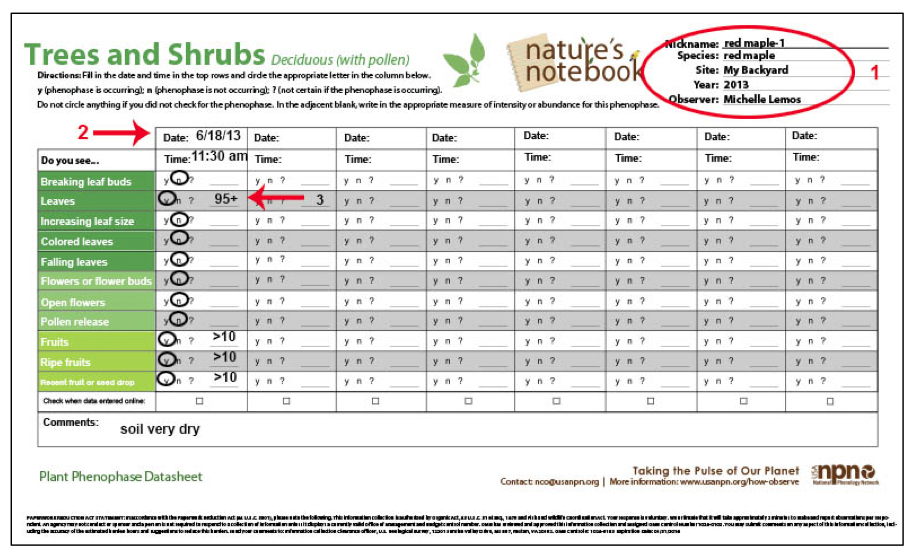
- Fill in the information block in the upper right corner with: Species, Plant nickname, Site, Year and Observer (your name) (Fig. 3, Note 1)
- Enter date of observations (Fig. 3, Note 2) and fill in your observations for today (Do you see/…?)
- Next you circle “y” for leaves and must estimate that the canopy is about as full with leaves as it could be, so you enter 95+ for abundance (Fig. 3, Note 3).
- Circle “y” for fruits and since you saw a lot of fruits, enter >10 for abundance.
- The fruits that you can see appear large and mature, so circle “y” for ripe fruits and again >10 for abundance.
- Since you saw fruits on the ground, and there were none on your last visit to the site, circle “y” for recent fruit drop and estimate >10 for abundance.
- Enter “n” for the rest of the phenophases since you did not see
- Breaking leaf buds
- Increasing leaf size (You observed that most of the leaves have reached full size.)
- Colored leaves
- Falling leaves
- Flowers
- Open flowers
- Pollen release
- Write in any comments related to your observations.
You are finished entering data for the red maple, so walk over to your milkweed plants. Last time you were out you noticed initial growth (new shoots emerging from the ground) in your milkweed patch and marked three plants to monitor.
5. You look at each plant carefully and observe that you can now see the bases of the leaves on all of your milkweed plants.
Filling in the milkweed phenophase datasheets (Forbs)
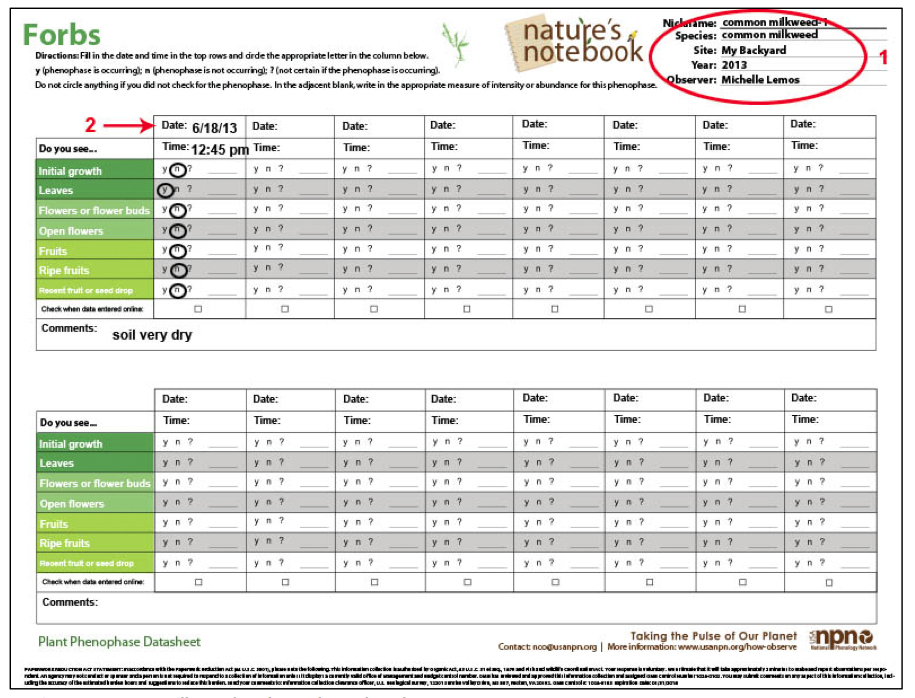
6. On your common milkweed-1 phenophase datasheet
- Fill in the information block in the upper right corner with: Species, Plant nickname, Site, Year and Observer (your name) (Fig.4, Note 1)
- Enter date of observations (Fig. 4, Note 2) and fill in your observations for today (Do you see/…?)
- Circle “y” for leaves, since you saw more than one unfolded leaf on milkweed-1.
Note: The phenophase definitions do not ask that you estimate how many leaves are unfolded, so you leave the abundance line blank.
- Circle “n’” for all other phenophases since you did not see:
- Initial growth (once you see unfolded leaves on a shoot, initial growth is over)
- Flowers
- Open flowers
- Fruits
- Ripe fruits
- Recent fruit drop
- Add comments (e.g., soil is very dry)
- Since you saw unfolded leaves on all three milkweed plants, fill in datasheets for milkweed-2 and milkweed-3 exactly the same as for Milkweed-1.
C. Completing the Cover Sheet
Before leaving your site, fill out your Cover Sheet (Fig. 5).
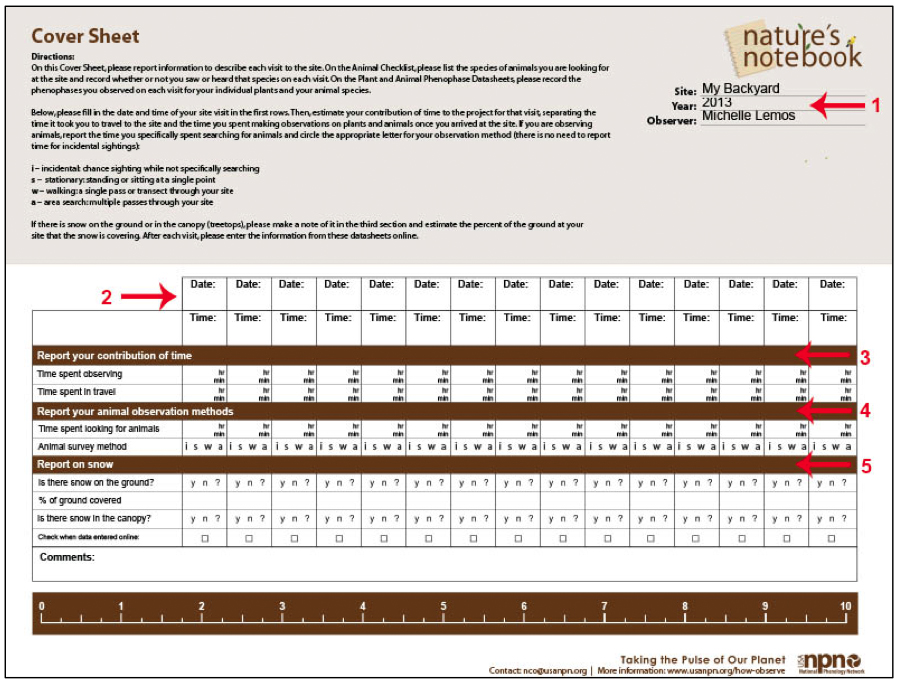
1. If you created a complete set of data sheets, your cover sheet will be pre-printed with your site, year and your name; if not, please add this information (Fig. 5, Note 1).
2. Then, enter the date (Fig. 5, Note 2).
3. Next, record the amount of time you spent today (Fig. 5, Note 3).
- Record the amount of time you spent traveling to and from your site. In this example, as your site is your backyard, you spent one minute traveling to your site, and one minute traveling back to your house, for a total of two minutes in travel.
- Indicate the time you spent observing.
- Recall, this is an indication of the total time you spent observing. If you were observing both plants and animals, this estimate would include the time you spent both looking and listening for your animals and also inspecting your plants.
- In this example, you looked and listened for animals for 3 minutes. It took 11 minutes to check your red maple and milkweed plants and to fill out the datasheets. You spent 1 minute sharpening your pencil at the beginning and filling out the cover sheet at the end. This adds up to a total of 15 minutes spent observing.
Note: Documenting volunteer effort is very important in assisting this program in procuring funding.
4. Now, report your animal observation methods (Fig. 5, Note 4).
- Indicate the amount of time you spent looking for animals. Recall that the SOS standard observation method is 3 minutes of walking in a straight transect.
- Indicate which method you used to search for the animals on your checklist. Since we are using the transect observation method, you circle “W” for ‘walking’ along your transect.
5. Finally, indicate whether there was snow at your site on this day. In this example, there was no snow on the ground, so you circled “N” for both questions regarding snow on the ground and in the tree canopy (Fig. 5, Note 5).
Congratulations! You have finished filling in your datasheets for this example!