Wild Blueberry Crop Statistics
Prepared by David Yarborough, Extension Blueberry Specialist, The University of Maine, Orono, ME 04469. Revised October 2018.
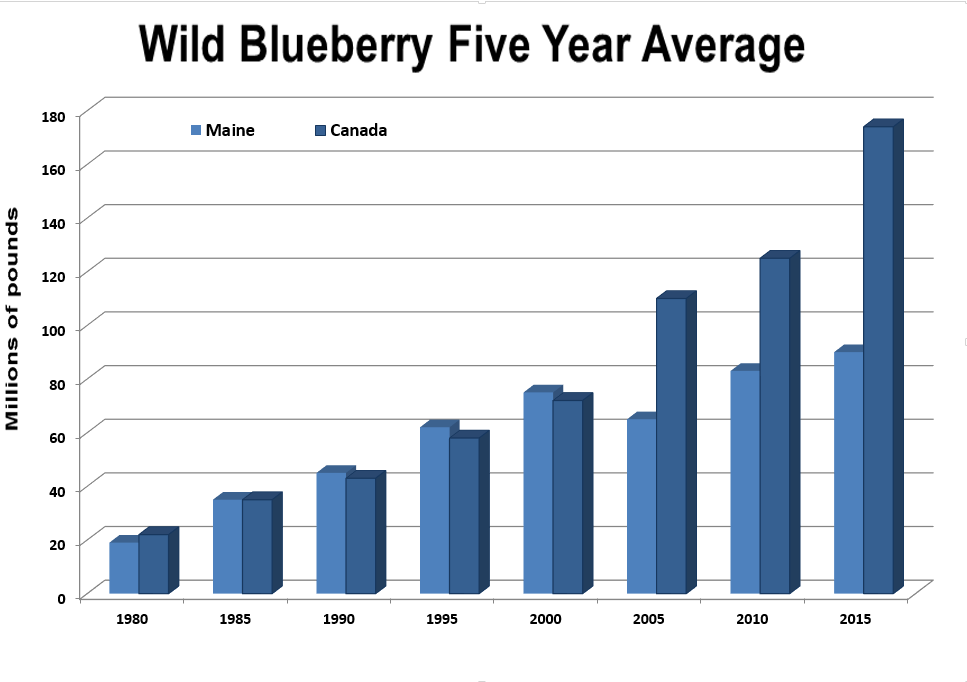
| 1924-2017 Maine Blueberry Production (Millions) and Price |
||||||||
| Year | Lbs. | Cents | Year | Lbs. | Cents | Year | Lbs. | Cents |
| 1924 | 4.136 | 7.1 | 1957 | 29.354 | 12.3 | 1990 | 75.3 | 37 |
| 1925 | 6.605 | 8 | 1958 | 16.298 | 14.6 | 1991 | 39.5 | 46 |
| 1926 | 7.104 | 8.6 | 1959 | 22.607 | 12.2 | 1992 | 84.6 | 41 |
| 1927 | 10.066 | 7.5 | 1960 | 21.336 | 12.3 | 1993 | 64.6 | 28 |
| 1928 | 6.096 | 7.8 | 1961 | 25.550 | 11.1 | 1994 | 59.5 | 30 |
| 1929 | 7.344 | 8.3 | 1962 | 30.282 | 10.2 | 1995 | 65.9 | 32 |
| 1930 | 15.496 | 5.3 | 1963 | 22.795 | 12.1 | 1996 | 59.2 | 57 |
| 1931 | 9.878 | 2.6 | 1964 | 21.863 | 13.2 | 1997 | 73.8 | 43 |
| 1932 | 4.889 | 2.5 | 1965 | 10.607 | 19.9 | 1998 | 62.9 | 46 |
| 1933 | 8.173 | 4.7 | 1966 | 19.342 | 17 | 1999 | 65.9 | 51 |
| 1934 | 5.622 | 4.1 | 1967 | 28.857 | 10.1 | 2000 | 110.6 | 40 |
| 1935 | 6.070 | 3.7 | 1968 | 16.645 | 13.5 | 2001 | 75.2 | 30 |
| 1936 | 7.416 | 5.8 | 1969 | 19.571 | 14.9 | 2002 | 62.4 | 29 |
| 1937 | 13.955 | 6.4 | 1970 | 9.167 | 20 | 2003 | 80.4 | 33 |
| 1938 | 7.929 | 3.1 | 1971 | 19.154 | 16.3 | 2004 | 46 | 46 |
| 1939 | 6.872 | 3.5 | 1972 | 16.928 | 22.2 | 2005 | 60.2 | 66 |
| 1940 | 12.559 | 5.4 | 1973 | 22.096 | 26.9 | 2006 | 74.6 | 81 |
| 1941 | 16.990 | 7.3 | 1974 | 18.566 | 18.5 | 2007 | 76.3 | 1.07 |
| 1942 | 11.933 | 8 | 1975 | 11.910 | 26.5 | 2008 | 89.95 | 61 |
| 1943 | 17.395 | 12.9 | 1976 | 24.908 | 31 | 2009 | 88.1 | 35 |
| 1944 | 3.503 | 16.2 | 1977 | 14.369 | 60.6 | 2010 | 83 | 61 |
| 1945 | 8.815 | 18.6 | 1978 | 18.053 | 51 | 2011 | 79.9 | 91 |
| 1946 | 11.238 | 19.3 | 1979 | 17.575 | 36 | 2012 | 91.1 | 76 |
| 1947 | 12.475 | 11.1 | 1980 | 21.190 | 38 | 2013 | 87.13 | 75 |
| 1948 | 17.750 | 11.2 | 1981 | 21.747 | 42.3 | 2014 | 104.42 | 60 |
| 1949 | 15.158 | 11.6 | 1982 | 35.925 | 52 | 2015 | 101.11 | 46 |
| 1950 | 14.668 | 12.4 | 1983 | 44.700 | 37 | 2016 | 101.8 | 27 |
| 1951 | 26.860 | 12.3 | 1984 | 24.680 | 25 | 2017 | 67.8 | 25 |
| 1952 | 8.071 | 12 | 1985 | 43.700 | 23 | 2018 | 50.4 | 46 |
| 1953 | 12.168 | 13 | 1986 | 42.169 | 31 | |||
| 1954 | 22.560 | 12.2 | 1987 | 36.300 | 45 | |||
| 1955 | 15.971 | 9.1 | 1988 | 52.3 | 50 | |||
| 1956 | 16.496 | 12.3 | 1989 | 26.8 | 50 | |||
| Source: 1924-1989 Maine Department of Agriculture (1924 to 1928 includes imported berries), 1990 to 2018 New England Agricultural Statistics Service. | ||||||||
Information in this publication is provided purely for educational purposes. No responsibility is assumed for any problems associated with the use of products or services mentioned. No endorsement of products or companies is intended, nor is criticism of unnamed products or companies implied.
© 2018
Call 800.287.0274 (in Maine), or 207.581.3188, for information on publications and program offerings from University of Maine Cooperative Extension, or visit extension.umaine.edu.
The University of Maine is an EEO/AA employer, and does not discriminate on the grounds of race, color, religion, sex, sexual orientation, transgender status, gender expression, national origin, citizenship status, age, disability, genetic information or veteran’s status in employment, education, and all other programs and activities. The following person has been designated to handle inquiries regarding non-discrimination policies: Director of Equal Opportunity, 101 Boudreau Hall, University of Maine, Orono, ME 04469-5754, 207.581.1226, TTY 711 (Maine Relay System).