Maine Lakes
 Maine has over 6000 lakes and ponds! Based on research on Sebago Lake conducted by scientists at the University of Maine, the Maine Lakes toolkit will allow youth to explore lake health, both from a water quality and water quantity perspective.
Are you interested in learning more about what the University of Maine and UMaine system campuses offer?
The University of Maine offers over 100 academic majors! To learn more either:
Visit UMaine’s Find a Major.
Explore our other campuses here.
If you need help connecting to UMaine or one of the other UMaine System campuses, contact us by email or call (207) 581-3877 and ask for Laura, Greg, or Sarah!
Contact 4-HScience@maine.edu to reserve a toolkit.
Video: Environscape Teaser
Curriculum Activities
Activity 1: What Makes a Lake Healthy? (Part 1)
 Objectives:
At the end of this activity, the youth should be able to answer:
- What makes a lake ecosystem healthy or unhealthy?
- What are the five basic factors of healthy?
Time to complete activity: 60-90 minutes
Background/Setting the Stage: 15 minutes
Have youth brainstorm a list of answers to the question: “What makes up an aquatic ecosystem in Maine?” Explain that ecosystems are made up of both biotic (living) and abiotic (nonliving) elements. Have youth form a circle and play “Abiotic/Biotic Ball.” Youth will pass the ball around the circle. When a youth gets the ball, they have to say one of the biotic factors listed from the brainstorming session. After finding all the biotic factors, switch to abiotic.
Materials:
- ball
- set of laptop computers or tablet with internet access
- sticky notes (labeled 1-10)
Methods
Part 1: (15 minutes)
Explain to youth that they will be determining what makes an aquatic system healthy or unhealthy. Have youth brainstorm a list (in small groups) to what makes a system healthy or unhealthy. Have groups share their lists and make a full group list.
Part 2: How Healthy is Your Lake? (30 minutes)
Have youth visit the Understanding Maine’s Lakes page (Lake Stewards of Maine Volunteer Lake Monitoring Program, Lakes of Maine website) on their laptop or tablet. This website discusses five aspects of a lake that are crucial to making a lake healthy. Youth in their groups will fill out the “Healthy Lakes Graphic Organizer” based on what they read on the website. Have groups share what they have written on the Healthy Lakes Graphic Organizer, and make a comprehensive group list.
Closure (10 minutes)
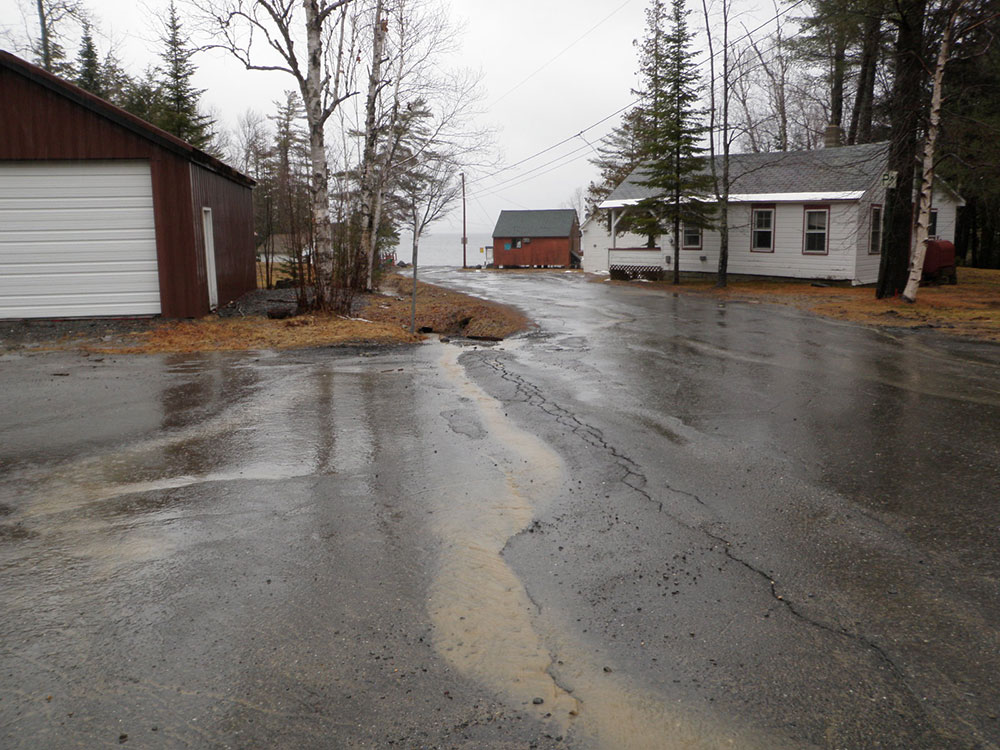
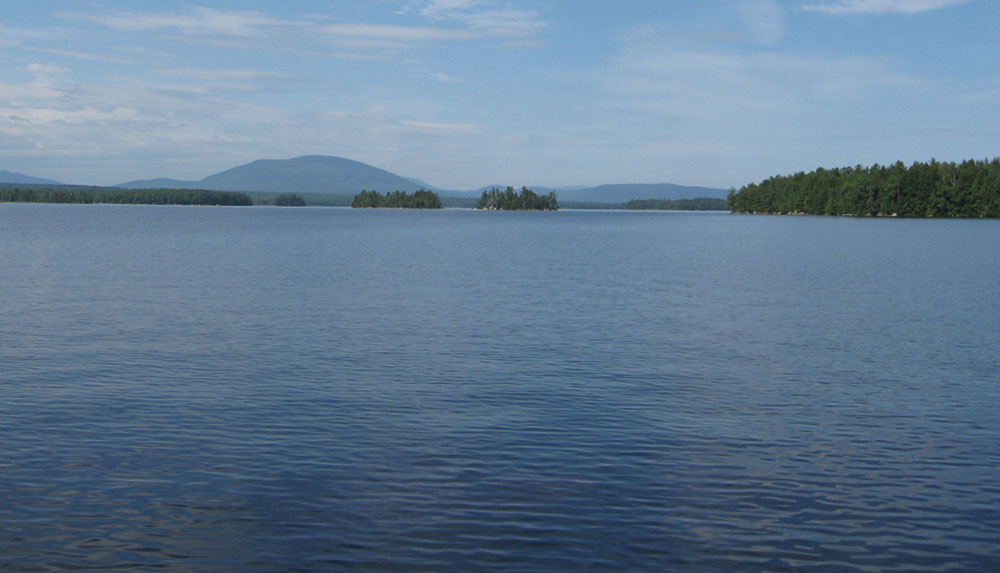
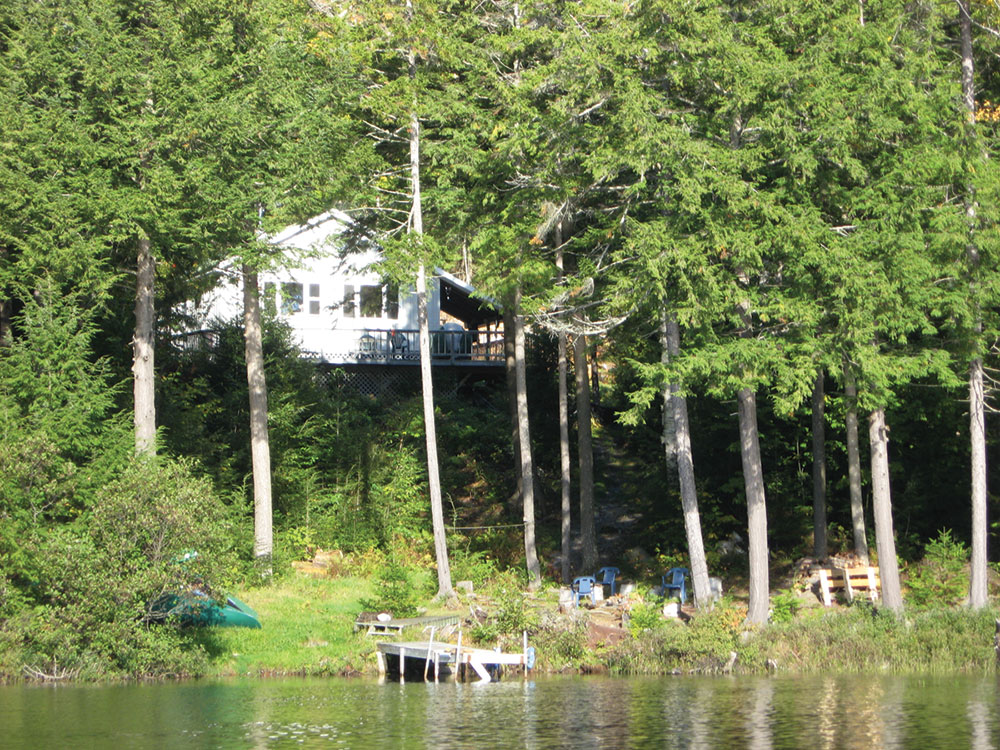
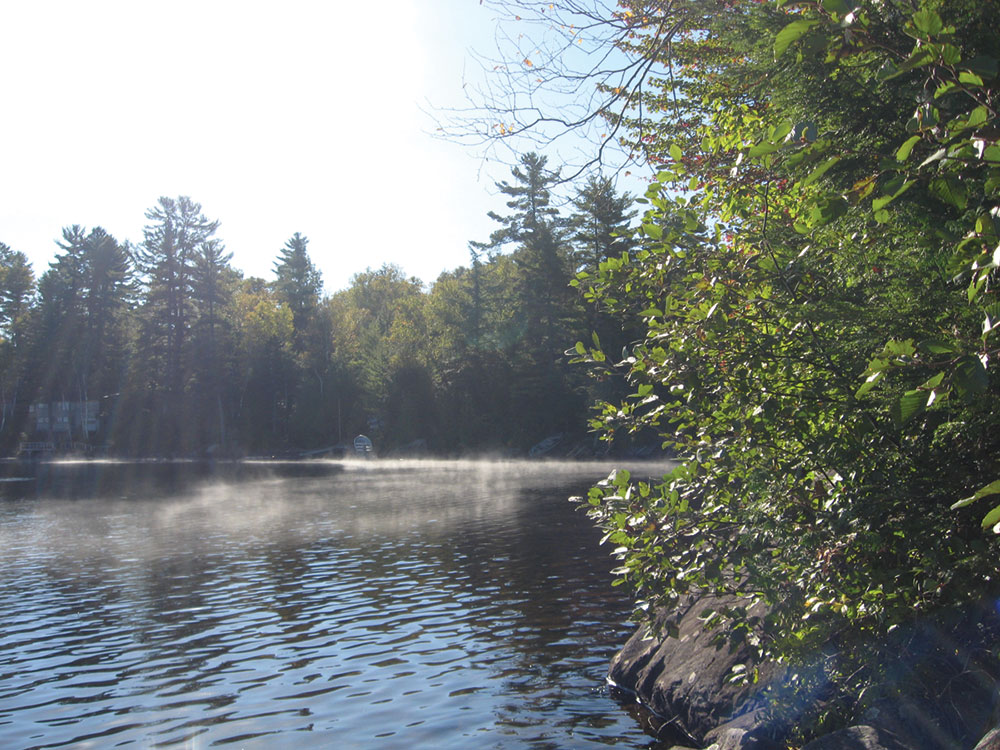
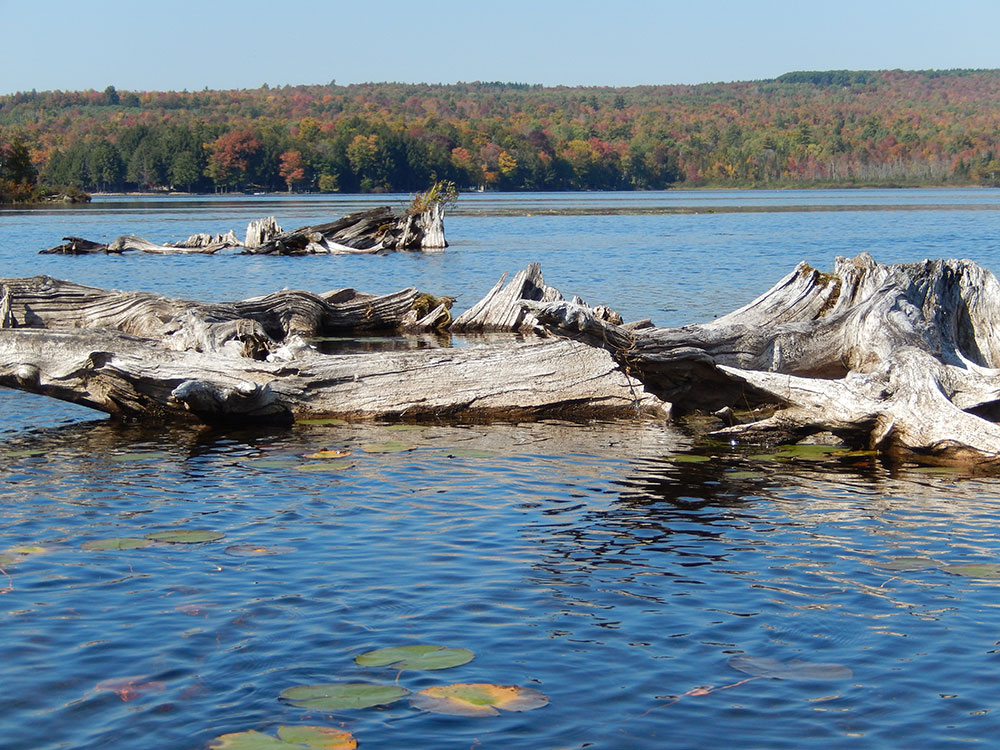
Have sticky notes labeled 1-10 setup around the room. Project photos of aquatic ecosystems on the board and have youth rate the health of the ecosystem on a scale of 1 (extremely unhealthy) to 10 (perfect health). Have youth get up and stand by the number they chose. Allow a few to share their reasoning for each photo based on what they learned in class.
Reflection Questions (Journal or Discussion)
- Why did you stand at that number?
- What parts of the image make you think the lake might be unhealthy?
- What parts of the image make you think the lake might be healthy?
- After talking about this, does anyone want to change where they are standing?
Extensions/Homework/Assessment:
Write a paragraph explaining your reasoning for our rating of one of the aquatic ecosystem photos.
Life Experience Connections:
This lesson can be focused around a local lake.
Assessment:
- Completion of the Healthy Ecosystems Graphic Organizer
- Resources and Additional Information at Understanding Maine’s Lakes.

Vocabulary:
Abiotic factors: In biology and ecology those non-living chemical and physical parts of the environment that affect living organisms and the functioning of ecosystems.
Biotic factors: Any living component that affects another organism, including animals that consume the organism in question, and the living food that the organism consumes.
Aquatic ecosystem: An ecosystem in a body of water.
Algae: Nonflowering plants of a large group that includes the seaweeds and many single-celled forms. Algae contain chlorophyll but lack true stems, roots, leaves, and vascular tissue.
Dissolved oxygen (DO): Refers to microscopic bubbles of gaseous oxygen (O2) that are mixed in water and available to aquatic organisms for respiration — a critical process for almost all organisms. Primary sources of DO include the atmosphere and aquatic plants.
Sediments: Matter that settles to the bottom of a liquid; dregs.
Activity 2: What Makes a Lake Healthy? (Part 2)
 Objectives:
At the end of this activity, the youth should be able to:
- Create different types of watersheds
- Identify the sources of pollution in a watershed
- Analyze the effects of pollutants on watersheds
Time to complete activity: 90 minutes
Background/Setting the Stage: 15-20 minutes
Split youth into two groups with one half of the youth standing close together (so they all fit under a tarp) and drape the tarp over the group. Ask each person to choose a height (arms up, standing, squatting, etc.). Have the other half of the group stand on chairs surrounding the group under the tarp.
Tell the youth under the tarp that they are a watershed and tell the youth on the chairs that they are now rain clouds. Ask the rain clouds to “rain” on the watershed, have them gently toss a couple of candy pieces onto the tarp. Where did the candy go? Why?
What does the candy represent? Who is the tallest point in the watershed? Who is along a river? Who is along the coast/ocean? Who makes up a lake?
Switch groups, have the watershed youth become the rain cloud and the rain cloud youth become the watershed. In the second group, have the youth form a lake watershed that reflects a lake that is nearby (Sebago, for example). After the rain clouds rain on the watershed, determine where the candy went. Did the candy flow, as you would expect, in the lake watershed?
Materials:
- clear plastic tarp/shower curtain
- candy (in wrappers)
- plastic spray bottles
- different colored drink powder
- different sized rocks
- garden watering cans
Methods
Part 1: Note – this part of the activity can be replaced by using the EnviroScape Model, available separately as a 4-H Science toolkit. Note that the EnviroScape model may take 30 or more minutes to present. (30 minutes)
- Ask youth what kind of watersheds we have in our area.
- Using the rocks and the tarp, have youth create a watershed that mimics one that they are familiar with. It can be a lake, pond, stream, ocean, etc. Make sure there are highlands and lowlands in their watershed.
- If youth choose a lake, pond, or ocean watershed, have them fill the shower curtain/tarp with clear water.
- Once the watershed has been created, lead a discussion with the youth starting with the question: Thinking about the area that we live in, what are some pollutants that can be found?
- As youth identify pollutants, sprinkle different colored drink powder where the pollutants might be found. For example fertilizers from farm/yards, construction/erosion from tearing up the roads, gas/oil from cars on the roads.
- Once youth have finished, fill two gardening watering cans with water.
- Have youth make it “rain” on the watershed.
Video: Enviroscape Full Webinar
Reflection: (5 minutes)
- What happened to the pollutants?
- What does the water in the watershed look like? Would you go swimming there? Why or why not?
- What does this tell you about runoff?
- How does runoff affect the water cycle?
- How would pollutants affect the ecosystems in the watershed?
- What area does a watershed include?
Part 2: (35 minutes)
Youth may work in partners or small groups.
- Pass out copies of “My Watershed” and review sheet with youth.
- Use Sebago Lake as your example watershed for filling this out (10 minutes). Allow youth time to work, providing technical and academic support as needed. (30min).
Closure: (10 minutes)
- Have youth share the watershed they chose to research along with the potential nearby pollutants.
- Discuss how these pollutants could affect the biodiversity and general health of the watershed.
Reflection Questions (Journal or Discussion):
- Why did you choose that watershed?
- Do you think the lake/river/stream you chose is healthy or unhealthy?
- Did you know about the different land uses in that watershed?
- What is the water in this area used for? Drinking? Recreation? Swimming? Fishing?
Accommodations/Modifications:
Substitute an EnviroScape model (and use the EnviroScape lesson as a substitute for parts of this activity. If laptops are not available, use topographical maps of your area to determine the watershed and threats to that watershed.
Extensions/Homework/Assessment:
Life Experience Connections: this activity can be focused around a local lake, river or stream.
Assessments:
Participation in discussion (check for understanding), My Watershed sheet.
Resources and Additional Information:
Vocabulary:
Watershed: The land area that drains to a specific body of water.
Pollutants: Any substance that renders the air, soil, water or another resource unsuitable for a specific purpose.
Biodiversity: The variety of life in the world or in a particular habitat or ecosystem.
Activity 3: Connecting to the History of Water
 Objectives:
At the end of this activity, youth will be able to:
- Determine the importance of history surrounding their watershed.
- Use primary documents to create a compilation about their watershed of study.
Time to complete activity: varies
Background/Setting the Stage: 15 minutes
Find a fellow facilitator or leader who is willing to be part of some “play acting.” Have that facilitator come in and stage an altercation between yourself and the other facilitator. Make the fake altercation around anything of your choice.
Stage the altercation in front of the group/class; make it dramatic enough so that they stop what they’re doing to pay attention. After, have them write a first-hand account of the altercation. Advise youth to be as descriptive and detailed as possible. This is a primary document (artifact, document, recording, or another source of information) that was created at the time of the event.
Explain to youth that we will use primary documents to learn about the history of their chosen
watershed.
Materials:
- laptop or tablet with internet access
Methods
Part 1: (10 minutes)
The goal of this activity is to introduce youth to the Maine Memory Network website and to provide youth opportunities to work with their local historical society to learn more about primary documents. Have youth explore the exhibit on Clean Water: Muskie and the Environment page (Maine Memory Network website).
Part 2: (30 minutes)
This can be a variety of different projects, depending on the time and resources available. Have youth search the Maine Memory Network website for their waterbody/watershed. Allow youth time to explore different exhibits and artifacts. Results may vary.
Depending on results found, youth may:
- Choose their favorite artifact and complete a mini-research project around that artifact that answers the following questions in one to two paragraphs:
- What is the artifact?
- What time period does the artifact represent?
- How does the artifact connect with your learning about watersheds?
- Use artifacts to create an exhibit either independently or in a small group. Be sure to have youth narrow their topic, work on the organization of artifacts, and have a written piece for each artifact in the exhibit.
- If there is very little information about the lake, contact the local historical society, municipality, lake association, and the Maine Memory Network about working together to scan artifacts and upload them to the Maine Memory Network. Youth can then complete either one of the above activities.
Closure: (10 minutes)
Find a way for youth to showcase their work. This can be a pair-share, where youth share their findings and writing with a partner, or youth can present to the entire group.
Reflection Questions (Journal or Discussion):
- What did you find?
- Did anything you found surprise you?
- Did anything you found explain something about the watershed today?
Supplemental Information:
Vocabulary:
Primary document: Original materials that have not been altered or distorted in any way. Information for which the writer has no personal knowledge is not primary, although historians may use it in the absence of a primary source.
Exhibit: Public display
Activity 4: Bioaccumulation
 Objectives:
After completing this activity, youth will:
- Know how pollutants move up the food chain.
- Understand how water becomes polluted.
- Understand what regulations are in place to protect their water.
- Learn about point sources and nonpoint sources (stormwater) of pollution, bioaccumulation of pollutants, and how these affect Maine.
Time to complete activity: 90 minutes
Background/Setting the Stage: 15 minutes
Ask students what we use water for in our life. After they have brainstormed a list, introduce them to the apple metaphor. As you name each statistic, cut a piece of the apple out.
- 75% of the Earth’s surface is covered in water.
- 0.5% of the water is fresh water (out of that 75% cut out a small sliver).
- 70% of that is ice (turn the sliver on its side and cut out 70%).
- That leaves 30% that we have access to. Most of it is so polluted that it is unusable (cut the apple again).
- That leaves less than 1% of fresh water or 0.007% of all the water on Earth that is readily accessible for human use.
Ask students what they think of the statistics. What happens when that little bit of fresh water isn’t safe?
Materials:
- Food Chain cards (at least 40 copies)
- rope or an area that has boundaries (such as a sports field, etc.)
- whistle
Methods
Part 1: (20-30 minutes)
- On the back of five sunfish, write, “I ate mercury.” On another five, write, “I ate dioxin.” Leave the remaining sunfish blank. If your group is larger than 15, copy extra fish, with half being “contaminated.”
- Fold the fish in half so the words are hidden inside. Secure with tape.
- Depending on the size of the group choose two to five fishermen, the rest of the students will be bass.
- Spread the sunfish out in the roped off area, this will be the lake. Designate another area to be the boat.
- Allow the bass to “feed” in the roped off area (lake). They must eat as many sunfish as possible.
- After 30 seconds of feeding, the fishermen are allowed to enter the lake to catch the bass. They can only catch one bass at a time and bring it back to the boat. Each fisherman can only catch two basses.
- When all the fishermen have caught their limit, blow the whistle to stop the game.
- Have all the students sit in a circle and have the bass and fishermen open the sunfish they have eaten. If more than half of the sunfish have been contaminated, then the fisherman becomes “sick.” Repeat the process, giving each youth a chance to be a bass/fisherman as deemed by the facilitator.
Reflection: (5 minutes)
- What are pollutants? What are dioxins/mercury?
- How did the pollutants move through the food chain?
- Even though the fisherman didn’t directly catch the sunfish, why did they get sick?
- Where do you think these pollutants came from?
- Why is it important to protect the lake/watershed from pollutants?
Guided Practice: (5 minutes)
Share that there are two types of sources where pollution can come from in a watershed: point source pollution and nonpoint source pollution. Lead a discussion on what students might think these two terms mean. Share with students the definitions/information page from the EPA website. If you used the EnviroScape model previously, this will be a review.
Pass out the “Lake Investigation” sheet to students. Review Internet research skills along with the “Lake Investigation” sheet. Depending on the needs of your students, you can walk them through filling out the sheet or allow them to complete it independently.
![illustration of combined sewer system by US Environmental Protection Agency (EPA) [Public Domain via Wikimedia Commons]; Dry weather sources: Down spout, strom drain, sewage from domestic, commercial and industrial sources, dam, outflow pipe to river, sewer to POTW; wet weather sources: combined sewage and stormwater](https://extension.umaine.edu/4h/wp-content/uploads/sites/38/2014/11/healthy-lake-8.jpg) Independent Practice/Group Work: (30-60 minutes)
Independent Practice/Group Work: (30-60 minutes)
Using laptops, complete the research investigation of your lake/watershed. Students may complete this on the Sebago Lake using on the Sebago Lake page (Portland Water District website)
Or, youth may choose a lake nearby, or relevant to their life (does their family vacation on a lake or does their town obtain their drinking water from a lake?) The Lakes of Maine website has many resources.
Closure: (10 minutes)
Bring students back to review their research notes. Have students share some of the recreational uses they found for their lake. In addition, have them share any regulations they found the surrounding industry in their watershed area.
Reflection Questions (Journal or Discussion):
- What are some point sources of pollution in Maine? How are these regulated?
- What are some nonpoint source/stormwater pollutants in Maine? How are those regulated? Are they regulated?
Life Experience Connections:
Many students living near a watershed that is used for drinking water or recreation will have used it for these purposes. Learning about the current regulations and how pollutants can affect members of the food chain, will educate students on how to treat their current watershed. Maine’s fish consumption advisories are available on the Fish & Game Safe Eating Guidelines page (Division of Environmental Health, Maine.gov website).
Assessment:
Journaling/Group Discussion Research Sheet: Please note that the amount of information about lakes in Maine will vary widely, some lakes have a wealth of information available, some have very little.
Resources and Additional Information:
- The Lakes of Maine website provides lake data on the lakes that are actively monitored in Maine
- The Mandatory Shoreland Zoning page (Maine Department of Environmental Protection, Maine.gov website). Local municipalities may have additional regulations, often these can be found on town websites. Relevant ordinances could have words such as shoreland zoning, shore, zoning, etc. in their titles.
- The local lake association may also have a website that can offer information.
- For more information on pollutants, visit the International Cooperation page of the EPA (United States Environmental Protection Agency) website.
- Think Blue Maine website
Vocabulary:
Bioaccumulation: The accumulation of substances, such as pesticides, or other organic chemicals in an organism.
Point source pollution: Pollution from industrial and sewage treatment plants.
Stormwater (nonpoint source) pollution: Is pollution is caused by rainfall or snowmelt moving over and through the ground.
Activity 5: Build Your Own Watershed
 Objectives:
After completing this activity, the youth will be able to:
- Describe how land use in a watershed affects water quantity and quality.
Time to complete activity: 50-60 minutes
Background/Setting the Stage: 15 minutes
Ask the youth if they know what the word “watershed” means. Explain that a watershed is an area of land that drains into a particular body of water. Why do we care about watersheds? How do the land features and land use of a watershed impact the body of water that it feeds?
Materials:
- aluminum tray
- food coloring (red, yellow and blue)
- aluminum foil
- styrofoam building materials (cones, cubes, rings, spheres)
- plastic cups for building, various sizes
- spray bottle
Methods
This activity works best when youth are divided into groups of two to three.
Part 1: (10-15 minutes)
Split youth into groups and give each group one aluminum tray. Explain to them that this area is their watershed. Explain that the materials are to be used to build land features. They can decide as a group whatever sort of land features they want to build in their tray, but mustn’t build their features too tall, as they will be difficult to cover with foil. The only requirement is that the youth have at least one low-lying area to be able to collect water and would represent a lake.
Part 2: (10-15 minutes)
Once youth have finished building up their land features in the tray, they will need to cover it up with aluminum foil. It is very important that the foil is folded over the outside edges of the tray, as the foil that is folded into the tray will negatively impact results. Younger groups may need some assistance with the foil portion of this activity.
Based on what features they have built, ask the youth to think about where there could be streams on their watershed. Where do streams usually originate? Where, if anywhere, on their watershed would be a logical place for a stream to begin? Then, based on what they know about how water moves, have them carefully trace stream channels with their fingers on the foil. Encourage them to be delicate with this portion, as the foil has a tendency to rip and this can also impair results.
When youth have covered their watershed with foil, supply the group with food coloring. Explain to the youth that they will be using primary colors so they can see where the rivers mix together and where they feed into a body of water. They won’t need much coloring, only two to three drops of each color.
Part 3 (5-10 minutes)
Once youth have decided where to place their food coloring and have done so, supply each group with a spray bottle. Explain to youth that the spray bottle represents rain falling on their watershed area and that they will need to spray directly downward and from a fair distance above their model.
Once youth have finished spraying their model, ask them what changes they see to their watershed. Did any of their colors mix together? What does that mean for their watershed?
If the group has already completed the EnviroScape activity, ask them what would happen if one of their streams were polluted. Would land use from theoretical areas off their model affect the body of water?
Closure: (10 minutes)
Have the youth walk around the area and examine the other groups’ models. Have each group explain their watershed and the land features as well as what they observed while spraying the watershed.
Reflection Questions (Journal or Discussion):
- Were the colors evenly mixed, or did some dominate others? Why? What does this mean for streams in lake watersheds?
- How would variations in precipitation affect the lake’s water level?
- How would variations in temperature affect the lake’s water level?
- How would watershed land use affect the lake’s water level?
Wrap up:
Scientists are currently researching how river flow and lake water levels are connected in the Sebago Lake watershed system. At the University of Maine, a model has been developed. Youth can reflect on how each parameter (precipitation, temperature, etc.) affects the water balance of the lake.
Activity 6: Stream Flow
 Objectives:
How is weather connected to lake health? After completing this activity, the youth will be able to:
- Measure and calculate stream flow.
- Make the connection between local weather data and stream flow.
Time to complete activity: 120 minutes or longer
Background/Setting the Stage: 15 minutes
Ask youth why we care about the flow rate of streams and rivers that enter lakes. What would a higher flow than normal mean for a lake? What would a lower rate than normal mean for a lake? What causes changes in river/stream flow? The issues of erosion, nutrient flow, dissolved oxygen, temperature, precipitation, runoff, infiltration, and lake water levels should be discussed.
Materials:
- laptop
- stopwatch
- meter/yardstick
- long tape measure (at least 30 feet)
- two oranges
- calculators
Methods
Choose a stream or river that flows into a lake being studied if possible. There may be streamflow data on the USGS Current Water Data for Maine, Daily Streamflow Conditions page (United States Geological Survey (USGS) website).
Part 1: (45 minutes)
Explain to youth how flow rates are calculated and measured (cubic feet/second). This is how many cubic feet of water is passing in a given second. Show students how much a cubic foot of water is, and review how it is calculated (LxWxH).
The equation for velocity should also be reviewed (Velocity = Distance/Time).
Explain to youth that they will be looking up water flow rates on the USGS website for their stream/river, or a local stream/river. Based on the factors discussed at the beginning of the activity, have youth make a hypothesis in their notebook as to whether the current flow rate will be normal, above average, or below average.
Working in pairs or small groups, youth should go to the USGS Current Water Data for Maine, Daily Streamflow Conditions page (United States Geological Survey (USGS) website) and find data for their local stream/river. Have them make note of the flow rates over the past few days (or over a specified period of time).
Have them either defend, or reject, their hypothesis (they can write a paragraph to do this, or share verbally with their groups). Ask them to use specific data to support their position.
Part 2: Fieldwork (90 minutes)
-
- Provide youth with a lab sheet and go over the procedure, step-by-step. Put youth into groups of six to seven and have them select roles (timer, two tape measures, orange dropper, orange catcher, meter stick holder, recorder).
- Youth will need to use the measuring tape to designate a distance for testing purposes. They should record this distance on their group’s lab sheet.
- Set up a youth at one end of the predetermined distance with a meter or yardstick and a stopwatch. Set up the orange-dropper at the other end. When the orange is dropped, the youth with the stopwatch should begin timing. As the orange passes the meter stick, the youth with the stopwatch should stop the timer, and record the time it took for the orange to travel from where it was dropped.
- Have youth run more trials for the same distance, and if there is enough time, encourage youth to run more trials after changing the distance.
- Have the individual groups reconvene to do calculations.
- Groups will go to their field locations and collect their data. When done collecting data, they can make any necessary calculations. Lab questions can be done as a group in written form or can be used as whole group discussion questions.
- Local precipitation values can be found:
- View Data: List Daily Precipitation Reports (Community Collaborative Rain, Hail & Snow Network website)
- Climate Data (northern Maine) page (National Oceanic and Atmospheric Administration’s (NOAA) National Weather Service website)
- Climate Data (southern Maine) page (National Oceanic and Atmospheric Administration’s (NOAA) National Weather Service website)
Closure: (10 minutes)
Youth should share their results with the other groups. If possible have youth compare their calculations to those found for the same stream/river on the USGS website (this can only occur in select locations in Maine).
Reflection Questions (Journal or Discussion):
- Where did the minimum velocity occur?
- Why do you think this happened?
- What connections can you make between the stream flow and recent weather conditions?
- Think about upstream in the watershed. What is the land used for?
- If the land is forested, would your stream response to precipitation be different than if the land is urban (paved roads and driveways)?
Life Experience Connections:
Youth will be conducting stream flow rate determination on a local stream/river. They will be making connections between current and recent weather and how that impacts the area they are studying.
Assessment:
Completion of the lab, participation in discussion.
Resources and Additional Information:
- New England Water Science Center, Maine Office page (USGS website)
- Opportunities for Citizen Science: Community Collaborative Rain, Hail & Snow Network (CoCoRaHS) website
Vocabulary:
USGS: United States Geological Survey
Flow rate: volume of water moving through a specific distance per a unit of time
Cubic inches: a unit of volume
Velocity: rate of position change
Cubic feet per second: unit of measurement for flow
![]()
![]() This activity is supported by National Science Foundation award #EPS-0904155 to Maine EPSCoR at the University of Maine
This activity is supported by National Science Foundation award #EPS-0904155 to Maine EPSCoR at the University of Maine