Estimating the Strength of Your Pollinator Force in Wild Blueberry
Prepared by Frank Drummond, Professor Emeritus of Insect Ecology, University of Maine. May 2020.
Do I have adequate pollination? Blueberry yield is an indicator of pollination. Without adequate pollination, you cannot expect to harvest the highest potential yield off your wild blueberry fields. However, you can have very good pollination and still poor yield. This can be due to a variety of other management factors including a poor prune the previous year leading to low flower density on stems, frost, drought, weeds, disease, and insect pests. Knowing the strength of your pollinator force is an important piece of knowledge that can help inform future decisions. Three tools that can be helpful to estimate your pollinator force include BeeMapper, Fruit Set Estimation, and Bee Abundance Estimation.
I. BeeMapper: Landscape Bee Predictor
BeeMapper is a web-based tool used to estimate the bee habitat around your wild blueberry field. There is a User Guide along with it to help you understand how to get the most out of this tool.
This tool identifies the vegetation cover around your field based upon digitized land cover maps and ranks them relative to what is most suitable for specific groups of native bees that pollinate wild blueberries. The output of the model is a map of predicted bee densities that are expected to inhabit your wild blueberry field, based upon their flight distances and the surrounding vegetation. The tool also estimates the level of fruit set that you might expect. It is a good planning tool for placing honey bee hives or deciding if a pollinator planting should be considered, but it is only an estimate of the native bee community. Again, this tool only provides a prediction of what is likely to be the strength of your native bee community.
II. Calculating % Fruit Set
The most straightforward way to estimate potential yield is by estimating % fruit set. This is the percentage of flowers that become fruit. Total fruit set is a result of flowers pollinated throughout the entire bloom period where bees are active in your field.
Supplies required:
- 6-10 stakes at least 2 feet high and visible from a far (painted or marked with ribbon)
- a ball of string or ribbon, or a roll of fine wire.
- waterproof tags
- waterproof pen to mark on the tags
- clipboard, pad of paper, pencil, and magnifying glasses (optional)
Instructions:
- In early spring (end of April), go out into your crop field and select 6-10 clones, the more the better. Clones are genetically distinct blueberry plants. In crop fields they can be distinguished early in the season because they have differences in stem color, stem hairiness, leaf color and hairiness, and flower size and color (later during bloom). Mark the clones with a visible stake.
- At the time of “loose cluster” when most of the flower buds are separated from the bud clusters on a stem, tie a string, ribbon, or wire; loosely around the base of the stem. This loop of string or wire should also have a waterproof tag attached that has a unique number for the clone and stem. Select 3 arbitrary stems (if you select 10 clones) or 5 such stems (if you selected 6 clones) in each of your staked clones (Figure 1).
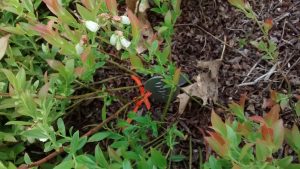
Figure 1. A tagged stem with a fine wire wrapped loosely around the stem. Photo credit: Elissa Ballman. - On your KNEES, count the number of flowers on each marked stem. Do this 3 times because mistakes are made when counting many flowers on a stem. Each time you count the flowers, write it down on a pad of paper. Once you have 3 numbers, calculate the average for that stem. Clones will mature into flowers at different times. Count flowers on a stem when they have separated so that you can count them individually. Come back to count later maturing stems. Once you have finished counting the flowers, put the pad with all your data in a safe place and wait until after bloom.
- Head out into the same field 10-14 days after bloom. By this time the flowers that were successfully pollinated will be swollen immature very small green fruit. Get your pad of paper and at each of your marked stems count the number of fruit. Make sure that you DO NOT count the pinheads. These are the flowers that never received enough compatible pollen and will not develop into fruit. They look like little green stars.
- After finishing your fruit counts, go and sit down, and get ready with your calculator or computer spreadsheet. For each stem in a clone calculate the percent fruit set:
% fruit set on a stem = (# fruit / # flowers )* 100
Once you have calculated all stem % fruit set calculations for a specific clone, calculate the average per clone. When you have an average % fruit set value for EACH clone, average the clone % fruit sets to get the average % fruit set over all your clones. This value is the average % fruit set for your field.
How do I interpret my estimated % fruit set of the field?
The rule of thumb is:
- greater than 70% is excellent fruit set
- 50-70% is good fruit set
- 25-50% is average fruit set
- below 25% is poor fruit set
Watch the fruit set video “How to Estimate Bee Abundance in Maine Blueberries” to answer any additional questions you may have. Finally, keep in mind that an estimate of % fruit set, while it is a good index of potential yield, it is not identical to your pollinator strength. Percent fruit set is affected by the number and activity of bees, yet it is also affected by the weather during bloom, and insect pests and diseases that might kill flowers during bloom. It is also impacted by the compatibility of the pollen placed by the bee on the stigma (the sticky surface that captures the pollen in the flower). This last factor can be dependent on both the types of bees that are in your field and the way they visit flowers, in addition to the mix of genetic clones that you have in your field.
Since fruit set does reflect bee abundance and activity in your field, we recommend making estimates for each of your fields over a period of 3-5 cropping cycles so that you can understand the long-term potential productivity of your field as it relates to bee abundance.
III. Estimating bee abundance in your field.
We recommend that in addition to estimating % fruit set, that you also estimate the number of bees in your field.
Supplies required:
- 40 stakes at least 2 feet high and visible from a far (painted or marked with ribbon) or a 1 yard square made of PVC tubing (Figure 3).
- yard stick or tape measure
- a ball of string or ribbon (optional)
- timer with an alarm
Instructions:
- Before bloom, select 10 areas that represent your entire field making sure that your locations represent the following: field edges, middle of the field, between the edge and middle, low and high areas. At each location measure a 1 square yard area with plenty of stems that have flower buds. At each of the corners of the square place a stake. If you want, use string and wrap it around the four stakes so that you have outlined the square just above the height of the stems. Bees are going to be most active at 60ºF or higher and when it is sunny, with little wind (less than 20 mph). If you use a 1 sq yd tube frame (Figure 3), then during bloom randomly toss the frame over the area that you wish to count bees on 10 times.
- Before you start, make sure you can tell the difference between honey bees and other wild bees or commercial bumble bees. Figure 2 is a honey bee. For more identification training check out the Northeast Pollinator Partnership.
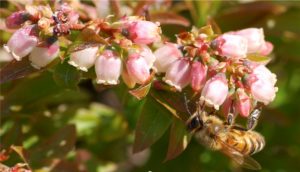
Figure 2. Honey bee working wild blueberry. Photo credit: Frank Drummond.
- To accurately measure the bee population in your field, wait until bloom is at least 1/2 underway (50% of the flowers are open) and a good bee flight day occurs. You will want to estimate the number of bees in your field three times, early bloom (50%), peak bloom (when most flowers have opened 75-80%) and late bloom (when almost all flowers have opened 95% or more). If you only sample once during bloom, do it during peak bloom.
- Once you’re ready to actually estimate the bee abundance, slowly approach one of the marked out quadrats. Stand by it for 30 seconds so that any disturbance to foraging bees that you cause will abate. Set your timer and for 1 minute count the number of bees that enter AND land in the quadrat. Keep track of two categories of bees: 1) the number of honey bees and 2) the number of all other bees. If a bee leaves the quadrat and then flies back in that counts as 2 bees. Do not try to keep track of where bees go. Your goal is to only count the total number of bees that enter the quadrat and land in 1 minute. When you are done, repeat this procedure in the other 9 marked out quadrats.
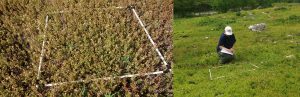
Figure 3. Bee sampling frame tossed on wild blueberry clone (left), counting bees that enter the square yard quadrat and land for a period of 1 minute (right). Photo credit: Elissa Ballman - Perform this across the whole field a total of 2-3 times during bloom, one time is fine at peak bloom, but a few times provides a better estimate.
- When bloom is over, calculate the average of all quadrat counts for honey bees and separately for all the other bees.
- Now with these two numbers: 1) average number of honey bees per quadrat per minute and 2) average number of other bees per quadrat per minute, plug them into the following equation to estimate the amount of % fruit set that your bee numbers are EXPECTED to provide:
% fruit set = 14 + (#honey bees x 8) + (#other bees x 18) *
* note: any estimate that is calculated which is more than 100% fruit set is estimated at 100% because there is no such thing as a fruit set greater than 100%.
This estimated fruit set will allow you to judge if your bee densities are adequate. You can also play different scenarios out. For instance, by putting in a 0 for honey bees if you want to see what your fruit set would be without renting honey bee colonies.
An example: let’s say that your average (across all 3 samples and all 10 quadrats was: 1) 5.1 honey bees / quadrat and 2) 0.5 other bees / quadrat. Plugging in the data to the equation gives: % fruit set = 14 + (5.1 x 8) + (0.5 x 18) or % fruit set = 14 + 40.8 + 9 = 63.8% fruit set.
Again, look at the fruit set video, “How to Estimate Bee Abundance in Maine Blueberries” to answer additional questions.
How to Estimate Bee Abundance in Maine Blueberries
IV. Additional resources – Wild Blueberry Fact Sheets: