2010 Organic Spring Wheat Variety Trial – Maine
2010 Maine Organic Spring Wheat Variety Trial Results (PDF)
Ellen Mallory, Thomas Molloy, Katherine McPhee
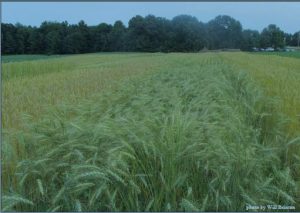
In 2010, the University of Maine, in collaboration with the University of Vermont, began an extensive trial evaluating varieties of hard red spring wheat to identify those that perform well in northern New England under organic production. In Maine, this trial was established at two locations, the University of Maine Smith Farm Research Facility in Old Town and Rainbow Valley Farm, a private farm in Sidney. The trial was also conducted at two sites in Vermont, results for which are reported in a separate bulletin. This collaborative work was funded by a grant from the USDA Organic Agriculture and Extension Research Initiative (OREI) to improve bread wheat production in our region.
TRIAL DESIGN AND VARIETIES
The experimental design was a randomized complete block with four replications, which means that each variety was planted in four separate plots at each location. All of the spring wheat varieties that were evaluated are hard red types (Table 1). Hard types of wheat are preferred for bread flour.
Table 1. Hard red spring wheat varieties planted in Old Town and Sidney, ME.
| Hard Red Spring Wheat Variety | Origin and Year of Release† | Seed Source |
|---|---|---|
| AC Barrie-1 | Ag Canada‡, 1994 | Meadowbrook Farms, Canada |
| AC Barrie-2 | Ag Canada, 1994 | Farm-saved seed |
| AC Walton | Ag Canada | McCardle Brothers, Canada |
| Ada | MAES, 2006 | Univ. of Minnesota |
| Batiscan | Semican | Semican, Canada |
| Cabernet | Resource Seed, PNW, 2001 | Tri-State Seeds, WA |
| Faller | North Dakota State Univ., 2007 | Albert Lea Seed House, MN |
| FBC Dylan | NPSAS/FBC, 2006 | North Dakota State Univ. |
| Glenn | North Dakota State Univ., 2005 | Albert Lea Seed House, MN |
| Howard | North Dakota State Univ., 2006 | North Dakota State Univ. |
| Kelse | Washington State Univ., 2008 | Washington State Univ. |
| Kingsey | Semican | Semican, Canada |
| Magog | Semican | Semican, Canada |
| Malbec | Agripro Syngenta, PNW | Tri-State Seeds, WA |
| Oklee | MAES, 2003 | Univ. of Minnesota |
| RB07 | MAES, 2007 | Univ. of Minnesota |
| Red Fife | Heritage var. from Canada, 1860 | Butterworks Farm, VT |
| Roblin | Ag Canada, 1996 | Wood Prairie Farm, ME |
| Sabin | MAES, 2009 | Univ. of Minnesota |
| Steele-ND | North Dakota State Univ., 2004 | Albert Lea Seed House, MN |
| Superb | Ag Canada, 2001 | Oliver Seed Co., VT |
| Tom | MAES, 2008 | Univ. of Minnesota |
| Ulen | MAES, 2005 | Univ. of Minnesota |
| † Year of release was not always available. ‡ Abbreviations: Ag Canada = Agriculture and Agri-Food Canada, MAES = Minnesota Agricultural Research Station, PNW = Pacific Northwest, NPSAS/FBC = Northern Plains Sustainable Agriculture Society/ Farm Breeding Club |
||
WEATHER DATA
Seasonal precipitation and temperature recorded at the Rogers Farm Forage and Crop Research Facility are shown in Table 2. Weather data closer to Sidney than Old Town was not available. Weather in 2010 was ideal for growing wheat. Due to a warm dry spring, wheat planting occurred about two weeks earlier than typical. Except for the month of June, this pattern continued through the growing season with above average temperatures and below average rainfall. From planting to harvest in Old Town, there was an accumulation of 3020 Growing Degree Days (GDD).
Table 2. Temperature and precipitation summary for Old Town, ME, 2010.†
| Old Town | April | May | June | July | August | Total |
|---|---|---|---|---|---|---|
| Average Temperature (°F) | 46.3 | 56.1 | 62.0‡ | 70.5 | 67.3 | — |
| Departure from Normal | 4.3 | 2.2 | – 0.7 | 2.1 | 1.2 | — |
| Total Precipitation (inches) | 2.3 | 1.9 | 4.0‡ | 2.2 | 1.1 | 11.5 |
| Departure from Normal | – 0.9 | – 1.5 | 0.4 | – 1.2 | – 2.1 | – 5.3 |
| Growing Degree Days (base 32°F) | 426 | 726 | 857‡ | 1182 | 1077 | 3020 |
| Based on National Weather Service data from cooperative observer stations in close proximity to field trials. Historical averages are for 30 years (1971-2000). https://www.ncdc.noaa.gov/cdo-web/datatools/normals ‡Values are incomplete due to missing or flagged data. |
||||||
CULTURAL PRACTICES
Plots were managed following practices similar to those used by farmers in Maine (see Table 3).
Smith Farm – Old Town, ME – The field used in the trial in Old Town was previously cropped to soybeans, which were not harvested due to crop failure. The field was moldboard plowed in September of 2009. On April 21, solid dairy manure was applied at 21 tons/acre (target 70 lbs N/acre) and incorporated using a seedbed conditioner. Prior to planting, the field was Perfecta harrowed to prepare the seedbed. Plots were seeded with a Almaco Cone Seeder on April 26, 2010. A Lely spring-tine harrow was used for weed control at the 3 to 4 leaf stage (May 26). Plots were harvested with an Almaco SPC20 plot combine on August 6, 2010.
Rainbow Valley Farm – Sidney, ME – The field used in the trial in Sidney was previously cropped to silage corn. Liquid dairy manure was applied at a rate of 5333 gallons/acre (target 70 lbs N/acre) on April 15 and incorporated on the same day using a disc harrow in two passes over the field and a cultivator packer. Seedbed preparation was completed on April 15 with two passes of a C-shank chisel harrow. The plots were seeded on the same day with an Almaco Cone Seeder. A Lely spring tine harrow was used for weed control at the 2 to 3 leaf stage (May 5). Plots were harvested with an Almaco SPC20 plot combine on July 30, 2010.
Table 3. General plot management of the spring wheat variety trials.
| Trial Information | Spring wheat variety trial | |
|---|---|---|
| Location | Smith Farm Research Facility, Old Town, ME |
Rainbow Valley Farm, Sidney, ME |
| Soil type | Suffield very fine sandy loam | Buxton silt loam |
| Previous crop | Soybeans | Corn silage |
| Fertility source | Solid dairy manure | Liquid dairy manure7 |
| Target nitrogen rate (lbs/ac) | 70 | 70 |
| Row spacing (in) | 6.5 | 6.5 |
| Seeding rate (seedlings/ac) | 30 | 30 |
| Replicates | 4 | 4 |
| Planting date | 4-26-10 | 4-15-10 |
| Harvest date | 8-6-10 | 7-30-10 |
| Harvest area (ft2) | 4′ x 34′ | 4′ x 34′ |
| Tillage operations | Moldboard plow, seedbed conditioner | Disc harrow, C-shank chisel harrow |
MEASUREMENTS AND METHODS
Flowering date was recorded for each variety where possible. Once the wheat reached physiological maturity, plant height, number of tillers, and wheat and weed above-ground biomass were measured. Only tillers with filled grain heads (spikes) were counted. The biomass was cut one inch above the soil surface. Prior to harvest, the incidence and severity of lodging was noted for each plot.
All varieties were harvested on the same day at each site once the latest maturing variety threshed free in hand tests and weather and logistics allowed. Following harvest, the grain from both locations was cleaned with a small Clipper cleaner. Measurements taken include grain yield, moisture, test weight, crude protein, falling number, and DON. Harvest moisture and test weights were determined using a Seedburro GMA 128 grain moisture meter. Subsamples were ground into flour using a Perten LM3100 Laboratory Mill. Flour was then analyzed for crude protein, falling number, and mycotoxin levels. Protein content was determined using a Perten Inframatic 8600 Flour Analyzer. Most commercial mills want a minimum of 12% grain protein for bread wheat, and preferably 13% for hard red spring wheat. Falling number was determined on a Perten FN 1500 Falling Number Machine. The falling number is related to the level of sprout damage that has occurred in the grain due to enzymatic activity. It is measured by the time it takes, in seconds, for a plunger to fall through a slurry of flour and water to the bottom of the tube. Falling numbers greater than 250 seconds indicate low enzymatic activity and sound quality wheat. Falling numbers lower than 200 indicates high enzymatic activity and poor quality wheat. Concentrations of deoxynivalenol (DON), a mycotoxin produced by the fungus that causes Fusarium head blight, was determined using Veratox DON 2/3 Quantitative test from the NEOGEN Corp. This test has a detection range of 0.5 to 5 ppm. Samples with DON values greater than 1 ppm are considered unsuitable for human consumption. Cleaning done by mills can reduce this value to some extent.
Data were analyzed using mixed model Analysis of Variance in which replicates were considered random effects. The LSD procedure was used to separate variety averages when the ANOVA F-test was significant (P<0.05). There were significant differences between the two locations for most measures so results from each location are reported separately.
WHAT IS A SIGNIFICANT DIFFERENCE?Variations in yield and quality can occur not only due to genetics but also due to variability in soil, weather, and other growing conditions. Statistical analysis makes it possible to determine whether a difference between two varieties is real or whether it might have occurred due to other variability in the field. The Least Significant Difference (LSD) is the minimum difference needed between two averages to consider them statistically different. LSDs at the 5% level of probability are presented at the bottom of each table for each measure. Where the difference between two varieties within a column is equal to or greater than the LSD value, you can be sure in 19 out of 20 chances that there is a real difference between the two varieties. In the example below, variety A is significantly different from variety C because the difference between their yields (1454) is greater than the LSD value (889). Variety A is not significantly different from variety B because the difference between their yields (725) is less than the LSD value (889). Throughout this bulletin, the greatest value at each site for each measure is indicated with an underline and bold type. Varieties that are not significantly different from the greatest value are also in bold type. Using the example below, variety C had the highest measured yield (underlined and bolded) but it was not significantly different than the yield of variety B (bolded). Example Table
|
Wheat Growth and Development
Varieties flowered 5 to 7 days earlier in Sidney than in Old Town reflecting an earlier seeding date (Table 4). Most varieties flowered within a few days of one another, with the exception of AC Walton, Kingsey and Red Fife, which flowered 5 to 8 days after the earliest variety.
Batiscan, Kingsey, and Red Fife were the tallest varieties. It is thought that taller varieties may be more competitive with weeds and therefore better suited for organic production than shorter varieties. We did not see evidence of this in our trial. Shorter varieties, such as Faller and Sabin, had equally low weed biomass as these taller varieties. However, we did observe that varieties with higher wheat plant biomass (Table 5) tended to have lower weed biomass providing evidence that bigger, but not necessarily taller, plants were more competitive with weeds. In general, weed pressure was moderate at both locations due to the early planting dates.
Table 4. Wheat growth and development measures and weed biomass for spring wheat grown in Old Town and Sidney, ME.
| Estimated Flowering Date | Plant Height | No. of Tillers | Weed Biomass | |||||
|---|---|---|---|---|---|---|---|---|
| Variety | Old Town | Sidney | Old Town | Sidney | Old Town | Sidney | Old Town | Sidney |
| inches | inches | no./ft2 | no./ft2 | lbs/ac | lbs/ac | |||
| AC Barrie-1 | 27-June | — | 39 | — | 53 | — | 617 | — |
| AC Barrie-2 | 26-June | 20-June | 36 | 33 | 51 | 42 | 758 | 567 |
| AC Walton | 28-June | — | 37 | — | 41 | — | 712 | — |
| Ada | 25-June | 18-June | 28 | 27 | 69 | 43 | 451 | 592 |
| Batiscan | 26-June | 21-June | 40 | 36 | 48 | 34 | 400 | 567 |
| Cabernet | 25-June | 19-June | 24 | 21 | 58 | 39 | 526 | 493 |
| Faller | 25-June | 20-June | 31 | 31 | 62 | 47 | 252 | 335 |
| FBC Dylan | 23-June | 19-June | 33 | 29 | 55 | 38 | 559 | 358 |
| Glenn | 22-June | 18-June | 33 | 32 | 57 | 44 | 556 | 458 |
| Howard | 24-June | 19-June | 31 | 31 | 66 | 45 | 611 | 458 |
| Kelse | 26-June | 19-June | 29 | 28 | 41 | 34 | 706 | 436 |
| Kingsey | 28-June | 23-June | 40 | 37 | 53 | 41 | 218 | 703 |
| Magog | 27-June | 20-June | 38 | 33 | 54 | 37 | 596 | 372 |
| Malbec | 24-June | 19-June | 26 | 22 | 51 | 43 | 340 | 448 |
| Oklee | 23-June | 18-June | 30 | 31 | 52 | 45 | 399 | 494 |
| RB07 | 22-June | 18-June | 28 | 29 | 68 | 53 | 660 | 614 |
| Red Fife | 30-June | 23-June | 42† | 40 | 50 | 46 | 497 | 455 |
| Roblin | 22-June | 18-June | 32 | 30 | 54 | 39 | 646 | 665 |
| Sabin | 24-June | 20-June | 31 | 30 | 61 | 46 | 354 | 436 |
| Steele-ND | 24-June | 19-June | 35 | 32 | 62 | 46 | 550 | 441 |
| Superb | 23-June | 18-June | 34 | 30 | 69 | 45 | 402 | 497 |
| Tom | 23-June | 19-June | 30 | 30 | 61 | 48 | 313 | 312 |
| Ulen | 23-June | 19-June | 30 | 31 | 49 | 41 | 478 | 517 |
| Trial Mean | — | — | 33 | 31 | 56 | 43 | 502 | 487 |
| LSD (0.05) | — | — | 2 | 4 | 9 | 8 | 302 | NS ‡ |
| † For all measures, bolded values are not significantly different from the highest value, which is indicated with underline. For weed biomass, the lowest values are indicated. ‡No significant difference among varieties. |
||||||||
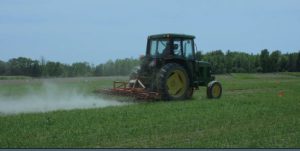
Wheat Yield

A typical yield for organic hard red spring wheat grown in Maine is estimated to be about 2,000 lbs/acre (personal communication, Matt Williams, 2011). Yields in these trials were well above this level in almost all cases, averaging 2690 lbs/acre in Old Town and 2591 lbs/acre in Sidney (Table 5; Figs.1 and 2). Faller, Oklee, and Tom were in the top yielding group at both sites. Kingsey, Ulen, Sabin, and Superb also yielded well at both sites. Varieties that were among the lowest yielding at both sites were AC Barrie-1 (certified seed), AC Barrie-2 (farm-raised seed), Ada, Batiscan, and Red Fife.
In general, test weights were good at both sites. Exceptions were AC Walton, Cabernet, and Malbec grown at the Old Town site. Wheat plant biomass is reported here as an indicator of potential straw yield. It was measured as the weight of entire wheat plant (stem, leave, and grain) cut one inch above the soil surface and dried. Subtracting grain yield from wheat plant biomass gives a very rough and likely over-estimate of potential straw yield, but one that could be useful for comparing varieties. For example, at the Old Town site, Faller and Oklee had similar yields yet the potential straw yield for Faller was 5874 lbs/acre (9449 – 3575 lbs/acre) compared with 4939 lbs/acre for Oklee (8292 – 3353 lbs/acre).
Table 5. Wheat plant biomass, grain moisture at harvest, test weight, and yield of spring wheat, Old Town and Sidney, ME.
| Wheat Plant Biomass | Grain Moisture at Harvest† | Test Weight | Yield at 13.5% moisture | |||||
|---|---|---|---|---|---|---|---|---|
| Variety | Old Town | Sidney | Old Town | Sidney | Old Town | Sidney | Old Town | Sidney |
| lbs/ac | lbs/ac | % | % | lbs/bu | lbs/bu | lbs/ac | lbs/ac | |
| AC Barrie-1 | 7733 | — | 13 | — | 58 | — | 2077 | 1987 |
| AC Barrie-2 | 7879 | 8203 | 14 | 13 | 57 | 59 | 1759 | — |
| AC Walton | 8246 | — | 14 | — | 54 | — | 2699 | — |
| Ada | 8121 | 8107 | 13 | 13 | 57 | 60 | 2098 | 2382 |
| Batiscan | 10236 | 8422 | 13 | 13 | 57 | 58 | 2006 | 2376 |
| Cabernet | 7945 | 8432 | 13 | 13 | 53 | 56 | 2790 | 2441 |
| Faller | 9449 | 9597 | 13 | 13 | 59 | 59 | 3575 | 3260 |
| FBC Dylan | 8598 | 8910 | 13 | 13 | 59 | 59 | 2987 | 2566 |
| Glenn | 8203 | 9066 | 13 | 14 | 60 | 61 | 2334 | 2200 |
| Howard | 9216 | 8954 | 13 | 13 | 59 | 59 | 2811 | 2565 |
| Kelse | 7483 | 9694 | 13 | 13 | 55 | 59 | 2138 | 2710 |
| Kingsey | 10434 | 7701 | 14 | 14 | 59 | 60 | 2836 | 2845 |
| Magog | 9199 | 9727 | 13 | 14 | 56 | 59 | 2396 | 2765 |
| Malbec | 7580 | 8522 | 13 | 14 | 54 | 58 | 2954 | 2480 |
| Oklee | 8292 | 8641 | 13 | 14 | 59 | 60 | 3353 | 2943 |
| RB07 | 9113 | 8919 | 13 | 13 | 56 | 58 | 2766 | 2716 |
| Red Fife | 8600 | 9493 | 13 | 15 | 57 | 57 | 2036 | 1993 |
| Roblin | 8568 | 8987 | 13 | 12 | 56 | 58 | 2523 | 2071 |
| Sabin | 9424 | 8855 | 13 | 13 | 57 | 58 | 2986 | 2920 |
| Steele-ND | 8619 | 8816 | 14 | 14 | 59 | 59 | 2829 | 2643 |
| Superb | 10337‡ | 8798 | 13 | 13 | 57 | 60 | 3168 | 2807 |
| Tom | 9071 | 9316 | 14 | 14 | 59 | 60 | 3684 | 3050 |
| Ulen | 8351 | 8852 | 13 | 13 | 57 | 59 | 2969 | 2679 |
| Trial Mean | 8731 | 8858 | 13 | 14 | 57 | 59 | 2690 | 2591 |
| LSD (0.05) | 1515 | NS § | — | — | 1 | 1 | 453 | 515 |
| † All varieties at each site were harvested on the same day. ‡ For all measures, bolded values are not significantly different from the highest value, which is indicated with an underline. § No significant difference among varieties. |
||||||||
Alternative Text for Figures 1 and 2
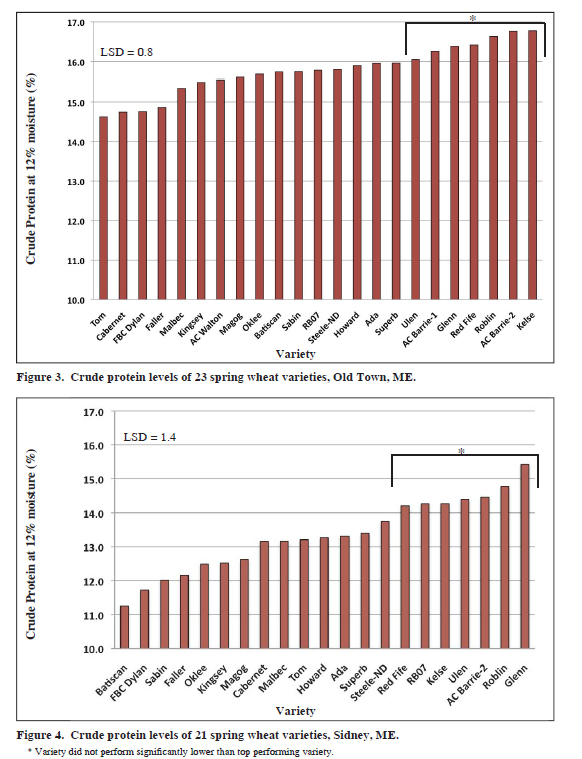
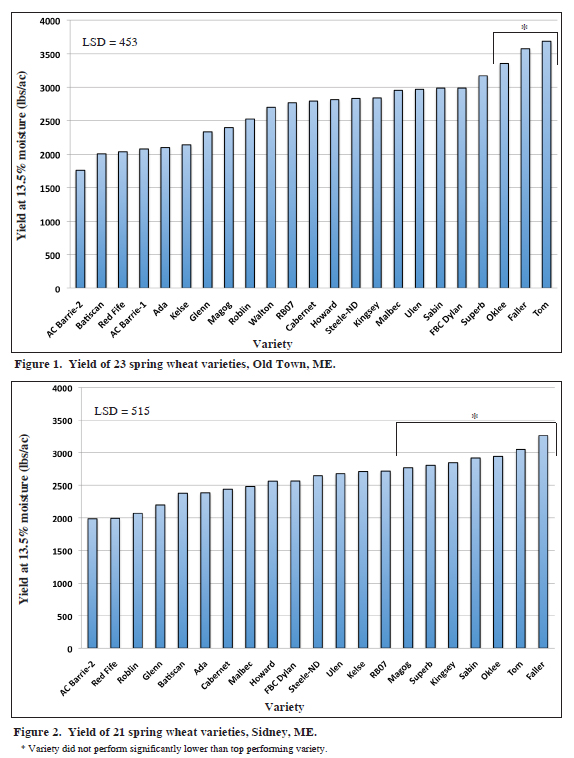
Text alternative for Figures 3 & 4
Wheat Grain Quality
Commercial mills use a variety of measurements to determine appropriate wheat quality, but at a minimum they want to know grain protein, falling number, test weight, and mycotoxin (DON) content. While 12% protein is the typical target for bread wheat, some mills expect at least 13% for spring varieties. All varieties were well above this level at the Old Town site, where the average grain protein was 15.8%. In Sidney, grain protein averaged 2.5 percentage points lower (13.3%). Here, 14 of the 21 varieties had protein concentrations above 13% and 2 varieties were below 12%. Higher protein levels in Old Town than in Sidney could be related to greater nitrogen availability at the Old Town site due to a plowed in soybean crop and a higher actual application rate of manure. The target rate for manure nitrogen application was the same for both sites (70 lbs/acre) but was based on prior years’ manure analysis. The actual application rate at Sidney turned out to be lower than 70 lbs N/acre. Varieties with high protein concentrations at both sites included AC Barrie-2, Glenn, Kelse, Red Fife, and Roblin.
Falling number, measured only for the Old Town trial, was excellent for all the varieties tested (>> 250 seconds), and reflects timely harvest at both sites. In general, sprouting is more of an issue for winter types than spring types of wheat. For DON (the mycotoxin produced by the Fusarium head blight fungus), 1 ppm is the maximum level allowed for a finished product for human consumption. Some mills accept higher levels and then clean or blend to reduce the concentration in their product to < 1ppm. In general, DON levels were lower in Sidney than in Old Town. At the Sidney site, only two varieties tested at or above 1 ppm, whereas 16 varieties did at the Old Town site. High DON levels are associated with wet, humid weather just before and during flowering because the fungus that causes Fusarium head blight and produces DON infects plants primarily through the flower. Flowering at the Old Town site coincided with rainy weather, whereas in Sidney plants flowered 1 week earlier during weather conditions that were relatively dry. Six varieties tested below 1 ppm at both locations: FBC Dylan, Glenn, RB07, Red Fife, Roblin, and Sabin.
Table 6. Quality of spring wheat, Old Town and Sidney, ME.
| Crude protein at 12% moisture | Falling number at 14% moisture | DON | |||
|---|---|---|---|---|---|
| Variety | Old Town | Sidney | Old Town | Old Town | Sidney |
| % | % | seconds | ppm | ppm | |
| AC Barrie-1 | 16.3† | — | 464 | 0.8 | — |
| AC Barrie-2 | 16.8 | 14.5 | 461 | 2.2 | < 0.5 |
| AC Walton | 15.6 | — | 409 | 2.6 | — |
| Ada | 16.0 | 13.3 | 532 | 1.6 | 0.6 |
| Batiscan | 15.7 | 11.3 | 332 | 3.2 | 0.7 |
| Cabernet | 14.7 | 13.2 | 376 | 3.6 | 2.4 |
| Faller | 14.9 | 12.2 | 413 | 1.0 | 0.6 |
| FBC Dylan | 14.8 | 11.7 | 502 | 0.5 | < 0.5 |
| Glenn | 16.4 | 15.4 | 388 | < 0.5 | < 0.5 |
| Howard | 15.9 | 13.3 | 423 | 1.8 | 0.9 |
| Kelse | 16.8 | 14.3 | 397 | 3.3 | 0.7 |
| Kingsey | 15.5 | 12.5 | 466 | 1.1 | < 0.5 |
| Magog | 15.6 | 12.6 | 511 | 1.3 | 0.5 |
| Malbec | 15.3 | 13.2 | 388 | 2.5 | 1.2 |
| Oklee | 15.7 | 12.5 | 478 | 1.0 | < 0.5 |
| RB07 | 15.8 | 14.3 | 408 | 0.8 | 0.6 |
| Red Fife | 16.4 | 14.2 | 392 | < 0.5 | < 0.5 |
| Roblin | 16.6 | 14.8 | 403 | 0.7 | < 0.5 |
| Sabin | 15.7 | 12.0 | 383 | < 0.5 | < 0.5 |
| Steele-ND | 15.8 | 13.7 | 414 | 1.2 | 0.5 |
| Superb | 16.0 | 13.4 | 440 | 1.9 | 0.7 |
| Tom | 14.6 | 13.2 | 469 | 1.2 | < 0.5 |
| Ulen | 16.0 | 14.4 | 367 | 2.5 | 0.5 |
| Trial Mean | 15.87 | 13.3 | 426 | — | — |
| LSD (0.05) | 0.8 | 1.4 | 34 | — | — |
† For all measures, bolded values are not significantly different from the highest value, which is indicated with underline.
SUMMARY
It is important to note that the results presented in this report are from just one year of data, and do not necessarily reflect how the varieties would perform in different years. This trial will be repeated in 2011.
Wheat typically receives up to twice the pay price for use as bread flour as for livestock feed, but it must meet high quality standards. Therefore, when choosing which varieties of bread wheat to grow it is important to consider their potential to produce grain with good protein, falling number, and DON levels as well as their yield potential. AC Barrie is currently the most commonly grown organic hard red spring wheat in Maine. It is valued by millers and bakers for its excellent baking characteristics, but it is also know to be a low yielder. Consistent with its reputation, in both our trials AC Barrie had among the highest grain protein concentrations and among the lowest yields of all the varieties tested. It also had moderate to high DON levels at the Old Town site, depending on the seed source.
Because of our humid, wet climate, Fusarium head blight is a key issue for growing wheat in Maine. For instance, Aurora Mills and Farm in Linneus, Maine has a rejection rate of nearly 25% due to high DON levels (personal communication, Matt Willliams, 2011). While there are currently no known varieties that are completely resistant to this disease, there are several with varying levels of tolerance and resistance. Glenn, bred in North Dakota, is one of the most resistant hard red spring varieties currently available. In our trials, DON levels for Glenn were below 0.5 ppm at both sites. Glenn also performed equally or better than AC Barrie in terms of yield, falling number, and grain protein.
Results from the sites in Vermont are available in a separate publication that can be found here. It may be helpful to compare these results from Maine and Vermont to variety trials from other regions. Ultimately, though, it is important to evaluate data from test sites that are similar to your farm and region when deciding which varieties to grow.
Acknowledgements: We thank Jeff Bragg of Rainbow Valley Farm for providing his assistance and field in Sidney, and Sabrina Correll, Hannah Griffin, Greta Landis, and Joe Cannon for their technical help.
This research is supported by the U.S. Department of Agriculture, National Institute of Food and Agriculture, Organic Research and Extension Initiative under Award No. 2009-01366, “Enhancing farmers’ capacity to produce high quality organic bread wheat.”
Published and distributed in furtherance of Acts of Congress of May 8 and June 30, 1914, by the University of Maine Cooperative Extension, the Land Grant University of the state of Maine and the U.S. Department of Agriculture cooperating. Cooperative Extension and other agencies of the U.S.D.A. provide equal opportunities in programs and employment. Call 800.287.0271 (in Maine) or 207.581.3188, for information on publications and program offerings from University of Maine Cooperative Extension, or visit extension.umaine.edu.