December 2015-March 2016
Weather and Climate Review: December 2015 – March 2016
By Sean D. Birkel, Maine State Climatologist, May 6, 2016
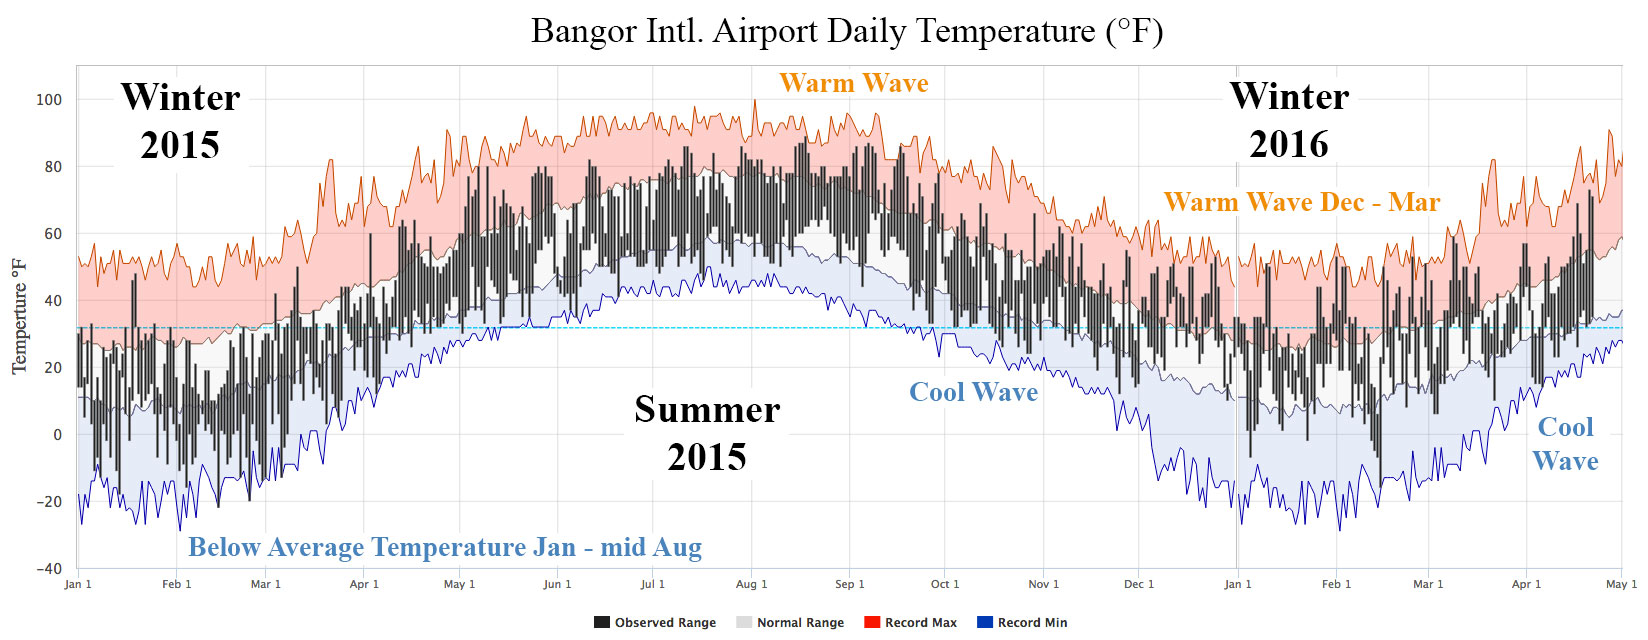
The meteorological winter (December-February) of 2015/16 ranked as warmest or near warmest on record across the state, standing in stark contrast to the colder-than-normal winter of 2014/15. The considerable difference between the character of this winter and last is readily apparent from temperature observations in Bangor (Figure 1).
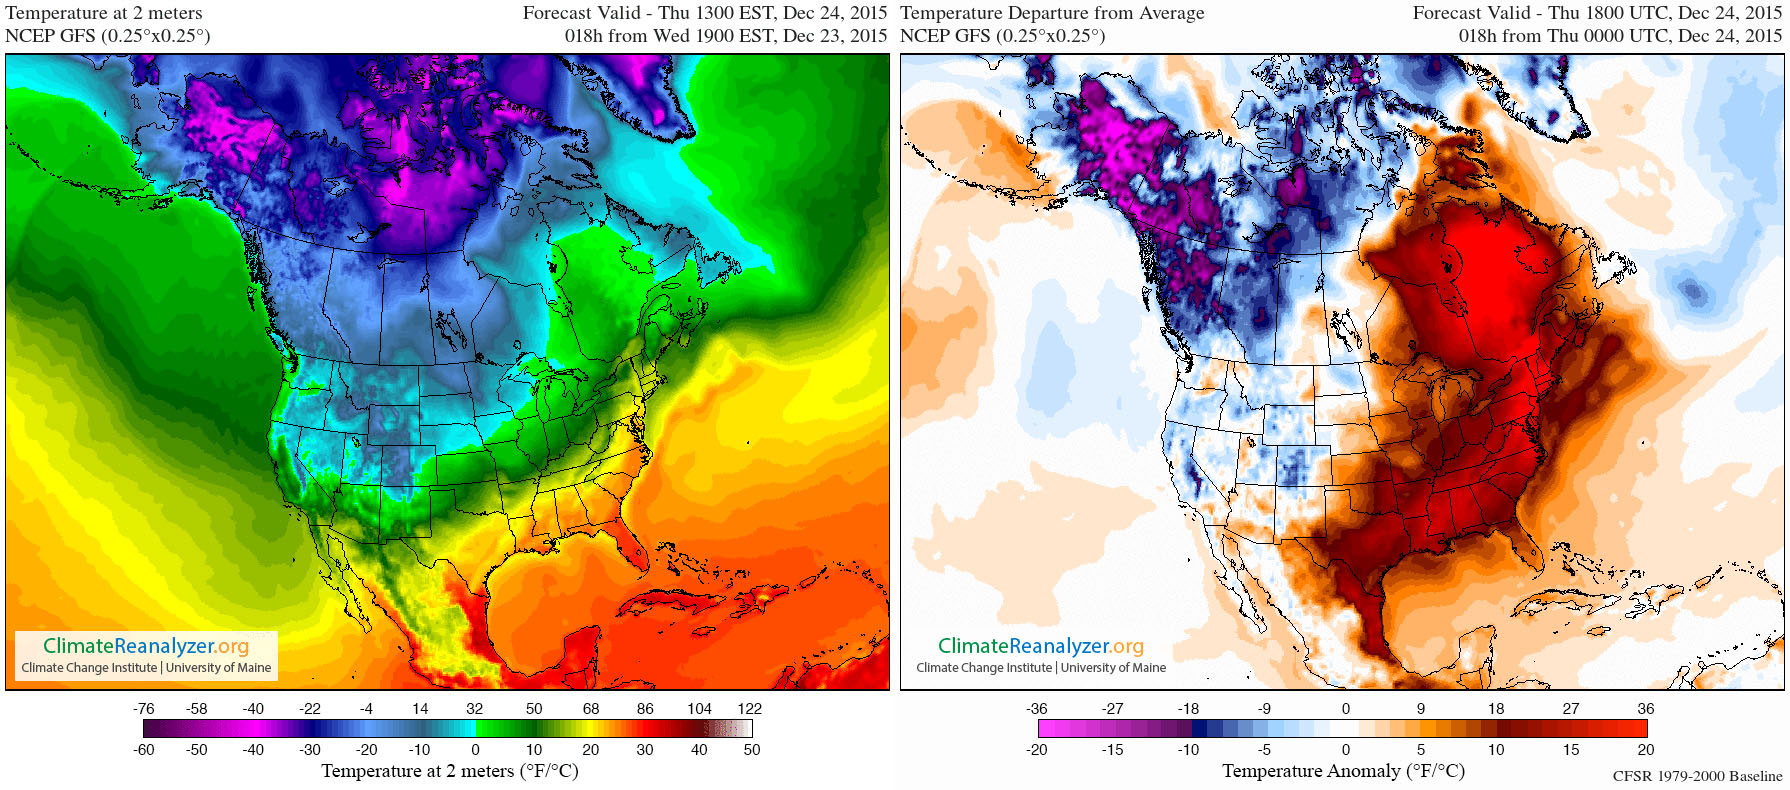
December was a particularly warm month, with daytime high temperatures reaching into the 40s and 50s °F across the state on several occasions. The warm spell developed from persistent ridging over eastern North America that repeatedly drew in heat and moisture from the Gulf of Mexico. Warmth peaked in Maine around December 24, as illustrated in the temperature maps below (Figure 2). The same circulation that delivered such warm December weather to Maine then propagated into the Arctic and caused an extraordinarily rare mid-winter melt event at the North Pole on December 30 (see my December 2015 blog post at Climate Reanalyzer).
Whereas last winter brought record or near-record snowfall to many places, this winter brought frequent rain, but only a little snowfall. In fact, only northern and western parts of the state saw continuous snow cover. Most areas south of Millinocket held consistent snow cover for only about three weeks in January. Nearly every snowfall in February and March ended with rain, contributing to non-existent or poor snow conditions.
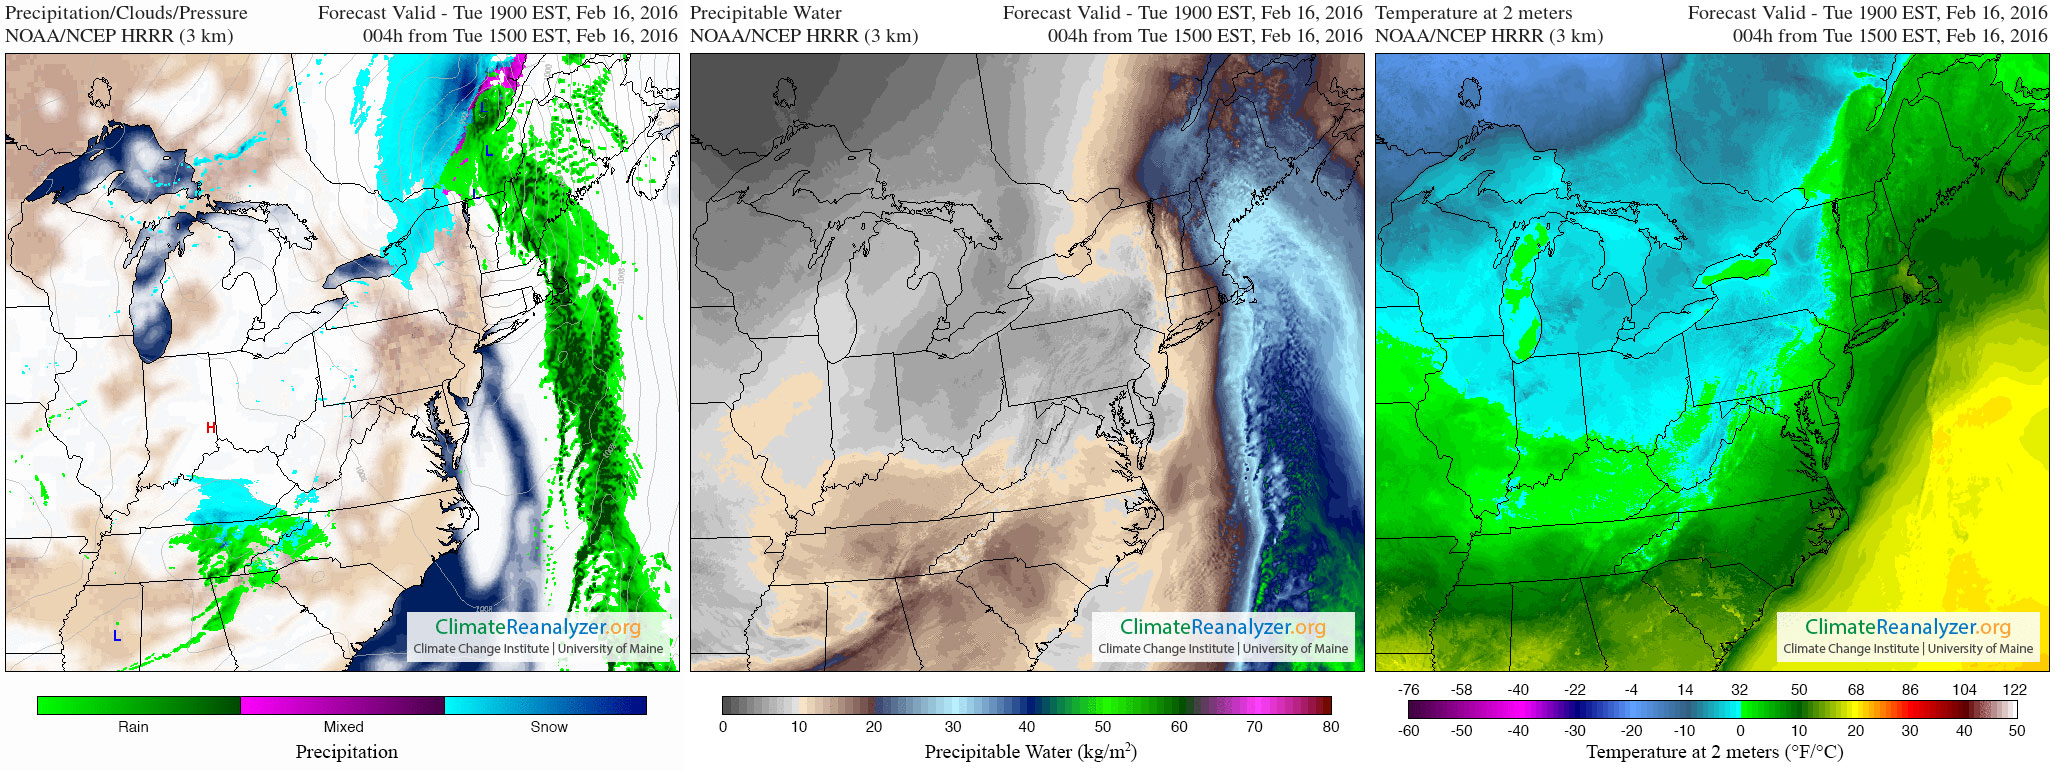
One storm event, Winter Storm Olympia, swept through Maine from Tuesday, February 15 to Wednesday, February 16 and embodies the unusual weather of the 2015/16 winter season (Figure 3). The storm track was far north for the time of year, which facilitated strong southerly flow and temperatures soaring into the 50s F. Olympia’s pressure field drew an intense band of moisture northward in what is known as an atmospheric river, causing heavy rainfall and localized flooding. Average wind speeds exceeded 20 mph inland, and 30 mph along the Downeast coast, with isolated gusts much higher. Olympia even brought thunder and lightning – unusual for northern New England in February.
How does the 2015/16 winter compare against last winter? In addition to the temperature time series shown in Figure 1, we can also examine accumulation graphs for melting and freezing degrees (Figure 4). A melting degree is a degree-day measure of temperature above freezing, and a freezing degree is likewise a measure of temperature below freezing. Many natural systems including snowpack, lake ice, and tree growth, respond strongly to the accumulations of heat and cold. Therefore, daily accumulations of melting and freezing degrees provide useful information about the character of a given season. In the figure below, we can see that, indeed, the winter of 2015/16 was MUCH warmer than 2014/15 – half as many freezing degrees and twice as many melting degrees.

With a record warm winter, there were, of course, record early ice-outs recorded on a number of lakes. Records fell primarily in the southern half of the state, where melting was sufficient to remove ice cover before the end of March. Eagle Lake (Mount Desert Island; March 1) and Pushaw Lake (March 13) are two examples. Records generally did not fall for lakes in the north and west, including Moosehead (ice broke April 23), because the slightly cooler air temperatures in the region afforded ice survival until melting slowed with a cool wave beginning late March.
Perhaps the most notable early ice-out record was made just outside of Maine in New Hampshire, where ice broke on Lake Winnipesaukee, March 18. The previous record, March 23, was set in 2012, which bested the March 24 record set in 2010. Prior to 2010, only two March ice-outs were recorded for Winnipesaukee, March 28, 1921, and March 30, 1946. Ice-out on Lake Winnipesaukee has been recorded for 130 years; the latest date was May 12, 1888; last spring, following what we remember as the cold 2014/15 winter, ice-out occurred on April 24.
So what is going on? Why was last winter so cold, while this winter was so warm? These two sharply contrasting winters result from climate variability. Last year there was particularly strong, persistent ridging of warm air across western North America, from which formed downstream a deep, and persistent trough of very cold air (visit the Climate Update: Maine’s 2014-2015 Winter Season page). The months leading up to the 2015/16 winter saw significant warming of the tropical Pacific and development of a major El Niño event. El Nino causes massive changes in atmospheric circulation from the increased flux of heat in moisture. It is not surprising, therefore, that this winter was warmer than normal, and as it so happens, climate variability lent to persistence of an atmospheric ridge over eastern North America. That happens sometimes.
But why was the 2015/16 not just warm, but VERY warm? Just because of El Niño?
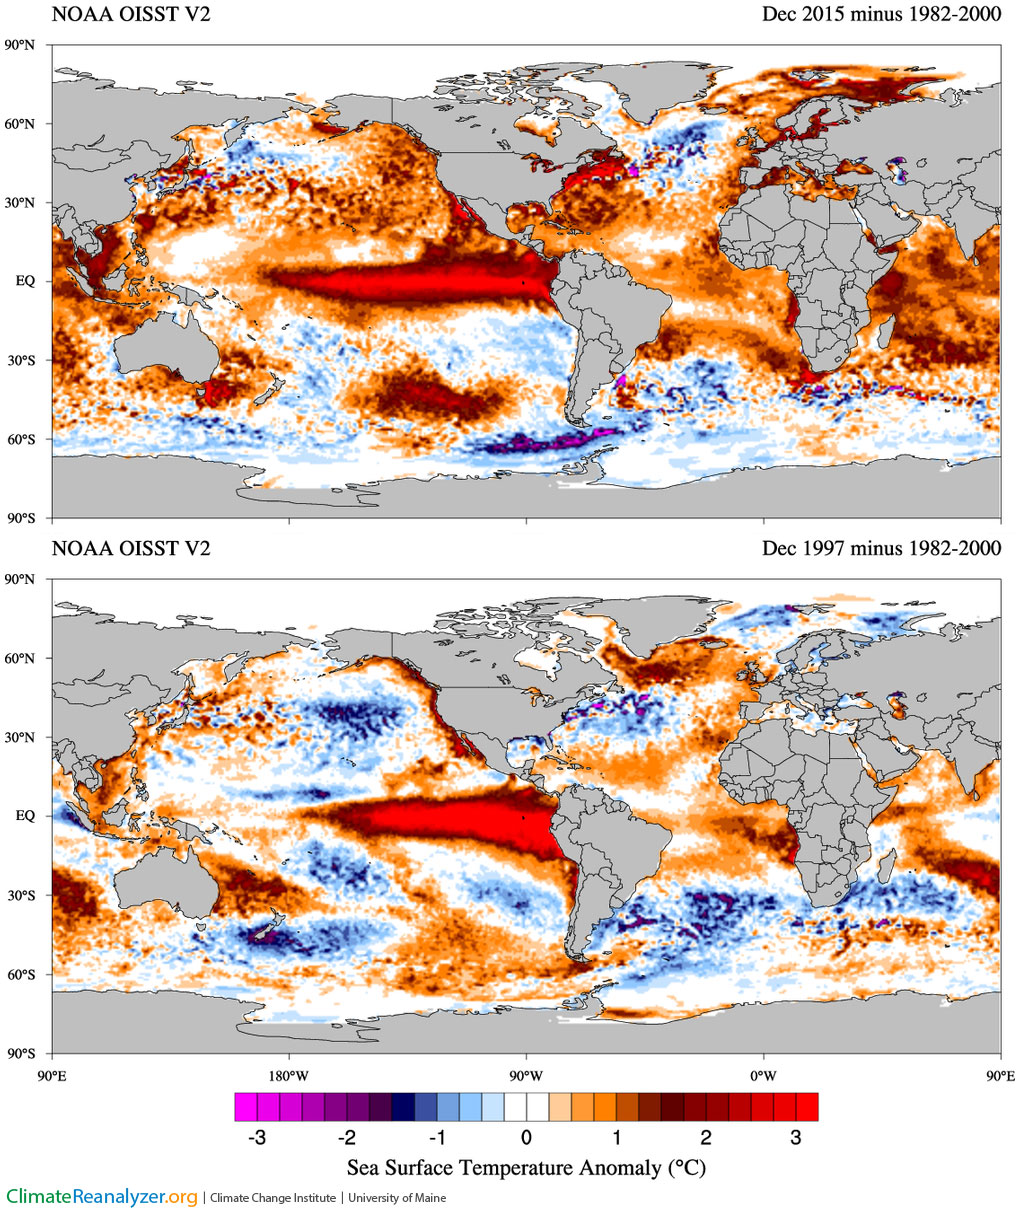
No. While the most recent El Niño most certainly contributed to the unusually warm weather, that is only part of the story. The other part is that the climate, in particular, the world oceans, have warmed. This is illustrated in Figure 5, which shows sea-surface temperature anomalies for December 2015 and 1998, months with the two strongest El Niño events on record. It is evident that warm anomalies are present over more of the ocean surface than two decades ago.
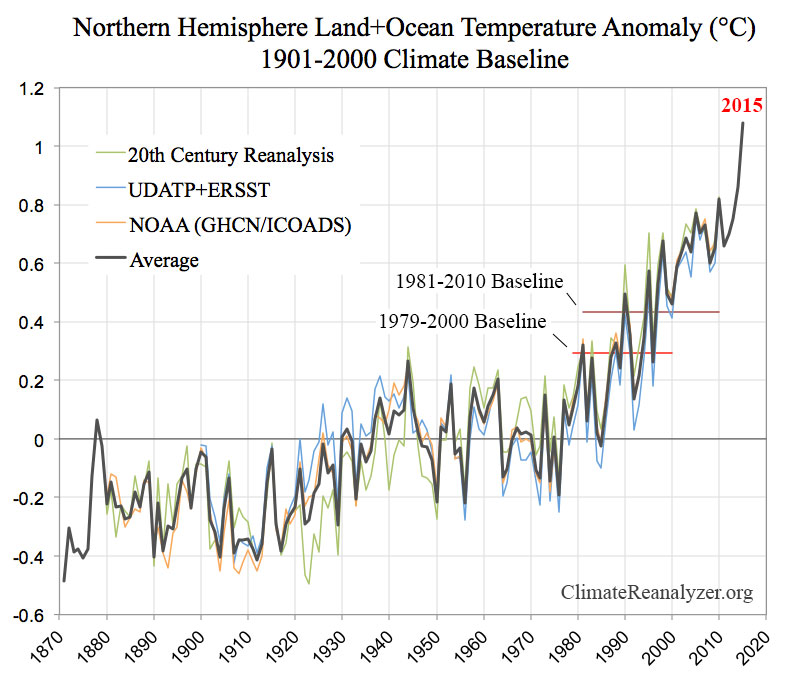
And to allay any doubt that the world is warmer now than it was decades ago, here is a graph of annual average Northern Hemisphere land and ocean temperature from multiple datasets for the interval 1871-2015. Last year was the warmest on record. What will this year bring?