Activity 8: eDNA
Topic: Model how eDNA collection helps us understand what aquatic species are present (or absent) in an area.
Time: This lesson should take approximately 45-60 minutes to complete.
Learning Outcomes:
At the end of this activity, youth should be able to…
- Work through a simulation of collecting eDNA.
- Explain what eDNA is.
- Explain how eDNA can inform us about what species are present.
Background Information for Facilitator:
When aquatic species leave behind evidence of themselves (scat, scales, tissues, etc.) those little bits of fish contain the DNA from that fish. This is what scientists call environmental DNA or eDNA. It’s DNA that is found in the environment and communicates what species are present or absent in a habitat. They can also communicate population estimates by how many samples are collected for each species (lots of brook trout DNA → probably lots of brook trout).
eDNA is favorable over physically catching fish to sample a habitat for several reasons: (1) it doesn’t harm the fish (even if you’re being careful when you catch fish, they are still being taken out of the water and handled), (2) it includes all the fish, even the ones that are hard to catch (some fish are hard to catch because there aren’t many of them, they live deep in the water, like to hide, or are not active during certain parts of the day), (3) it’s time and energy-efficient, as you only have to collect water samples instead of catching actual fish and releasing them.
This information can be applied in several different ways. Fishermen can use this information so they can fish where species are known to be present. It can also help us track where species move as our climate changes. For example, as water temperatures rise, fish will start to move to areas where the temperature is still cool (within their range), and by collecting eDNA we can monitor this. It can help us track the population of species. If a species is declining, we can identify that sooner and intervene as necessary.
Materials:
- Large aluminum trays
- Habitat labels (pond, river, ocean)
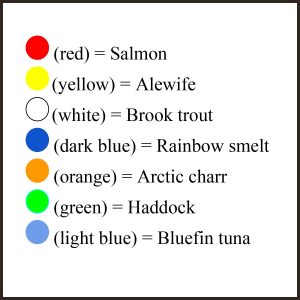
- Bead/species key
- Water
- Pencils
- Pony beads
- 50 white, light blue, yellow, red, dark blue, and green beans
- 10 orange beads
- Data collection sheets (for individual youth)

- Data collection sheets (for the whole group)

- Plastic cups
- Folders
- Whiteboard
- Paper towels
Vocabulary:
- Terrestrial = animals that live on land (all or most of the time)
- Aquatic = animals that live in water (all or most of the time)
- eDNA (environmental DNA) = the genetic fingerprint in an aquatic habitat or environment. Animals leave behind little bits of themselves, which contain DNA, wherever they go in the water, air, and soil. This DNA can be collected, identified, and traced back to species by matching collected samples to a DNA library, just like investigators would with a crime scene.
- Sampling = a method that allows scientists to infer things about a population based on a small portion of that population
Methods:
Engage
- Terrestrial animals, or animals that live on land, leave behind evidence like tracks, feathers, nests, scat, and more. Ask youth to brainstorm ideas of what aquatic animals would leave behind as evidence.
- Aquatic animals leave behind scales, scat, shells, and sometimes even tracks.
- Youth may have a hard time coming up with evidence and that’s ok! Finding evidence of aquatic animals is hard and can be frustrating. Because water is fluid evidence doesn’t fall in one place like on land, it floats around and moves. Evidence may also dissolve or decompose faster because it’s in water.
- If you have access to technology, share the video: Floods Pond: Protecting Maine’s Rare Arctic Charr (YouTube) (can also be found below in Additional Resources)
- The video sets the stage for the activity. If you do not have access to the video, explain the problem: Arctic charr are only present in 14 lakes and ponds throughout Maine. Arctic charr populations are at risk due to predation and competition of the Rainbow smelt.
- Rainbow smelt is starting to replace the Arctic charr populations in areas where they are not native because they eat the charr’s food source and have even been known to feed on young Arctic Charr. The video shows University of Maine student researchers as they collect data to record the population information of the Arctic charr population in Floods Pond.
Explore Set-up:
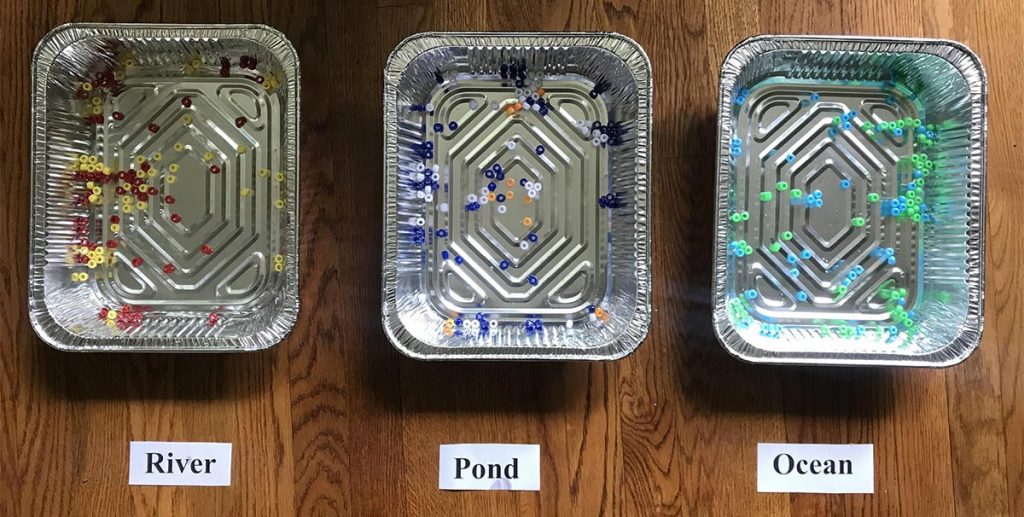
- Place three large aluminum trays around the learning area. There will be various stations youth explore. Fill them about halfway with water.
- Place a habitat card with each tray.
- River: Salmon, alewife
- Pond: Brook trout, rainbow smelt, arctic charr
- Ocean: Haddock, bluefin tuna
- Place specific bead colors in habitats:
- River: red (50), yellow (50)
- Pond: white (50), dark blue (50), orange (10)
- Ocean: green (50), light blue (50)
- Cover aluminum trays with folders so youth can’t see inside the trays as well.
- Hand out plastic cups (2 per group) and a bead key to each youth.
Explore
- Split youth up into groups of 3 or 4.
-
Click on the image for the attachment page with descriptive text. Demonstrate how to collect a sample.
- Trying not to uncover the tray, collect a water sample with your cup using one hand.
- Come back to your table/station and see if you collected any beads. If you collected a bead(s) match the bead color to the species on the key.

- Youth have the option here to record what species was found and in what habitat on a data collection table. If you chose to use it, show youth where they would record their first sample.
- Have youth discard ‘used’ evidence (beads collected from habitat) in a community cup at each table. This ensures that DNA/evidence is not being put back into the habitat to be recollected (and rerecorded) by someone else.
- Assign each youth group to one habitat. Depending on the number of youth, more than one group may be assigned to a habitat. More samples make for a more accurate representation of what is in the habitat.
- It may be helpful for youth to assign or define roles within their group: field data collector (collects eDNA sample), data manager (records data), lab manager (discards the sample), etc.
- Allow youth to collect data and possibly record what species they found in their habitat.
- If youth don’t catch all the species within an ecosystem, that is part of the process! Collecting eDNA does not guarantee you’ll collect samples from all fish that are present. Just like when you go fishing, you don’t catch all the species that are present in the lake.
- The same goes for if a sample doesn’t contain any eDNA…you don’t always catch a fish when you cast a line.
- Come back together as a group.
Explain
Note for Facilitator: Depending on what the youth find relevant, choose a few questions below.
- “What did you do? What was your procedure in this activity?”
- “What did the beads represent?”
- The beads represent the evidence that fish leave behind that contains DNA (just like a hair sample from us contains DNA). When fish and other aquatic species leave behind DNA in water, scientists call it environmental DNA, because its DNA comes from the environment. We call it eDNA for short.
- “What story can you tell from the data you collected?”
- “Did anyone find something similar with their data? Did anyone find something different with their data?”
- “How did this model represent an ecosystem?”
- “How is this model similar to what we watched in the video?”
- “How is what you did similar to what scientists do?”
- Today youth modeled the work that scientists are doing to protect Arctic charr populations. They collected data in three different habitats to see if Arctic charr were present and if there was evidence of Rainbow smelt.
Elaborate
- Using the data collection sheet for the whole group, allow youth to compile their data. This can be done whether or not youth used data collection sheets as individuals/groups. They can use the beads they discarded in their cups to see what they found.
- Ask groups to report out on (1) what habitat they sampled from, (2) what species they found, (3) how many of those species.
- Record this information on a whiteboard and youth can follow along with their own copy. See the example below. Include the following:
- Habitat
- Species found
- “How many different colors were collected?”
- “Looking at your bead key, what species of fish do the colors represent? What are the names of the species?”
- Number of fish per species
- “How many of each color bead was collected?”
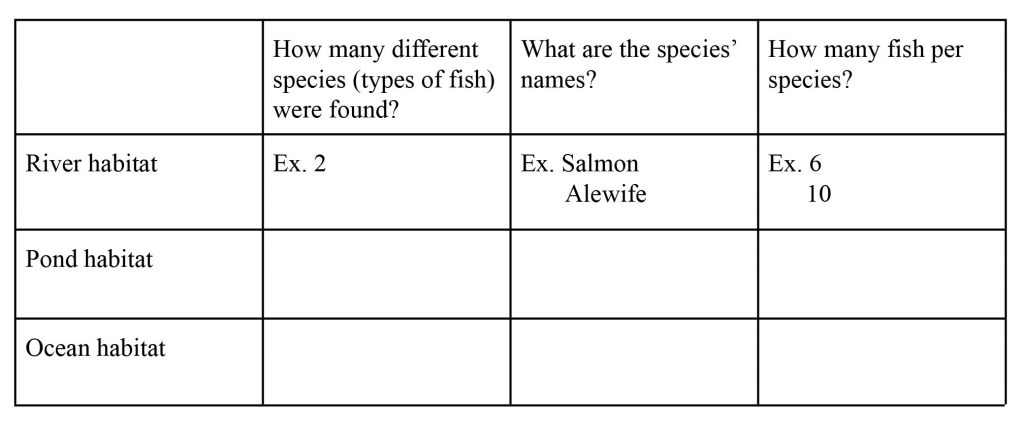
Click on the image for the attachment page with descriptive text.
- “How many of each color bead was collected?”
- Discuss as a group how their inferences changed when they pooled their data and about the broader applications of this activity.
-
-
- “What differences do you see between your data story and the group data story? How might that happen? What does that tell you about analyzing and interpreting data?”
- “How is this similar to what scientists do?”
- “How do you think collecting eDNA compares to catching the actual fish?”
- You get a lot of information in just one easy water sample.
- Collecting water and eDNA doesn’t harm the environment or fish. When you catch fish, even if you’re being careful, you’re bringing them out of the water for some time as you handle them.
- eDNA can be collected from those sneaky fish that are rare or hard to find.
- “What differences do you see between your data story and the group data story? How might that happen? What does that tell you about analyzing and interpreting data?”
-
-
Extension (two options below)
- If you have time, talk about how the orange arctic charr beads translate to real life, article: Maine scientists hope DNA in water could be way to save rare fish, February 10, 2019, by The Associated Press (BDN)
- Arctic charr is only present in 14 lakes and ponds in Maine. Those 14 lakes and ponds are the only place these fish live in the whole continental United States (excluding Alaska)!
- They are in trouble of being replaced by an invasive species (rainbow smelt), a species that has not lived in Maine before this, and is now replacing the arctic charr species (rainbow smelt eat the charr’s food source and has even been known to eat the young charr).
- Arctic charr is a mysterious species as they are hard to find and catch. That is why using eDNA to see whether they are present or absent in a lake or pond helps determine if they are still there. Then, scientists and researchers can begin to eliminate invasive (rainbow smelt) species from these lakes and ponds.
- The Reclamation of Big Reed Pond (YouTube) (Maine Department of Inland Fisheries and Wildlife) — This video of the reclamation of Big Reed Pond, a unique and undeveloped pond in Maine, summarizes the process of how several groups of like-minded people saved native populations of arctic charr from invasive rainbow smelt. The video shows how Black Ops helicopters, seaplanes, boats, and canoes helped with this process if you have any youth especially interested in crafts.
Additional Resources
- Floods Pond: Protecting Maine’s Rare Arctic Charr (YouTube) (Native Fish Coalition). This video explains why Arctic charr populations are at risk, as it documents what scientists and researchers are doing to help protect them. The video highlights University of Maine student researchers and experts in the field collecting data from Arctic charr they catch.
Supported by National Science Foundation award #OIA-1849227 to
Maine EPSCoR at the University of Maine.

This project is part of the RII Track-1: Molecule to Ecosystem: Environmental DNA as a Nexus of Coastal Ecosystem Sustainability for Maine (Maine-eDNA) at the University of Maine.