Activity 2: Species Range
Topic: Youth will learn that where fish and aquatic animals live depends on what they need to survive.
Time: This lesson should take approximately 45-60 minutes to complete.
Video: Activity 2: Species Range (YouTube)
Learning Outcomes:
At the end of this activity, youth should be able to…
- Explain some of the habitat factors that are involved in a species range.
- Discuss how knowing species ranges can be beneficial as a fisherman, individual, and scientist.
- Defend their reasoning of where they put animals using evidence.
Background Information for Facilitator:
In particular environments or habitats, some animals survive well, some less well, and some cannot survive at all. Factors that influence this are temperature, humidity, accessibility to water, or saltwater versus freshwater. These are classified as abiotic factors, non-living factors, or things in an ecosystem. When looking at these factors on a map, you can start to understand areas in which species are able to live. This is called species range, the range in which a species can survive, grow and reproduce. By looking at a species range, fishermen are able to narrow where the animals they are looking for might be. For example, clams are found in the intertidal zone, so there is no need to look for them in the middle of the ocean. Certain fish also live within temperature ranges, so looking for those fish in the right temperature waters narrows where you can find them. In other words, due to the data scientists have collected, they have narrowed down the areas in which species can survive and therefore be found.
There are also biotic factors, living factors, that influence whether a species can live within a certain area, which includes things like food, predators, other animals competing for survival, and plants. This isn’t a key focus in the lesson and activities below, but feel free to include it in your discussions!
Materials
- Map
- Species Range Table

- Stick-able fish species
- Whiteboard and marker
Vocabulary
- Species = living animals (or plants) that are closely related
- Habitat = the natural home or environment for a living animal (or plant)
- Species range = where a specific species will be found during its lifetime
- Depth = distance from the top to the bottom of something; how deep something is
- Freshwater = water that is not salty, can be found in lakes, ponds, streams, and rivers, but not the ocean.
- Saltwater = water that has salt in it, which includes all seawater
- Abiotic = non-living things or factors in an ecosystem (ex. rocks, temperature, weather)
- Biotic = living things or factors in an ecosystem (ex. plants, animals)
Methods:
Engage
Ask youth the following questions:
- “What do you think determines if a species can live within a certain environment or habitat?”
- If needed, define what a species and habitat are.
- Record these ideas on a whiteboard or poster board.
- “What about fish and aquatic species? What factors limit where they can live?”
- If youth need some help here, they can look at the different habitats on the map and ask them what similarities and differences they notice between habitats.
- Add these to the list of ideas.
- Take a moment to explain the difference between abiotic and biotic factors to youth. Then, categorize some of the examples youth gave as either abiotic or biotic.
Explore
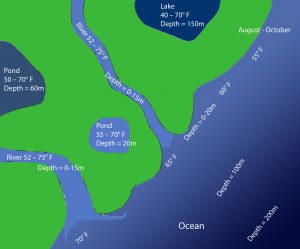
- Split youth up into groups of 2 or 3, each group representing a group of fishermen that are working together to figure out where they should fish.
- Give each group a map, a set of stick-able fish, and species ranges.
- Encourage youth to work together to map out where they are going to fish for the day depending on where their species are most likely to live, according to the species ranges given.
-
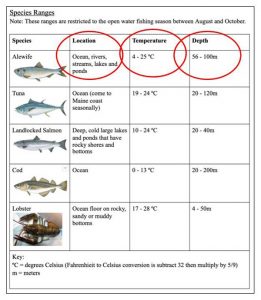
Species Range Table with fields in the first row for Alewife circled. (Click on the image for the attachment page with descriptive text.) Do one together as a group. Pick one aquatic species and talk through your reasoning for placing it where you did, taking into consideration all three abiotic habitat factors (temperature, depth, and type of water) that go into determining a species range.
- For example, the alewife could live in the uppermost lake on the map. The temperature of the lake falls within the alewife’s range, as well as the depth. Because alewife can be found in both saltwater and freshwater, they could be found in a lake.
- Give youth time to work through the rest in their groups.
- Check-in with groups to see how they are constructing explanations on where to place species based on evidence: “Why did you put the [species name] there?” “What evidence supports your explanation?”
- Come back together as a large group and allow youth to share their explanations of species placement using their maps and evidence.
- “Using your map, can you explain where we might find a [species name]? What evidence do you have to support your explanation?”
- “Do you agree or disagree with this explanation?” “If you disagree, can you share your explanation with evidence?”
Explain
- Factors that limit where a species can live are salinity (saltiness of the water), temperature, and depth. The data scientists collect about this helps us understand where to find species.
- Have youth think about deer populations. “Do any of you take walks in the woods or play in the woods?”, “Do any of you hunt deer or know someone who does?”
- Knowing where deer populations are is very helpful! Based on the data collected about the habitat they live in and their range helps us hunt in areas where deer are and populations are high. For example, we know deer don’t live in deserts, so we wouldn’t try to hunt in that habitat.
- Check-in with youth to see if they understand this concept. “How does this model (map and species ranges) represent an ecosystem?”, “How does this model represent what happens in real life?”, “Why do you think this information would be helpful/useful?”
- In relation to fish and aquatic species, this information about where species live helps fishermen decide where to fish. Knowing where deer are found can help hunters, knowing where fish are can help fishermen. For example, you wouldn’t try to catch tuna, a saltwater fish, in a pond.
- The area where a species can live during its lifetime is called a species range. It’s an area that meets the requirements for all the species’ habitat factors (temperature, type of water, depth, etc.).
Evaluate
Discuss the following questions as a whole group:
- “What was your goal for this activity?”
- “How did you get to your goal?”
- “Acknowledging a growth mindset, did you find anything challenging today?”
- “How did getting through that challenge help you? Make you feel?”
Extension
- Share with youth maps of aquatic species distributions. Here is one example, located on page 4 of Climate Change Indicators in the United States: Marine Species Distribution, August 2016 (PDF) (EPA)
- Have youth consider how a species range would shift or change with climate change.
- “As water temperatures warm, where do you think these species will go?”
- “How do you think this impacts fishermen and fisheries?”
- For a story about how the Gulf of Maine Research Institute (GMRI) has used ecosystem modeling to predict where species will go, visit the Following Fish on the Move page (GMRI).
Supported by National Science Foundation award #OIA-1849227 to
Maine EPSCoR at the University of Maine.

This project is part of the RII Track-1: Molecule to Ecosystem: Environmental DNA as a Nexus of
Coastal Ecosystem Sustainability for Maine (Maine-eDNA) at the University of Maine.