631-Guide to Efficient Irrigation of the Wild Blueberry
Fact Sheet No. 631, UMaine Extension No. 2006
Prepared by Jim Hunt, Support Scientist USDA/ARS, Wayne Honeycutt, Research Leader USDA/ARS, New England Plant, Soil and Water Lab, Orono, ME and David E. Yarborough, Extension Blueberry Specialist, The University of Maine Cooperative Extension, Orono, ME 04469. April 2009
Introduction
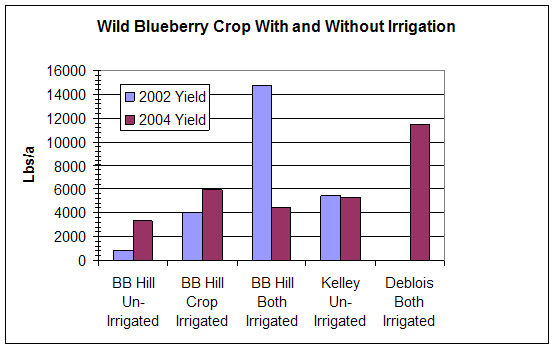
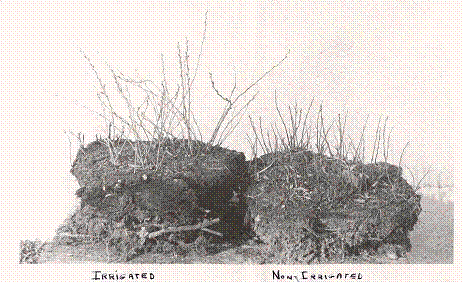
The commercial wild blueberry (Vaccinium angustifolium) in Maine is grown on a biennial cycle, in which the prune year following harvest results in vegetative growth and development of floral buds on upright stems. In the following crop year, these buds flower and develop into fruit which is harvested in late summer. Many studies over the years have indicated that supplemental irrigation of wild blueberry during dry periods of this two-year cycle can reduce crop failure and increase profitability by significantly improving both berry yield and quality (Figure 1). Although wild blueberries have been shown to be relatively resistant to drought stress, there is evidence that during very dry periods the plant will be shorter with fewer buds (Figure 2), and in the crop year preferentially direct its resources into vegetative growth at the expense of fruit production. Long-term weather trends indicate that wild blueberries could be expected to get sufficient water in August in only one year out of five. If rainfall is limiting, then irrigating both the non-crop and crop year can significantly increase wild blueberry yield over no irrigation or just irrigating in the crop year.
The goal of irrigation management is to maximize water-use efficiency while maintaining a suitable soil environment for crop growth that is neither too wet nor too dry. Adding insufficient water or postponing irrigation until signs of crop stress are noticeable, can lead to plant injury and reduced yield. Conversely, excess water application results in unnecessary pumping expenses and may lead to leaching pesticides or plant nutrients out of the root zone and into ground or surface waters.
Efficient irrigation management requires being able to effectively forecast crop water needs a few days before the demand becomes critical, and then to apply just enough water to meet those needs. This is relatively simple to do through regular monitoring of crop water use and available soil moisture. The following guidelines illustrate in a step-by-step manner how to improve irrigation efficiency without the need for expensive monitoring equipment.
Step 1: Estimating Crop Water Usage
Many experienced growers have an intuitive feel for the water demand of their crop. The traditional “rule of thumb” of 1 inch of water per week was shown in a recent four year weighing lysimeter study conducted in Maine to be a fairly accurate estimation for many of the state’s wild blueberry fields. For instance, the study showed that the combined average water use for the months of June through August at a blueberry field in Deblois, ME was about 0.88 inches per week. But, the problem with averages is that they tell only part of the story. The weekly variation associated with this average turned out to be nearly 0.30 inches per week! This means that during the months of June through August, weekly crop water demand at the field varied from less than 0.60 inches to almost 1.20 inches of water. A grower would have to be highly attuned to the daily weather to be able to consistently and accurately predict such wide variations in water demand. Clearly, some easy and reliable means of quantifying crop water demand is required for developing more efficient irrigation practices. In fact, it turns out that crop water demand can be tracked rather easily using weather data.
Evapotranspiration (ET) is a term used by scientists to describe the two closely related processes of water evaporation and plant transpiration that comprise the primary mechanisms by which water moves from the terrestrial environment to the atmosphere. Evapotranspiration represents the crop’s water use. Evapotranspiration is strongly influenced by weather factors such as the amount of overall sunlight, wind speed, air temperature, and relative humidity. All other things being equal, ET rates will be greater on hotter, drier or windier days than on cooler, more humid or calmer days. Specific crop ET rates can be measured directly, but this requires expensive and rather cumbersome research equipment. A quicker and easier way of estimating daily ET rates is based entirely upon the daily weather. These “reference or potential ET” rates, as they are called, are calculated by putting the values of daily weather variables such as total solar flux and maximum and minimum air temperature into a mathematical model known as the Penman-Montieth reference equation. Although the derivation of this equation is complex, an easy to use interactive Excel worksheet for determining reference ET and instructions are available from the Wild Blueberry Extension website:
- Penman-Montieth ET Worksheet (Excel)
- Penman-Montieth ET Worksheet with Solar Estimate & Equation Instructions
Reference ET rates are very useful because they allow for an estimation of crop specific ET rates. Table 1 below shows the average reference ET rate in inches per week for the months of May through August for three sites at different distances from the coast in Washington County, Maine. Greater distance from the coast resulted in higher reference ET rates, reflecting increased expected water demand at inland sites. This is consistent with the general expectation of cooler, more humid weather conditions at coastal sites relative to inland sites. Growers with more inland fields can usually expect to need to irrigate a little more frequently than growers with fields closer to the coast, all other things being equal. For example, in July, reference ET was on average 0.30 inches greater at a field 12 miles from the coast than at a field within 0.5 miles from the coast (Table 1). This likely reflects the influence of reduced temperature and more frequent fog in reducing plant water use closer to the coast.
Use Weather Data to Calculate Crop Water Use with Crop Coefficients
Crop coefficients (Kc) are dimensionless numbers calculated from the ratio of actual ET rates to reference ET rates. Crop coefficients vary by crop type, location and stage of growth. Once known for a particular crop, the Kc value allows for the estimation of a crop’s actual water usage based entirely upon weather data-generated reference ET. In research conducted over several years, we experimentally determined actual ET rates using weighing lysimeters and reference ET rates using weather data. Data from four years of study indicate that the wild blueberry in Maine has a fairly constant Kc value of 0.70 from May through August. That is, for the Maine wild blueberry, the actual crop water use is approximately 70 % of the reference (potential) water use. Actual weekly water use (ET) can then be determined by multiplying the reference ET by the number 0.70.
| Table 1. Average weekly reference Evapotranspiration Rates for three distances from the Maine Coast given in inches per week* | |||
| Month | Deblois (~12 miles to coast) |
Jonesboro (~5 miles to coast) |
Jonesport (~0.5 miles to coast) |
| May | 1.11 | 0.91 | 0.85 |
| June | 1.20 | 1.07 | 0.97 |
| July | 1.39 | 1.27 | 1.09 |
| August | 1.12 | 1.05 | 0.95 |
| *Penman-Montieth ETo rates based on 2004-2008 weather data at Jonesboro and Jonesport and 2005-2008 weather data at Deblois. | |||
For example:
Actual crop water use (actual ET) is calculated by multiplying reference ET by the crop coefficient (Kc).
Reference ET x Kc = Actual ET
Let’s say you are interested in calculating crop water use (actual ET) at Deblois in July. According to Table 1, the Reference ET for July at Deblois was 1.39 in/wk. As our research has shown, the crop coefficient for wild blueberry is equal to 0.70, we can calculate actual ET as:
1.39 inches per week x 0.70 = 0.97 inches per week
Information in Table 1 represents the four-year average values and is provided only to illustrate typical general reference ET patterns. In order for growers to calculate the water demand at any given time, they would need the current weather data for the period of interest. Daily and weekly weather data for many locations in Maine can be found online at sites such as that provided by the National Oceanic and Atmospheric Administration (NOAA) website or by private web-based companies such as the Weather Underground website. For most growers, at least one of these sites should be able to provide nearly all of the climatic variables necessary for the determination of reference ET. With this information at their disposal, growers can have a good idea of the amount of water that their crops are using at any given time. All that is needed then for prudent irrigation management is knowledge of how much water remains within the soil, as discussed below.
Step 2: Predicting Crop Water Needs from ET Rates and Precipitation Totals
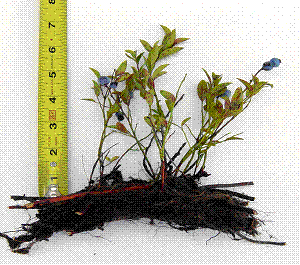
Once estimates of the amount of water used by plants (ET) and that provided by precipitation are established, the water budget method gives growers a consistent means of scheduling irrigation applications. This simple method tracks the changes made to the soil water deficit due to losses from plant usage (Reference ET x 0.70) and gains from rain and irrigation. For many crops, the water budget method incorporates estimates of water availability that are based upon a given soil’s texture-related water holding capacity. With wild blueberries, however, such estimates are difficult to calculate because of the crop’s horizontal rooting systems, which normally extend only between two and four inches below the soil surface but travel radially for some distance beyond the plant (Figure 3).
Therefore, a different approach is needed for determining wild blueberry water demands. The water budget method presented here simply modifies, through the use of real-time weather data, the traditional approach of assuming a 1 inch per week water requirement. By calculating crop water use from reference ET rates, this method takes into account day to day differences in weather while requiring that at least one inch of water be added to the soil each week. The method should be initiated at a time when the soil is relatively saturated with water to ensure that irrigation scheduling is consistent with the soil water deficit. The following example illustrates this method.
| Table 2: Example of Water Budget Method for a Hypothetical July Week | |||||
| Day of the week | Reference ET (inches) |
Crop Water Use (inches) |
Rain (inches) |
Irrigation (inches) |
Water deficit (inches) |
| Monday | — | — | saturate | 0 | 0 |
| Tuesday | 0.18 | 0.13 | 0 | 0 | 0.13 |
| Wednesday | 0.23 | 0.16 | 0 | 0 | 0.29 |
| Thursday | 0.09 | 0.06 | 0.03 | 0 | 0.32 |
| Friday | 0.24 | 0.17 | 0 | 0 | 0.49 |
| Saturday | 0.19 | 0.13 | 0 | 0 | 0.62 |
| Sunday | 0.25 | 0.18 | 0 | 0 | 0.80 |
| Monday (2nd) | 0.21 | 0.15 | 0 | 0 | 0.95 |
| Tuesday (2nd) | 0.17 | 0.12 | 0 | 0.5 | 0.57 |
Example Water Budget
Monday: Sufficient rain falls to essentially saturate the soil. This provides the grower with a good opportunity to begin monitoring the water deficit. At day’s end, the water deficit is taken as zero.
Tuesday: Mostly sunny day with highs in the low 80’s and no rain. Weather data indicates a reference ET of 0.18 inches. Crop water usage is determined by multiplying the Reference ET by the crop coefficient (0.18 in. x 0.70 = 0.13 in.). At day’s end, the water deficit is 0.13 inches.
Wednesday: A hot and sunny day with highs in the upper 80’s and no rain. Weather data indicates a reference ET of 0.23 inches. Crop water usage is 0.16 inches. At day’s end the water deficit has increased to 0.29 inches (0.13 in. + 0.16 in.).
Thursday: A cloudy, cool day with periods of rain totaling 0.03 inches. Weather data indicates a reference ET of 0.09 inches. Crop water usage is 0.06 inches (0.09 in.* 0.7 = 0.06 in.). At day’s end the water deficit is calculated to have increased to 0.32 inches (0.06 in. – 0.03 in. + 0.29 in.).
Friday: A hot and sunny day with highs in the upper 80’s and no rain. Weather data indicates a reference ET of 0.24 inches. Crop water usage is 0.17 inches (0.24 in. * 0.7 = 0.17 in). At day’s end the water deficit has increased to 0.49 inches (0.32 in. + 0.17 in.).
Saturday: Mostly sunny with highs in the mid-80’s. Weather data indicates a reference ET of 0.19 inches. Crop water usage is 0.13 inches. At day’s end the water deficit is calculated to have increased to 0.62 inches (0.49 in. + 0.13 in.).
Sunday: A hot and sunny day with highs in the low 90’s. Weather data indicates a reference ET of 0.25 inches. Crop water usage is 0.18 inches. At day’s end the water deficit has increased to 0.80 inches (0.62 in. + 0.18 in.)
Monday (2nd): A sunny day with highs in the mid-80’s. Weather data indicates a reference ET of 0.21 inches. Crop water usage is 0.15 inches. At day’s end, the water deficit has increased to 0.95 inches.
Tuesday (2nd): A variably cloudy day in the mid-70’s with no rain forecast. The grower decides to irrigate in the early morning and 0.5 inches is applied. At day’s end, crop water use is 0.12 in. and the water deficit has decreased to 0.57 inches. (0.95 in. + 0.12 in. – 0.50 in.).
Although this method will undoubtedly require tuning to a particular field, it allows for a consistent and quantifiable means of determining water availability. Below are tips for improving the reliability of the method.
1. Tensiometers
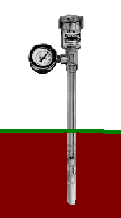
In the water budget method used above, the value of the water deficit at any given time is an estimate only. It is highly recommended that field checks be made using some form of soil moisture monitor. There are many methods for doing this, all of which vary greatly in both expenses and required expertise. For most growers, tensiometers likely offer the best return with respect to both expense and time. Tensiometers are relatively inexpensive ($50-$80) and easy to use for measuring soil water tension, or how much suction plant roots need to apply to pull water from the soil matrix. Operationally, tensiometers are air-tight water-filled tubes equipped with a porous tip on one end and a vacuum gauge on the other. (Figure 4).
The porous-tipped end is placed into the soil, and as the soil dries water is pulled out of the tensiometer through the porous tip creating a partial vacuum that is read on the gauge in centibars (cb), or equivalently, kilopascals (kP). Tensiometers should be checked daily during the growing season to assure that the water level and internal vacuum are being maintained. Aside from this, tensiometers are easy to install, use and remove. If well maintained, tensiometers can last for many years.
In order to use tensiometers most effectively, however, the texture of soil should be known. This is because different textured soils have dissimilar soil water holding capacities. Soil texture depends upon the proportions of different sized particles known as clay (diameters <0.002 mm diameter), silt (0.06-0.002 mm) and sand (0.06 to 2 mm). A textural triangle, illustrated below, is used to classify the soil into twelve textural classes (Figure 5). For example, a soil having 30% clay, 30 % sand and 40 % silt would be called a “clay loam”, while that having 10 % clay, 70 % sand and 20 % silt would be called a “sandy loam”. Soils with higher percentages of clay and silt-sized particles are referred to as finer textured soils, while those containing relatively larger percentages of sand are known as coarser soils. Soil texture is best determined by submitting a sample of soil to an approved soil testing laboratory. The Maine Soil Testing Service at the University of Maine provides particle size analysis and can be reached at Analytical Laboratory and Maine Soil Testing Service, 5722 Deering Hall Orono, ME 04469-5722 Phone: 207.581.3591, Fax: 207.581.3597 or the Analytical Lab and Maine Soil Testing Service website.
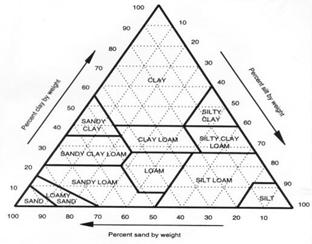
Finer textured soils will usually retain higher amounts of water than will coarser soils. On the other hand, soils having very high clay content may hold water too tightly, rendering much of it unavailable for plant use. Organic matter can act as both an adhesive to bond soil particles into aggregates, improving soil structure, and as a sort of sponge to retain water in the soil. Thus, increasing the organic matter content of any soil will generally improve its water-holding capacity. (Soil organic matter content may be determined by the Maine Soil Testing service.) In general, loamy soils, those having ample particles from all three size groups, have the best soil water holding properties. Soil texture is a fixed characteristic and cannot be easily altered, but knowledge of the texture enables better land management. For example, irrigation is generally recommended when the amount of available moisture in a soil falls below 50 %. At a tensiometer reading of 25 cb, a loamy sand soil may have already released more than half of its available water, while a sandy loam soil at the same suction reading may still be retaining over 65 % of its available water. Therefore a grower with a loamy sand soil would irrigate when the tensiometers in the field read greater than 25 cb, while a grower with a sandy loam soil could wait until the tensiometers read over 35 cb before irrigating. See Table 3 for more details on the effect of soil texture on tensiometer reading.
| Table 3: Relationships between soil suction (cb) and soil dryness | |
| Tensiometer reading (cb) | Explanation |
| 0 – 10 | All soils are saturated |
| 10 – 15 | Most soils (except sands) retain more than 80 % of available water. |
| 15 – 25 | Sandy soils need irrigating. |
| 25 – 35 | Soils coarser than fine sandy loams likely need irrigating. |
| 35 – 50 | Soils coarser than loams likely need irrigating. |
| 50 – 60 | Irrigation likely required for silt and clay soils. |
| > 60 | Very dry conditions. |
Tensiometers work best in coarse-textured soils, like those typically found in the blueberry growing areas of Maine. Dry conditions in very fine soils such as clays can cause tensiometers to fail. Thus in clay soils, electrical resistance sensors such as Watermarks are often used. These work on the same principle as tensiometers but are able to register the higher tension values possible in high clay soils.
The measurement of rainfall is also a critical element in this method and it is recommended that growers located more than 10 miles from their source of weather information purchase a rain gauge for installation in their fields (Rain gauges with up to 10-day digital memories can usually be purchased for less than $50.00).
2. Infiltration Rate
The rate by which water infiltrates a soil will also affect the rate at which the soil can be irrigated and is especially relevant at the two extremes in soil texture particle size. Sandy soils require more frequent but smaller volume irrigations than do medium textured soils such as loams. This is because sandy soils do not store as much water as do loamy soils, and thus the application of too much water to a sandy soil simply percolates out of the root zone—wasting water and leaching nutrients. Thus if the “water balance method” indicates that irrigation is required on sand or loamy sand soil, it is better to apply 0.50 inches on two consecutive days than to apply 1.0 inch on a single day. Very fine textured soils such as clays and clay loams also require more frequent applications of lower water volumes than do loamy soils. This is because infiltration rates in these heavy soils can be quite low, so any water that cannot enter the soil will pond up on the surface or runoff.
Using the information provided in this publication will help improve water use efficiency for wild blueberries, enhancing the sustainability of production in concert with the environment.
When such an approach is combined with a grower’s experience and sound judgment, significant improvements in the efficiency of irrigation are possible.
Acknowledgement
Funding for this research was made possible through a special grant from a USDA CSREES for Wild Blueberry Research as well as additional funding from the Wild Blueberry Commission of Maine. This work was a cooperative effort of scientists from the University of Maine Agricultural and Forest Experiment Station and the USDA ARS New England Plant, Soil and Water Lab. Thanks are also extended to the growers who allowed the use of their fields as study sites.
References
Allen, R.G., Periera, L.S., Raes, D., Smith, M., Crop evapotranspiration, Guidelines for computing crop water requirements – FAO Irrigation and drainage paper 56, FAO: Food and Agriculture Organization of the United Nations, Rome.
Benoit, G.R., W. J. Grant, W.J., Ismail, A.A., and Yarborough, D.E. 1984. Effect of soil moisture and fertilizer on the potential and actual yield of wild blueberries, Canadian Journal of Plant Science, 64:683-689.
Crane, J.B.1966. Irrigating wild blueberries in Proceedings of the North American Blueberry Workers Conference, W. J. Kender, and D.A. Abdalla, eds. Maine Agricultural Experiment Station Miscellaneous. Report 118. pg 46-48.
Dalton T. J., Files A., and Yarborough, D. 2003. Economic Assessment of the Returns to Irrigation Investment for Wild Blueberries. Acta Horticulturae 626:249-257, MAFES 2572.
Dalton T.J., Files A., and Yarborough, D. 2002. Investment, Ownership and Operating Costs of Supplemental Irrigation Systems for Maine Wild Blueberries. University of Maine Agricultural and Forest Experiment Station Technical Bulletin 183. 56 pgs.
Dalton T.J. and Yarborough, D.E. 2004. The economics of supplemental irrigation on wild blueberries: A stochastic cost assessment. Small Fruits Review 3:73-86, MAFES 2571.
Glass, V.M., Percival, D.C., Proctor, T.J.A. 2005. Tolerance of wild blueberry (Vaccinium angustifolium) to drought stress. I. Soil water and yield component analysis. Canadian Journal of Plant Science, 85: 911-915.
Hunt, J.F., Honeycutt, C.W., Starr, G., and Yarborough, D. 2008. Evapotranspiration rates and crop coefficients for wild blueberry (Vaccinium angustifolium), International Journal of Fruit Science, 8(4) 282-298.
Seymour, R.M., Starr, G., and Yarborough, D.E. 2004. Wild blueberry (Vaccinium angustifolium) with irrigated and rain-fed conditions. Small Fruits Review 3:45-56.
Smagula, J. and D. Yarborough 2006. The Wild Blueberry in Blueberries – For Growers, Gardeners, Promoters, N.F. Childers, and P.M. Lyrene Eds. Dr. Norman F. Childers Publications, Gainsville, FL pg. 177-181.
Starr, G., Seymour, R.M., Olday, F and Yarborough, D. 2004. Determination of evapotranspiration and drainage in wild blueberries (Vaccinium angustifolium) using weighing lysimeters. Small Fruits Review 3:273-283.
Starr, G.C. and Yarborough, D.E. 2006. Influence of vapor deposition on wild blueberry water requirements in a humid coastal climate. Acta Horticulturae. 715:323-328.
Struchtemeyer, R.A. 1953. Operation rainfall plus. University of Maine Farm Research 1: 7-9.
Struchtemeyer, R.A. 1956. For larger yields, irrigate wild blueberries. University of Maine Farm Research 4: 17-18.
Trevett, M.F. 1962. Nutrition and growth of the wild blueberry. University of Maine Agricultural Experimental Station Bulletin 605. 151pgs.
Trevett, M.F. 1967. Irrigating wild blueberries the burn year. University of Maine Farm Research 15:1-4.
Mention of trade names or commercial products in this publication is solely for the purpose of providing specific information and does not imply recommendation or endorsement by the U.S. Department of Agriculture or the University of Maine Cooperative Extension.
Information in this publication is provided purely for educational purposes. No responsibility is assumed for any problems associated with the use of products or services mentioned. No endorsement of products or companies is intended, nor is criticism of unnamed products or companies implied.
© 2009
Call 800.287.0274 (in Maine), or 207.581.3188, for information on publications and program offerings from University of Maine Cooperative Extension, or visit extension.umaine.edu.
The University of Maine is an EEO/AA employer, and does not discriminate on the grounds of race, color, religion, sex, sexual orientation, transgender status, gender expression, national origin, citizenship status, age, disability, genetic information or veteran’s status in employment, education, and all other programs and activities. The following person has been designated to handle inquiries regarding non-discrimination policies: Director of Equal Opportunity, 101 Boudreau Hall, University of Maine, Orono, ME 04469-5754, 207.581.1226, TTY 711 (Maine Relay System).