Summer 2022
Maine Summer 2022 Climate Summary
By Dr. Sean Birkel, Maine State Climatologist
Highlights
- Summer 2022 was 10th warmest (tied with 1938, 2005, 2010, 2012) and 35th wettest since 1895.
- As of the end of May, abnormal dryness or moderate drought affected only about 12% of Maine, and near-normal conditions were found elsewhere. (Update 7/15/2022: Precipitation deficits have developed over the past month such that abnormal dryness or moderate drought is now seen across about 75% of the state. The most recent drought information can be found on the Northeast Drought Early Warning System Dashboard.)
- Global 2022 MAM average temperature tied 2018 for 6th warmest since 1880, despite persistent cool conditions across the eastern Pacific in association with La Niña.
- Arctic sea ice extent at the end of May ranked 14th lowest for this time of year in the record of continuous satellite observations.
Statewide Overview
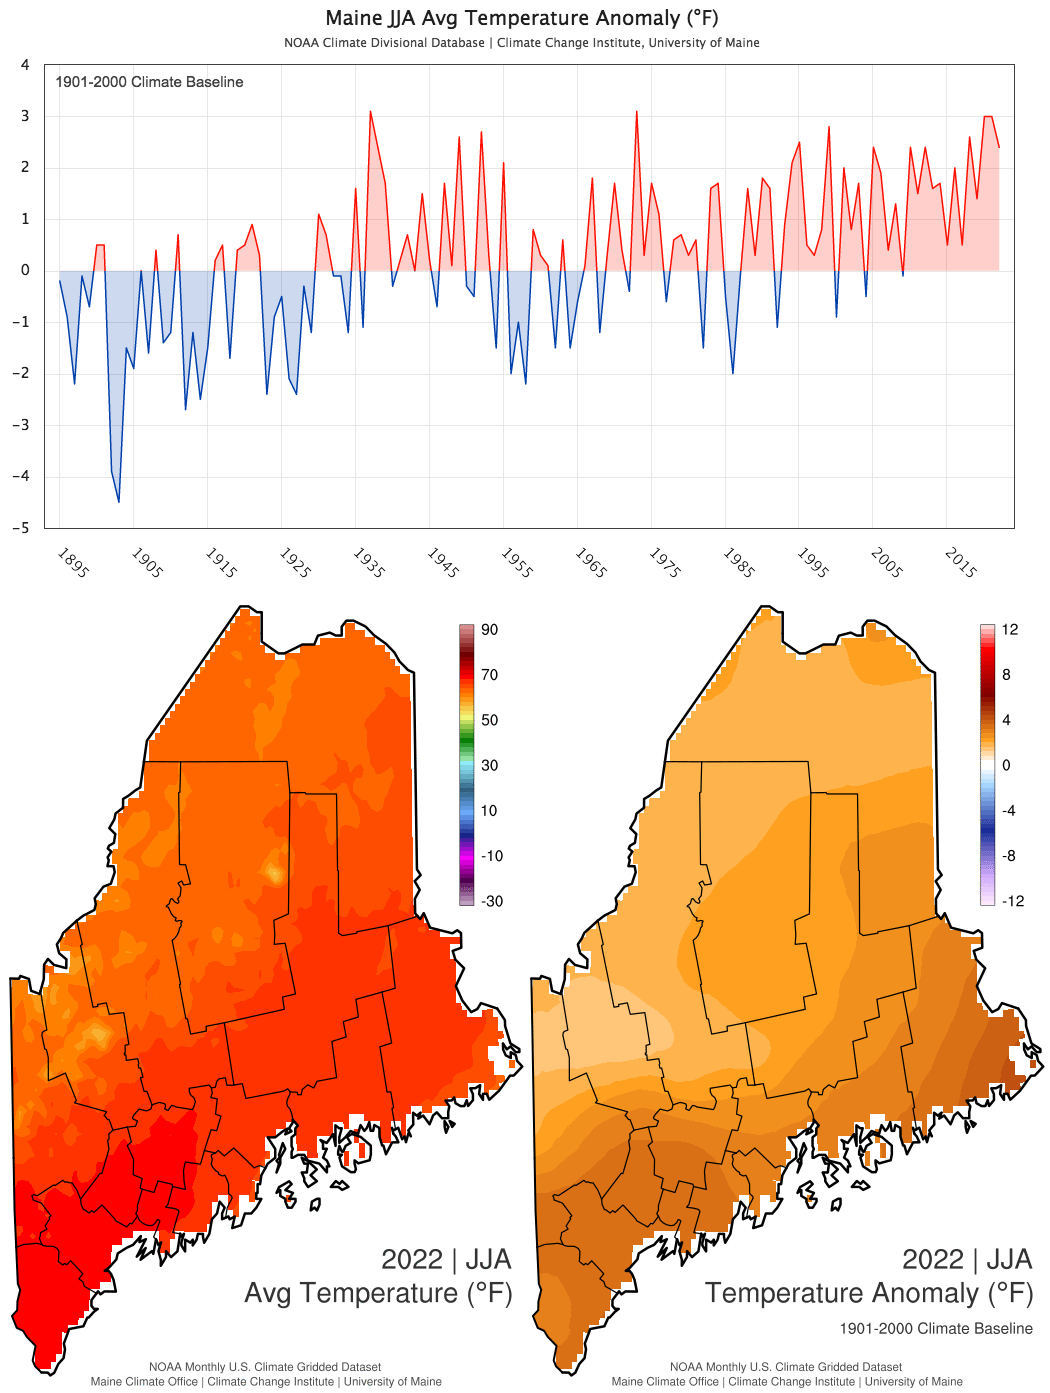
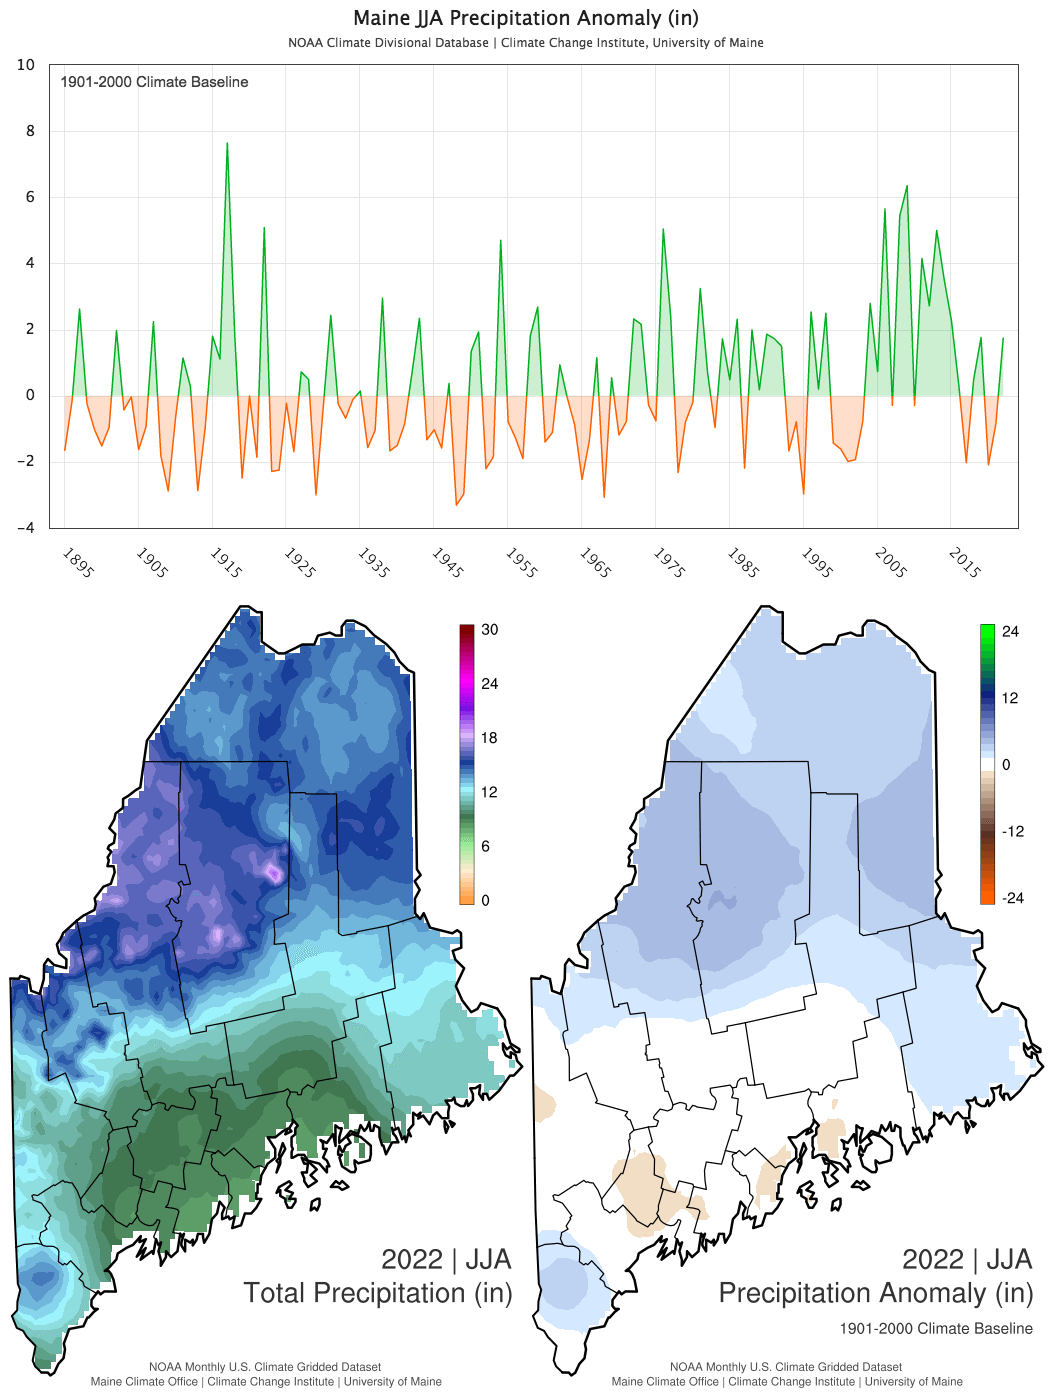
The 2022 Maine statewide climatological summer (June–July or JJA) average temperature was 65.1°F, or 10th warmest (tied with 1938, 2005, 2010, 2012) on record for the 128-year period beginning 1895 (Fig. 1). This temperature is 0.6°F cooler than for the same period in 2021, and 2.4°F above the 1901-2000 historical mean. The observed JJA total precipitation was 12.8 inches, or 35th wettest for the record period (Fig. 2). This precipitation amount is 2.6 inches more than for the same period in 2021, and 1.7 inches above the 1901-2000 historical mean.
| Temp / Anom (°F) | Rank | Precip / Anom (in) | Rank | |
|---|---|---|---|---|
| JJA | 65.1 / +2.4 | 10th warmest | 12.8 / +1.7 | 35th wettest |
| Jun | 60.2 / +0.4 | 61st warmest | 3.3 / -0.5 | 47th wettest |
| Jul | 67.8 / +2.5 | 17th warmest | 4.3 / +0.5 | 36th wettest |
| Aug | 67.4 / +4.4 | 4th warmest | 5.2 / +1.7 | 13th driest |
| Jun | Jul | Aug | JJA | |
|---|---|---|---|---|
| Highest Maximum Temperature | 1 | 9 | 18 | 28 |
| Lowest Maximum Temperature | 18 | 0 | 6 | 24 |
| Highest Minimum Temperature | 6 | 19 | 32 | 57 |
| Lowest Minimum Temperature | 8 | 5 | 0 | 13 |
| Highest Precipitation | 2 | 14 | 21 | 37 |
Another Summer of Drought
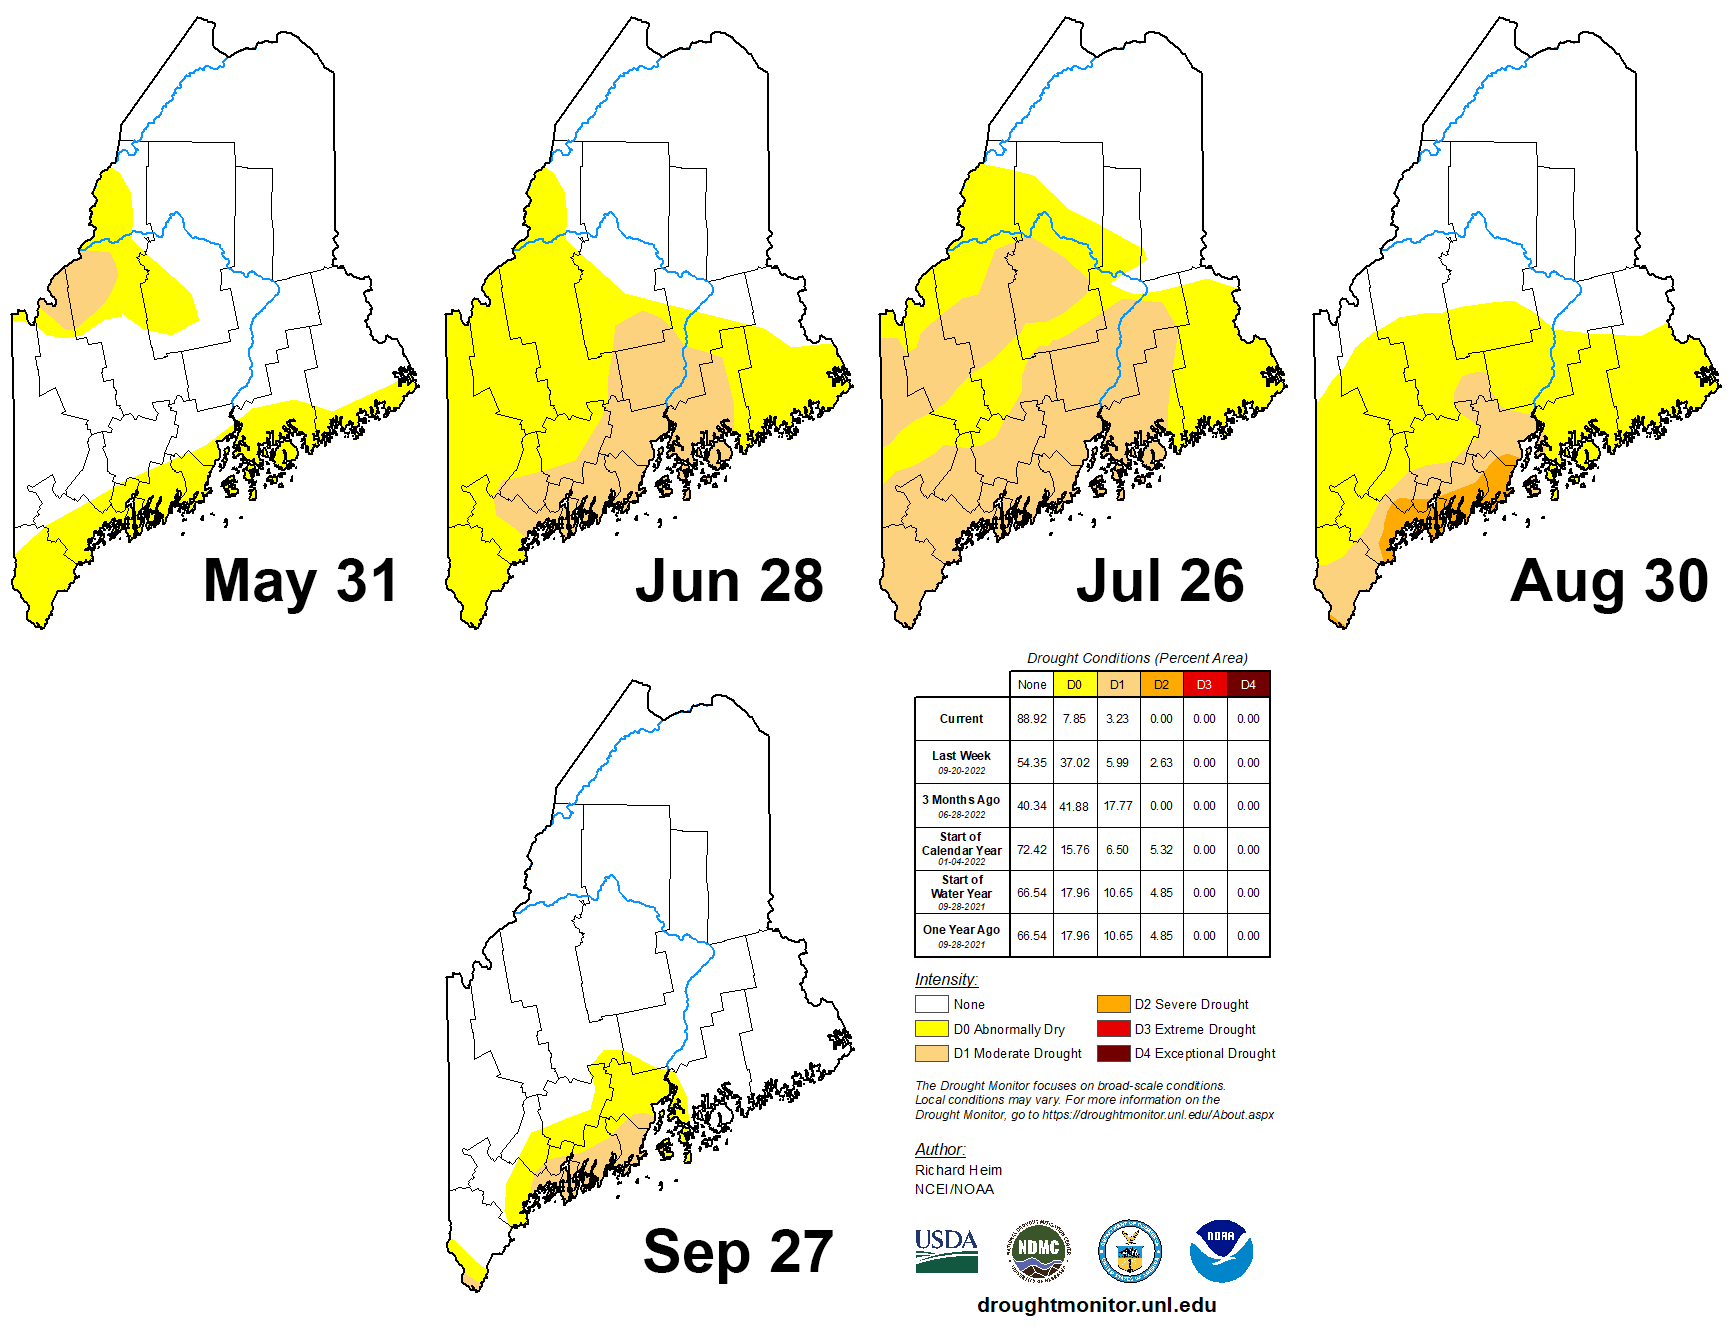
This was the third summer in a row where drought impacted Maine (Fig. 3). Dryness in the summer of 2020 was most significant, where by September the U.S. Drought Monitor (USDM) identified moderate (D1) or severe (D2) drought conditions statewide, with portions of York, Cumberland, northern Penobscot, and Aroostook County ranking in extreme (D3) drought (see more on the summer 2020 climate summary). Despite beneficial precipitation in October and December that mostly ended the drought, a warm winter and warm spring with below normal precipitation led to drought reemergence in summer 2021, this time with most impacts over western (D2) and northern (D1) portions of the state. Fall rainstorms again brought normal hydrologic conditions to most of the state, except for a band of D0 thru D2 focused in the west along the Maine/Quebec border.
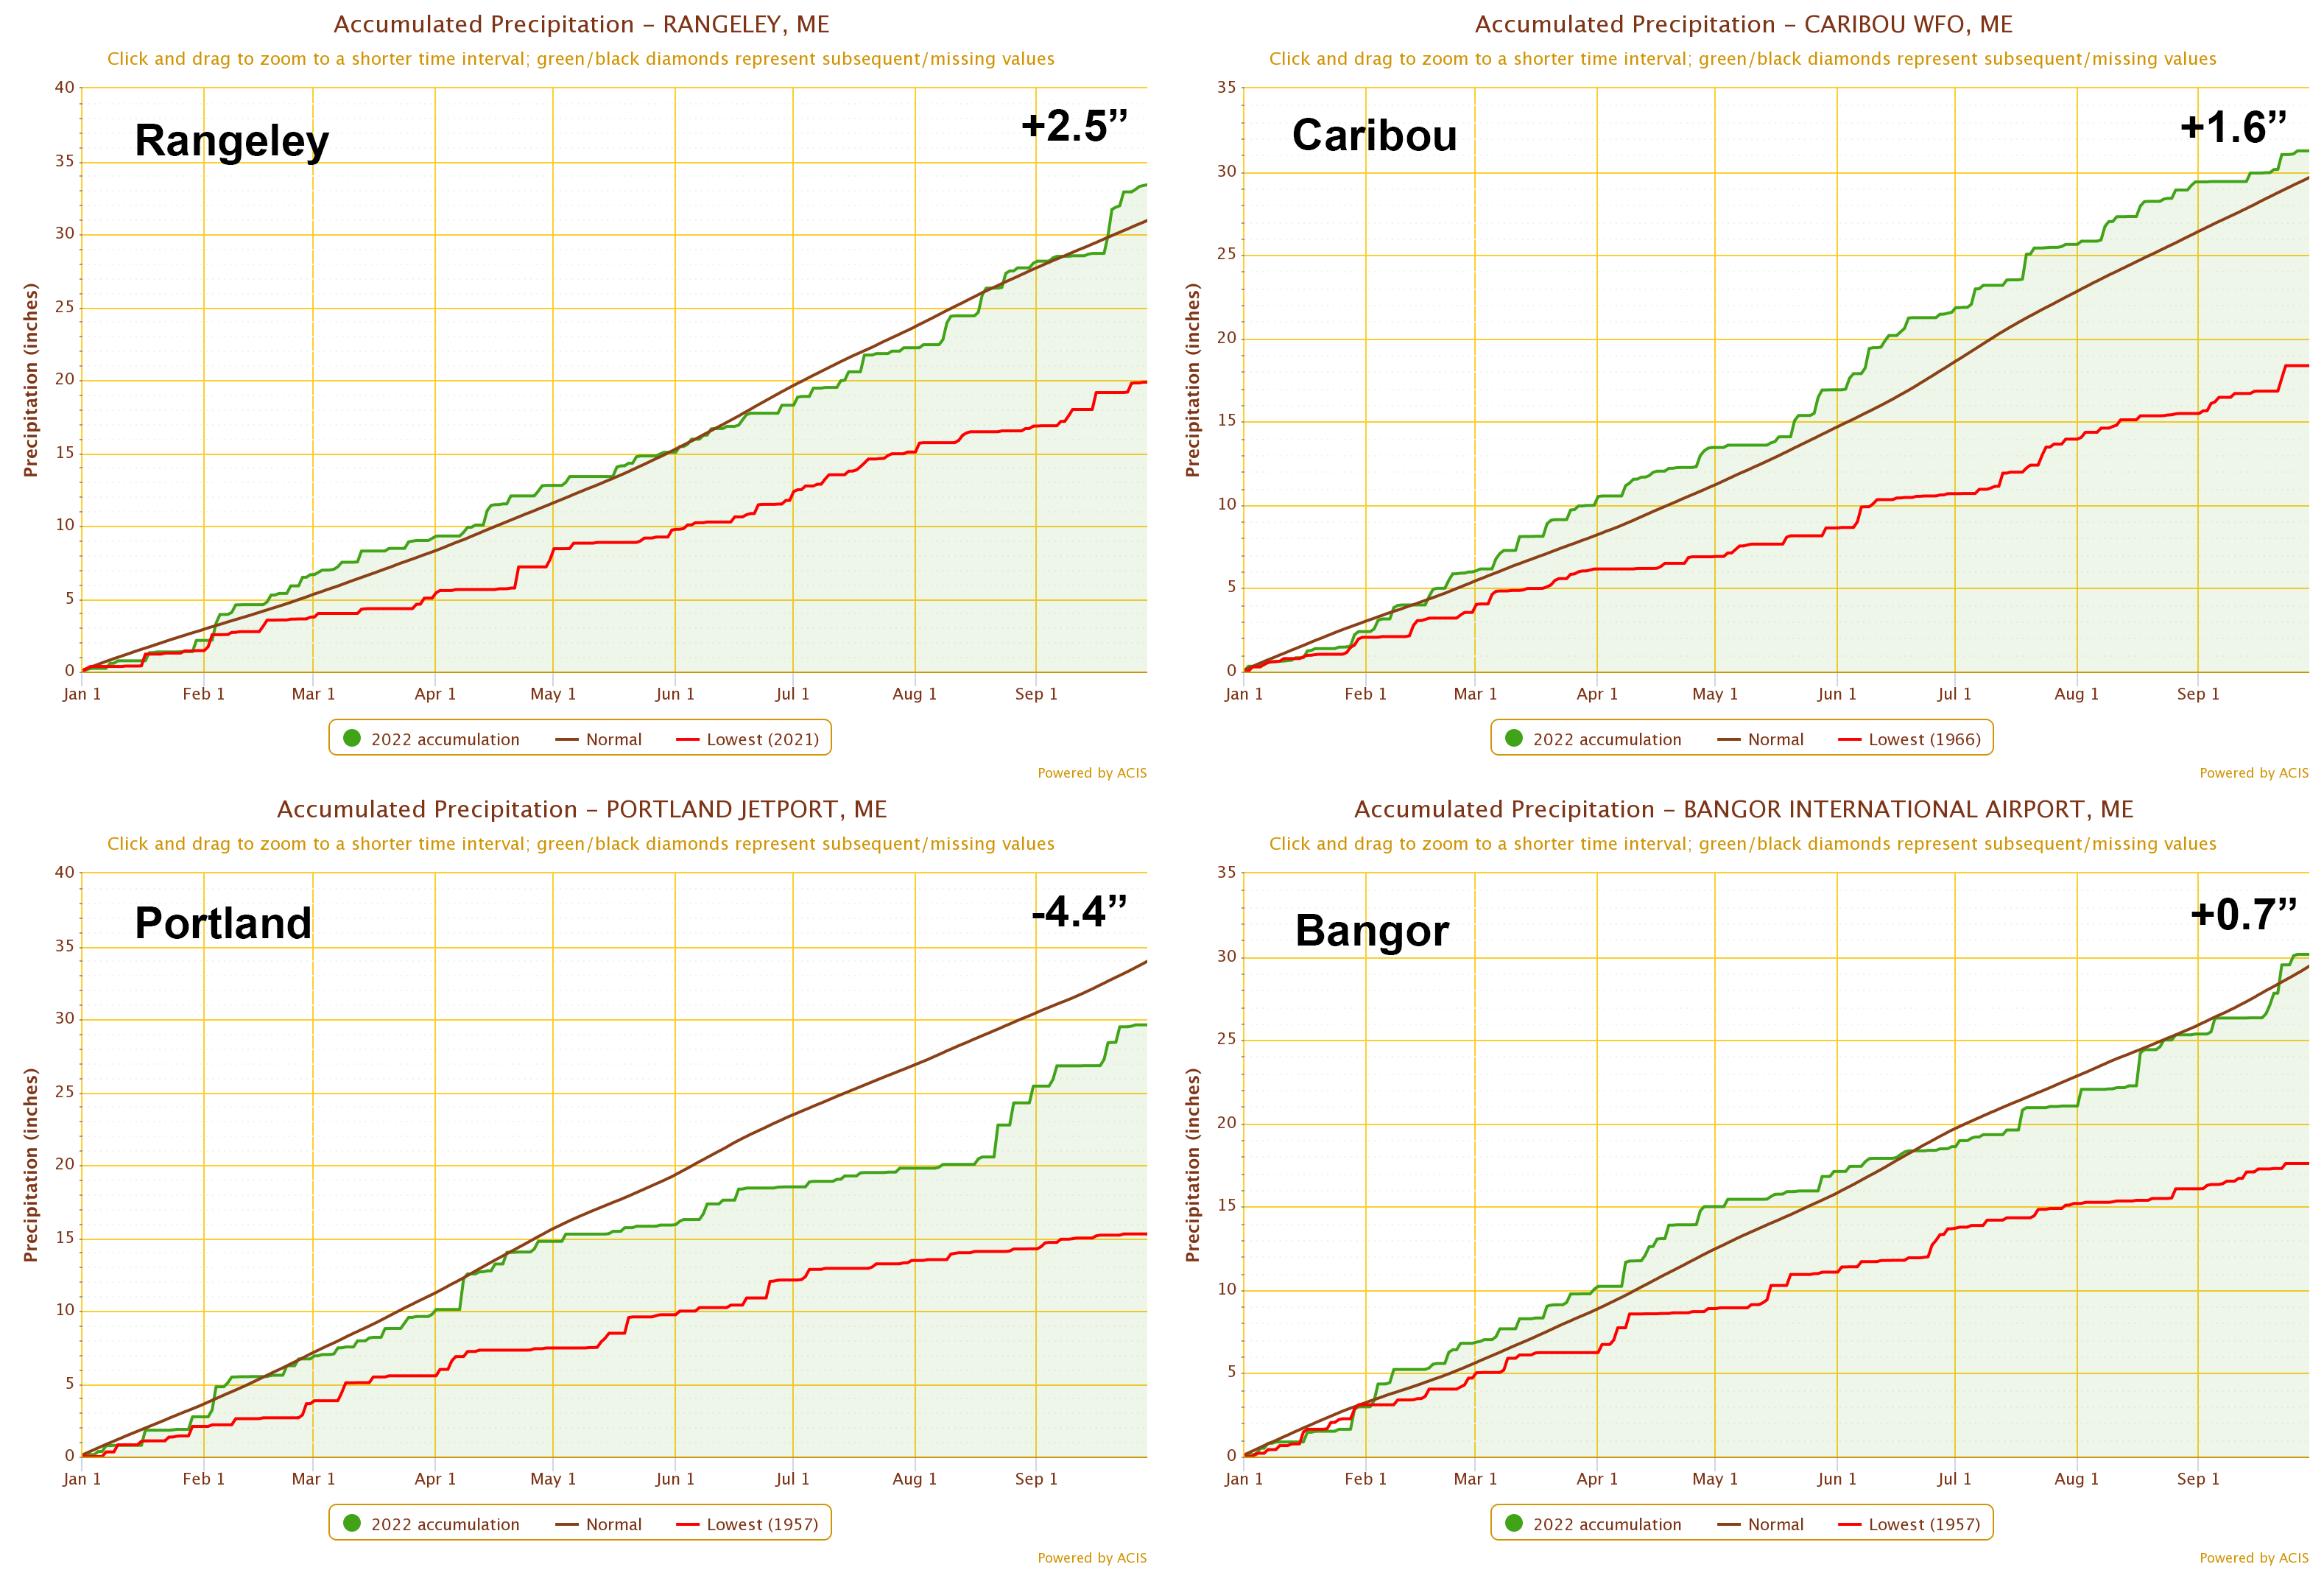
The first signs of drought in 2022 began with a warm winter/spring that brought near normal precipitation, but also early snowmelt, all of which contributed to drought signal carryover in groundwater and streamflows, especially in western Maine. Precipitation deficits then emerged across the southern half of the state in June and intensified in July to where the U.S. Drought Monitor registered the combined D0 and D1 areal extent at about 72%. By early August, D2 conditions developed across the midcoast region. Precipitation observations in Portland, for example, showed about 9” deficit mid-month (Fig. 4). The latter half of August then brought beneficial rainfall and categorical drought reduction. Soil moisture deficits and higher than normal temperatures in July and August heavily impacted agricultural production, including significant losses for wild blueberry producers. Likewise, a third consecutive summer of drought has caused more growers to consider investing in irrigation. To note, unlike the 2020 and 2021 growing seasons, northern Maine, including nearly all of Aroostook County, saw normal or above normal rainfall and was not impacted by this year’s drought.
Update 9/30/2022: Abundant rainfall ranging 2” to over 4” statewide in the past two weeks has brought significant improvements to soil moisture and streamflows, including over the midcoast region that had been most impacted by the recent drought. The USDM in turn shows categorical improvements to drought status across Maine. As of September 27, abnormal dryness (D0) and moderate drought (D1) combined are estimated to affect only about 14% of the state; severe drought (D2) has been removed. Seven-day streamflow measurements at gauges across the state all show normal or above-normal conditions. While this is good news, ground water levels at some measurements sites in southern and western Maine show below normal conditions, and full recovery requires more rainfall and will take some time. The current forecast shows a dry weather pattern for the next several days. Up-to-date precipitation and drought information can be found on the Northeast Drought Early Warning System Dashboard.
Looking Farther Afield
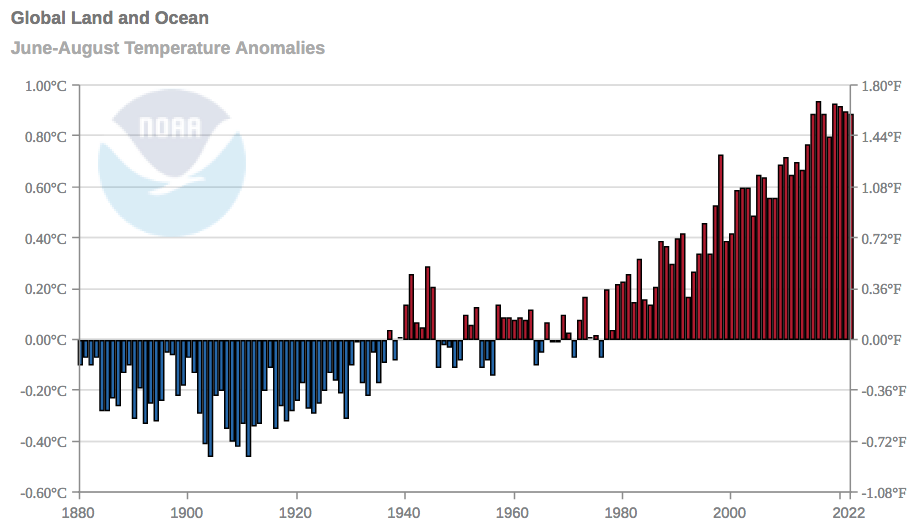
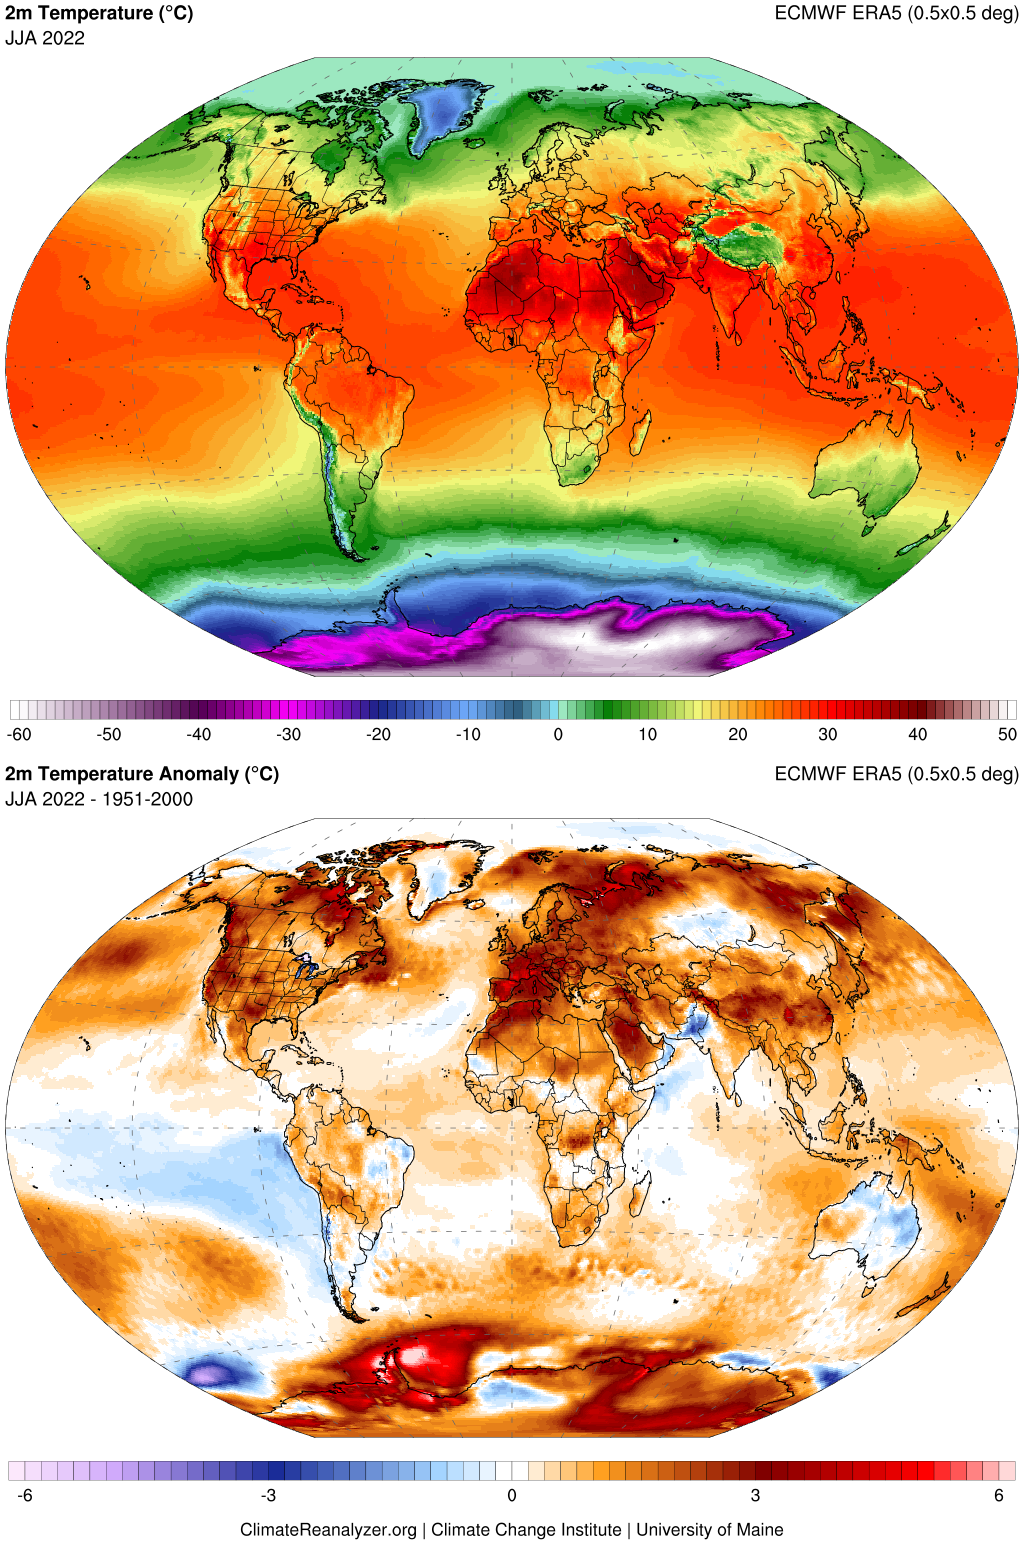
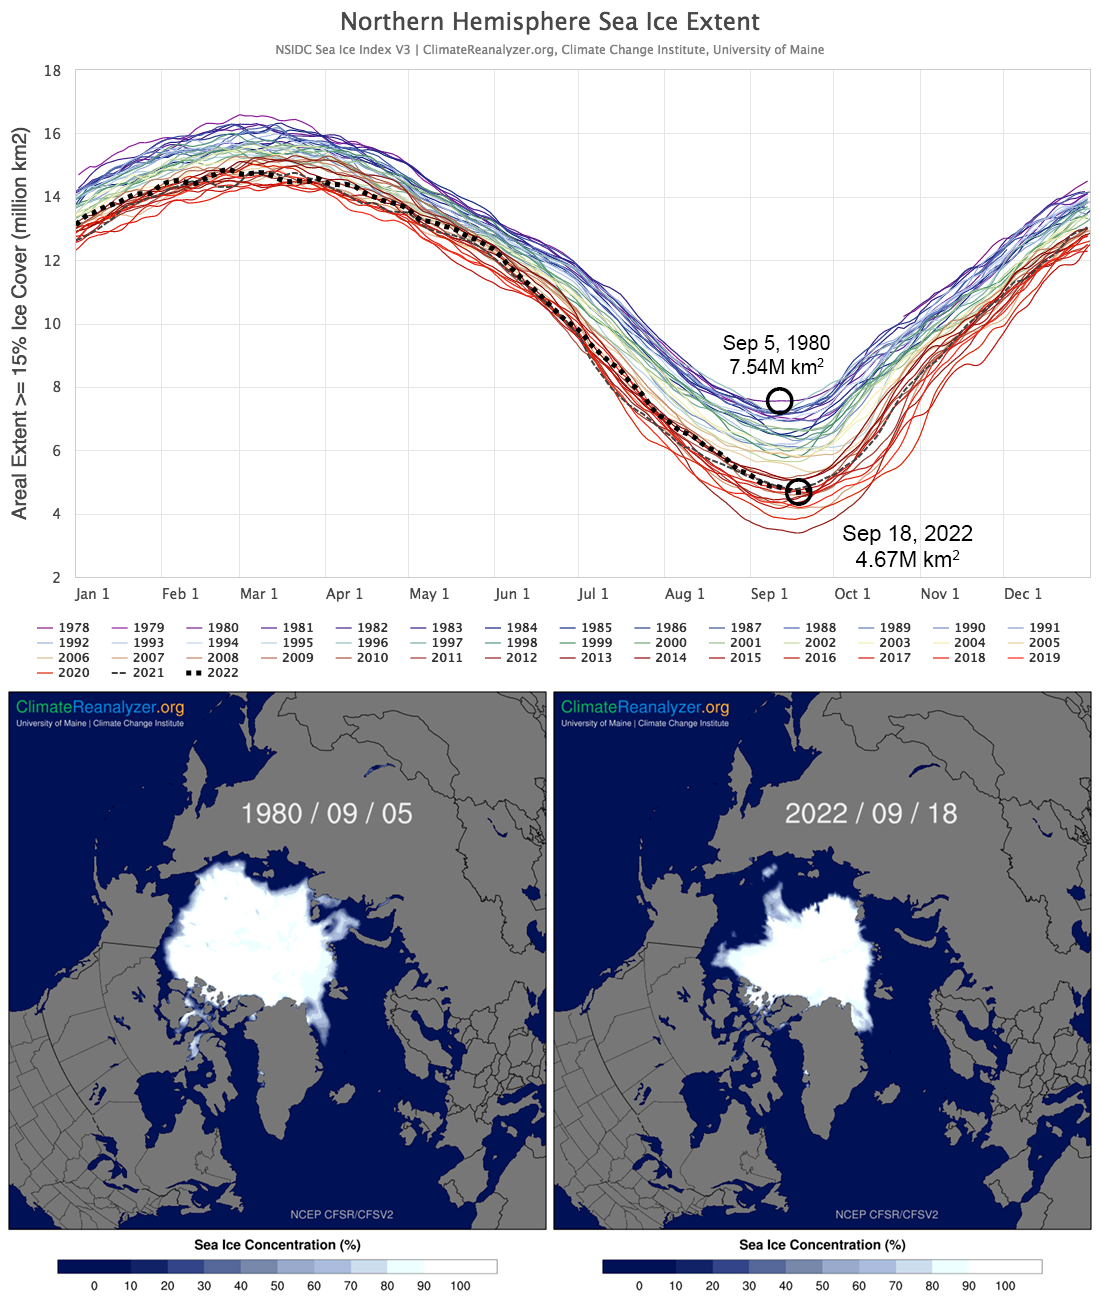
The 2022 JJA global average near-surface temperature ties 2015 and 2017 as 5th warmest on record since 1880 (Fig. 5). Maps of the global distribution of JJA temperature show particularly strong warm anomalies over the Antarctic Peninsula, Europe and northwest Africa, the Hudson Bay region, and the high latitude eastern North Atlantic (Fig. 6). The expansive area of anomalous cool temperature across the equatorial Pacific and off South America is associated with La Niña, which is forecast to affect global weather for a third year in a row – a rare “triple dip”. Despite the persistence of La Niña, global mean temperatures are historically high. In the Arctic, the end-of-summer minimum sea ice extent occurred around September 18th at 4.67 million km2, ranking 12th lowest since continuous satellite observations began in late 1978 (Fig. 7).
Maine historical climate data and current weather forecasts are available on the Maine Climate Office website. For U.S. and global climate and weather data, visit Climate Reanalyzer. The Maine Climate Office and Climate Reanalyzer are developed and maintained by Dr. Sean Birkel, the Maine State Climatologist and Assistant Extension Professor at the Climate Change Institute and Cooperative Extension at the University of Maine.