Activity 2: Turbidity
Note: “Secchi” is pronounced “seh-key”.
Note: All links are provided purely for educational purposes. No responsibility is assumed for any content on the linked site(s).
Description
- Learn about turbidity, a water quality characteristic.
- Model ways to change turbidity.
- Use a turbidity tube to measure turbidity.
- Change aquaculture project as needed.
Learning Targets
- Understand what turbidity is.
- Understand how turbidity can affect aquatic plants and animals.
- Observe changes in turbidity.
- Practice measuring turbidity.
Length
60-80 minutes.
Materials
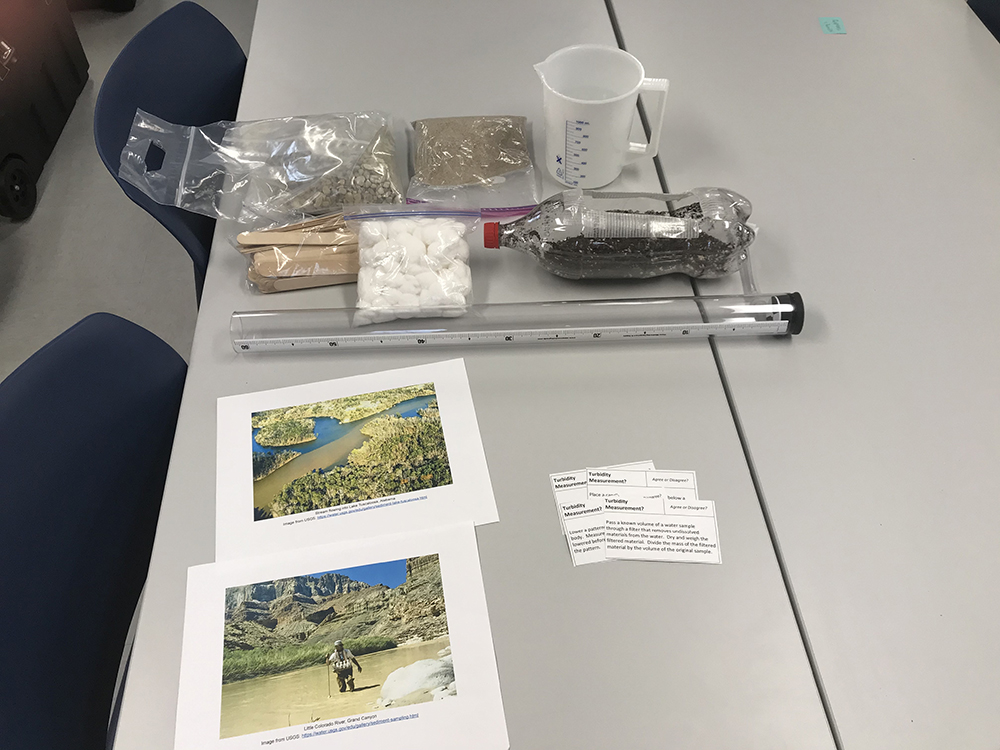
Included in this kit are:
- 7 sets of Turbidity Measurement Cards
- 7 sets of Turbidity Pictures
- 7 Plastic beakers
- 1 bag Cotton balls
- 50-100 Craft sticks
- 1 Aquarium net
- 1 Watering can or pitcher
- 1 Secchi disc (1 per kit)
- 7 Turbidity tubes
Not included but also needed to conduct activities:
- Recycled plastic bottles (1 per 3-4 youth)
- Potting soil (1 bag per kit)
- Sand
- Gravel
- Tap water
- Scissors and/or Exacto knife to cut bottles
- Duct tape to cover cut edges of bottles
- Evaluations (choose one or more of the following):
- Exit ticket (1 per youth)
- KLEWS chart (1 per youth)
- Journal (1 per youth)
- Optional (not provided):
- Clay (optional)
- Organic material (e.g. leaves, grass, branches) (optional)
- Live plants (optional)
- Food coloring (optional)
- Glitter (optional)
Vocabulary
- Turbidity: “Optical determination of water clarity.”1
- Turbidity includes the color and cloudiness of the water. Common descriptions: cloudy, murky, hazy, muddy, opaque, clear, colored
- Dissolved and undissolved materials affect turbidity
- Particles that settle out of water do not affect turbidity
- Turbidity has to do with how light is scattered when it hits the water. (Transparency is how much light passes through the water, which is the opposite of turbidity.)
- Water clarity: How deep light can penetrate in water.
1Fundamentals of Environmental Measures. Turbidity, Total Suspended Solids & Water Clarity
Background Information for Facilitators
Turbidity Videos:
- Turbidity (YouTube) University of Wisconsin Extension (length: 5:19)
- Summary: Good definition of turbidity, what changes turbidity, how turbidity affects plants and animals, kinds of turbidity tubes and how to use them. An additional resource you may find useful is this factsheet: Transparency, A Water Clarity Measure (PDF)
- Using the Secchi Disk (YouTube) BlueThumbOK (length: 2:47, note: can stop at 2:10 because the rest is a summary of other videos we have not asked you to watch)
- Summary: How to use a Secchi disk
Preparation
- Gather all the necessary materials.
- Review the University of Maine video, Activity 2: Turbidity (YouTube), demonstrating this activity:
No endorsement is implied nor is discrimination intended against similar products or services.
- Recommended: cut bottles ahead of time and cover cut edges with duct tape. Alternative: have youth cut bottles using scissors, not Exacto knives.
- Put a layer (about two finger-widths) of potting soil in each bottle.
- Decide which evaluation method you will use:
- Supplemental Resource #5: How to Use KLEWS, Journals, and Exit Tickets (PDF)
- Exit Ticket: Download, print out, and cut Exit Tickets ahead of time.
- KLEWS: print out KLEWS charts ahead of time.
Example KLEWS charts (rows and columns) are available to download and print:
- Supplemental Resource #5: How to Use KLEWS, Journals, and Exit Tickets (PDF)
Procedure
Before you begin, review the discussion norms that youth agreed to during the Introduction to Aquaculture activity. These norms are intended to help youth have productive, respectful conversations. Reminding youth of their norms helps youth to remember to follow their norms.
Engage (5-10 minutes)
What is turbidity?
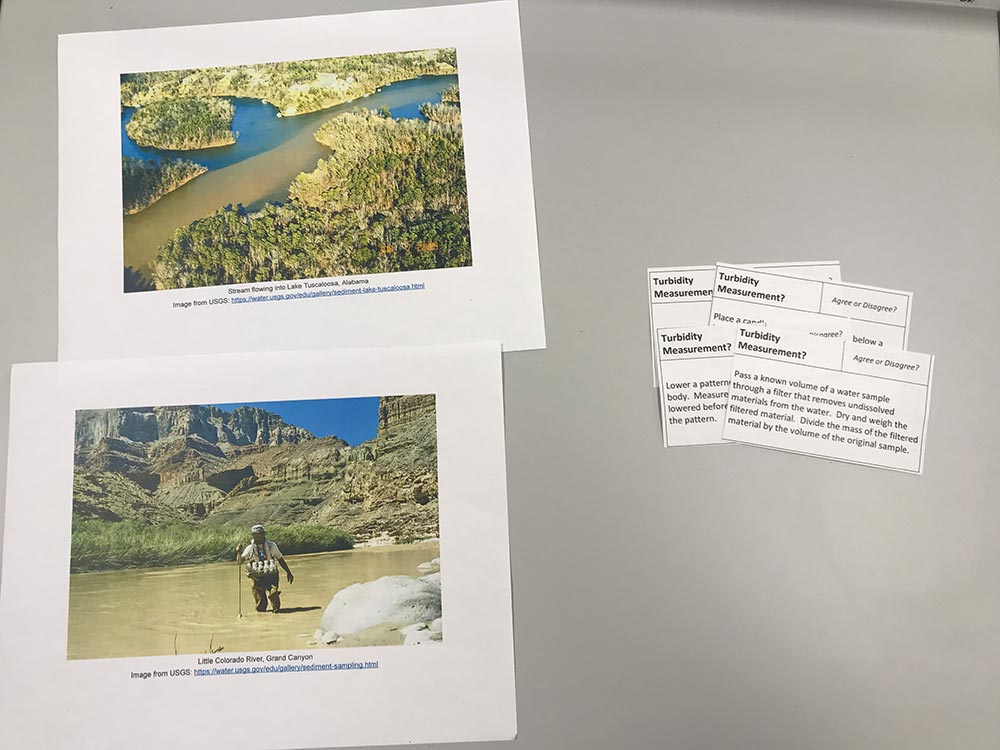
As a group, discuss and agree on a definition of ‘turbidity’. Use provided turbidity pictures to help develop ideas of what turbidity is.
- KLEWS: have youth fill out K column prior to the discussion. Following discussion, write the definition of turbidity in the S column.
- Journals: have youth brainstorm about turbidity on page 10 before and during the discussion. Following discussion, write the definition of turbidity on page 9.
If needed, use the following questions to prompt discussion:
- What do you see in these pictures?
- How do you describe the water in these pictures?
- This characteristic is called ‘turbidity’. Let’s agree on a definition of turbidity. (Students should eventually agree on a definition that includes the color and cloudiness of water.)
- Why does the water in these pictures look this way?
Explain (15-20 minutes)
What changes turbidity?
As a group, discuss how turbidity can change.
Ask youth: “What can change turbidity?”
- KLEWS: brainstorm in the K column.
- Journals: have youth brainstorm on page 10.
Keep asking questions until youth have brought up and agreed on (most/some of) the following:
- Rain (weather)
- Heat (evaporation)
- Soil runoff (e.g. farms)
- Rock type (what minerals are in the nearby rocks)
- Currents (water velocity and flow, e.g. estuary)
- Tides
- Wind (greater effect on shallow waters, where wind can whip up waves)
- Point source pollution (e.g. factories, farms)
- Change in land use (e.g. disrupting soil or changing vegetation)
- Fun fact: Salt ions bond to suspended solids, making the material heavier and more likely to settle out of the water column, thus increasing water clarity and decreasing turbidity.
How does turbidity affect aquatic life?
As a group, discuss how turbidity affects aqueous plants and animals.
Ask youth: “How can turbidity impact plants and animals living in water?”
- KLEWS: brainstorm in the K column.
- Journals: have youth brainstorm on page 10.
Keep asking questions until youth have brought up and agreed on (most of) the following:
- Amount of sunlight (plants)
- Amount of food (filter feeders)
- Suffocation (bottom dwellers) due to silt buildup
- Fish
- Eyesight (ability to find food, or to see predators)
- Clog gills
- Affect the growth rate
- More susceptible to diseases
- Water temperature (suspended solids absorb heat, transfer it to water, increasing water temperature and sometimes thermal layers (thermocline) in the water column)
- Pollutants and microorganisms can attach to suspended solids, making water unsafe to drink/grown in
Measuring Turbidity
Use the Turbidity Measurement Cards to learn how to measure turbidity.
- Journals: use pages 9 and 10.
- Give groups of 2-4 youth a set of Turbidity Measurement Cards.
- Give youth 5 to 10 minutes to read cards, discuss, and decide which cards describe valid ways to measure turbidity.
- Bring youth back to a whole group and go over the answers to the Turbidity Measurement Cards.
Explore: Soil Erosion Model (30 minutes)
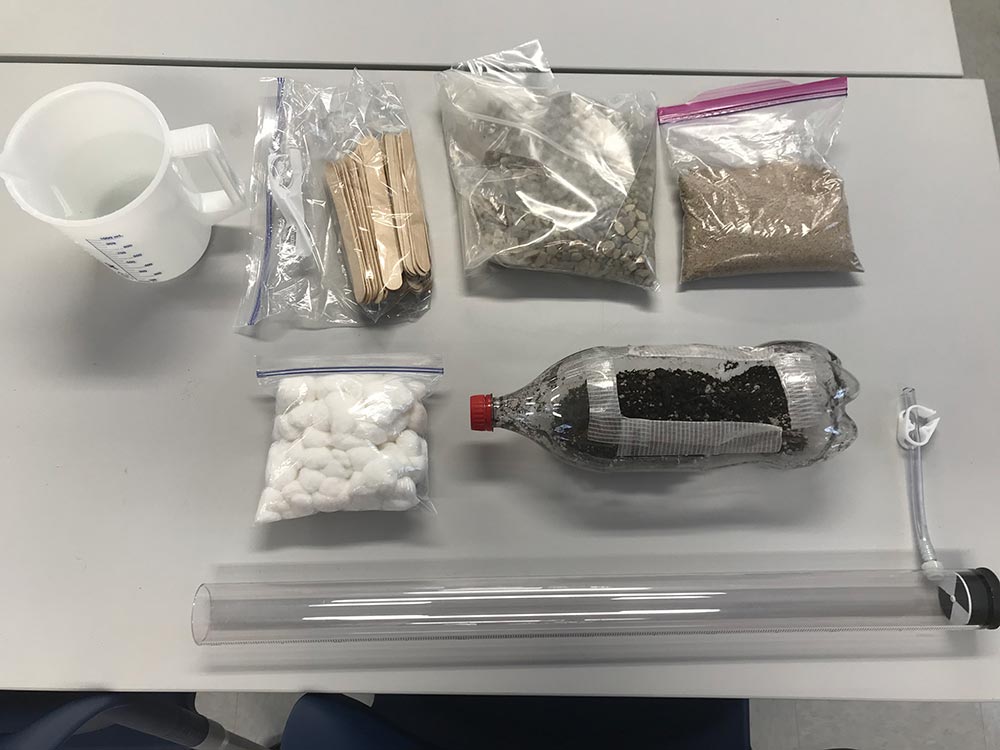
- Demonstrate soil erosion:
- Fill the bottom of a bottle with potting soil.
- Run water through the bottle into the turbidity tube.
- Continue to run water through the tube until you are no longer able to see the black and white disc at the bottom of the turbidity tube.
- To measure the turbidity of the model, record the water level using the centimeter ruler on the side of the tube.
- Explain to the youth that each group will be building a filter model. Each group will have the chance to run water through its soil erosion model with its filter. The goal is to build the most effective filter that results in the clearest water.
- Go over available materials
- Give youth sheet to design their model
- Journals: have youth brainstorm idea on page 10
- Youth must show and describe the model design in order to get materials to make their model
- Have youth make their models, run rainwater through to see the resulting turbidity
- Journals: record results on page 10
- If time allows, complete a second iteration to improve the model.
Extend: Aquaculture Project (15-20 minutes)
Use Supplemental Resource #4: Researching Species and Water Bodies (PDF) to help youth with their research.
Find turbidity of target species and water body
Find the turbidity range of your target species.
- Journals: record water body turbidity on page 12.
Measure the turbidity of your sampled water body.
- Journals: record water body turbidity on page 12.
Compare water turbidity to species turbidity
Does your chosen species match the turbidity of your chosen water body?
- Journals: record species turbidity on page 11.
Would you like to change species or water body? (Do so if needed.)
Evaluate (Assessment) (5 minutes)
Approximately 5 minutes before the end of the session, have youth finish up what they are doing, help clean up the materials, and do one of the following evaluation methods:
Have youth complete and turn in an exit ticket.
Have youth finish and turn in KLEWS chart.
After completing this activity youth should have the following in their journals:
- Definition of turbidity (page 9)
- Aquaculture project:
- Turbidity ranges for their target species (page 11)
- Turbidity data for their target water bodies (page 12)
- Species that match the water bodies
Credits
Fondriest Environmental, Inc. “Turbidity, Total Suspended Solids, and Water Clarity”, Fundamentals of Environmental Measurements. June 13, 2014.