Activity 4: Temperature
Description
- Learn about temperature, a water quality characteristic.
- Learn about density, a water quality characteristic.
- Use a density box to model how temperature affects density.
- Use Tuva to perform some data analyses.
- Change the aquaculture project as needed.
Learning Targets
- Identify potential causes for changes in water temperature.
- Describe how water temperature affects aquatic species.
Length
60-80 minutes.
Materials
Included in this kit:
- 7 Density Boxes
- Food Coloring (2 colors per kit, min)
- 1 Jar Petroleum Jelly
- 2 Water pitchers
Not included but also needed to conduct activities:
- Tap water
- Computers with internet access for Tuva activities (1 per youth is ideal, 2 per 3-4 youth at a minimum)
- Evaluations (choose one or more of the following):
- Exit Ticket (1 for each youth)
- KLEWS Chart (1 for each youth)
- Journals (1 for each youth)
Vocabulary
- Temperature: Measurement of the amount of thermal (heat) energy in the material.
- Thermal energy (or heat): The result of the vibration of atoms. More vibrations = more thermal energy.
- Thermocline: Rapid transition in water temperature with depth, e.g. from warmer water to colder water.
- Density: is a measurement comparing the amount of matter an object has to its volume. An object with more matter in a certain volume has a higher density. Density is found by dividing the mass of an object by its volume.
Background Information for Facilitators
Note: All links are provided purely for educational purposes. No responsibility is assumed for any content on the linked site(s).
Heat videos:
- Bill Nye the Science Guy on Heat (Full Clip) (YouTube), Bill Nye (length: 2:05)
- Summary: Heat vs. temperature, movement of molecules, something cold but large can have more heat energy than something hot but small
Heat Transfer (PBS)
- Summary: Heat vs. temperature, movement of molecules, something cold but large can have more heat energy than something hot but small
Optional Temperature and Density videos:
Note: these videos are also recommended in the Salinity Facilitator Guide
- Making waves: The power of concentration gradients – Sasha Wright (YouTube) by TED-Ed (length: 5:19)
- This video deals with both salinity and temperature, and how they affect the density
- Summary: Thermohaline circulation, concentration gradient, equilibrium, how temperature affects density, how salinity affects density, how density differences can lead to a current
Heat vs. Temperature
Temperature and heat are not the same things. Heat (or thermal energy) refers to the kinetic energy (or movement) of particles in a system (or object). Temperature is the measurement of the average amount of heat in a system (or object).
For example, compare a pot of boiling water to a glacier. The pot of boiling water has a higher temperature or average heat of the particles in the pot. However, the glacier has more thermal energy overall, since a glacier has more mass and therefore many more particles than a pot of water.
Preparation
- Review this University of Maine video, Activity 4: Temperature (YouTube) demonstrating this activity:
No endorsement is implied nor is discrimination intended against similar products or services.
- Gather all the necessary materials.
- Check that you have easy access to hot and cold tap water. ‘Hot’ and ‘cold’ water from a sink is generally a large enough temperature difference for this activity to work properly.
-
- Decide which evaluation method you will use:
- Supplemental Resource #5: How to Use KLEWS, Journals, and Exit Tickets (PDF)
- Exit Ticket: Download, print out, and cut Exit Tickets ahead of time.
- KLEWS: print out KLEWS charts ahead of time.
Example KLEWS charts (rows and columns) are available to download and print:
- Supplemental Resource #5: How to Use KLEWS, Journals, and Exit Tickets (PDF)
- Decide which evaluation method you will use:
-
Procedure
Before you begin, review the discussion norms that youth agreed to during the Introduction to Aquaculture activity. These norms are intended to help youth have productive, respectful conversations. Reminding youth of their norms helps youth to remember to follow their norms.
Engage (10-20 minutes)
Introduction to Temperature
As a group, review and agree upon a definition of ‘temperature’ (including how it is a measurement of heat energy).
- KLEWS: use the K column. Following discussion, record definitions in the S column.
- Journals: brainstorm on page 18. Following discussion, record definitions of temperature and heat on page 17.
If needed, use the following questions to prompt discussion:
- What does ‘temperature’ measure?
- What does ‘heat’ mean?
Information that may be useful during discussions:
- If/when youth bring up ‘hot’ and ‘cold’, give an example of how these are relative terms: e.g. a pool with water that is at 65*F in the summer feels cold, while an air temperature of 65*F feels wonderfully warm in the spring.
- Review temperature units if needed (Tuva data uses metric units, as does most of the world). Full description of temperature units:
- ℉ = degrees Fahrenheit = English System1 temperature unit, commonly used in the US (and a few other tiny countries that still use the English System).
- 0℉ is approximately the freezing point of saltwater (average ocean water) … or the temperature of a mixture of water, salt, and ice … (the stories vary)
- 32℉ = the freezing point of water
- 100℉ was supposed to be the body temperature of the average human, but the scientist was a bit off
- 212℉ = the boiling point of water.
- ℃ = degrees Celsius (aka degrees centigrade) = SI (aka metric) temperature unit used by the vast majority of the world.
- 0℃ = freezing point of water
- 100℃ = boiling point of water
- K = Kelvin (note: there is no “degree” to go along with Kelvin, it’s just Kelvin) = SI (aka metric) absolute temperature unit used by the vast majority of the world. Absolute temperature means that there are no negative values on the Kelvin scale. The Kelvin scale has the same degree size as the Celsius scale.
- 0K = absolute zero, the coldest temperature possible
- 273.15K = freezing point of water
- 373.15K = boiling point of water
- °R = degree Rankine = the English System version of the Kelvin scale. The Rankine scale has the same degree size as the Fahrenheit scale. The Rankine scale is an absolute temperature scale, meaning that there are no negative values on the Rankine scale.
- 0°R = absolute zero, the coldest temperature possible
- 459.67°R = 0℉ = freezing point of brine
- 491.67°R = 32℉ = 0℃ = freezing point of water
- 671.64°R = 212℉ = 100℃ = boiling point of water
- ℉ = degrees Fahrenheit = English System1 temperature unit, commonly used in the US (and a few other tiny countries that still use the English System).
1Technically the English System was replaced by the Imperial System in 1825. This is after the US became independent from the British Empire, so the US did not make the switch. What is used now in the US is United States Customary Units, which is based on the English System, not the Imperial System. The Imperial System is actually slightly different from the US Customary System, despite having units with the same names. In conclusion, metric is always the best choice.
| Temperature | Fahrenheit | Celsius | Kelvin | Rankine |
|---|---|---|---|---|
| Absolute Zero | -459.67 ℉ | -273.15 ℃ | 0 K | 0 °R |
| Fahrenheit’s ice/salt mix | 0 ℉ | -17.78 ℃ | 255.37 K | 459.67 °R |
| Water Freezes / Ice Melts | 32 ℉ | 0 ℃ | 273.15 K | 491.67 °R |
| Average Human Body2 | 98 ℉ | 37 ℃ | 310 K | 558 °R |
| Water Boils / Steam Condenses | 212 ℉ | 100 ℃ | 373.15 K | 671.64 °R |
| Flashover Occurs | 932 ℉ | 500 ℃ | 773.15 K | 1,391.67 °R |
| To Fahrenheit | To Celsius | To Kelvin | To Rankine | |
|---|---|---|---|---|
| From Fahrenheit | — | ℃ = (℉ – 32)(5/9) | Convert to ℃ first … | °R = ℉ + 459.67 |
| From Celsius | ℉ = (℃)(9/5) + 32 | — | K = ℃ + 273.15 | You’re already in metric, use Kelvin instead! |
| From Kelvin | Convince people to use metric units. | ℃ = K – 273.15 | — | °R = (K)(9/5) |
| From Rankine | ℉ = °R – 459.67 | — | K = (°R)(5/9) | — |
2 There are variations in the average human body temperature. Emphasis is on “average”.
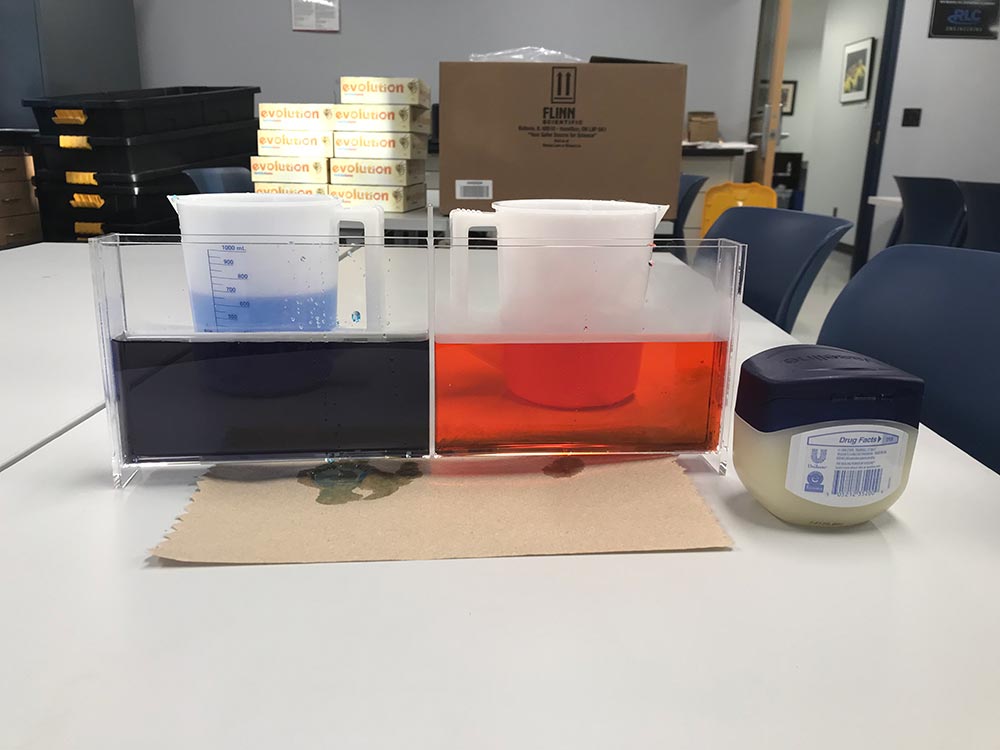
Density Box Activity
Use a density box to demonstrate how temperature affects water, specifically by forming the thermocline. *Note: Density boxes are fragile! Make sure to be careful when using them so they don’t get cracked. We want to prevent leaks to make sure the activity works.
Here are the steps:
- Each group needs a density box.
- Optional: coat the edges of the plastic divider with petroleum jelly – this makes the density box chambers watertight.
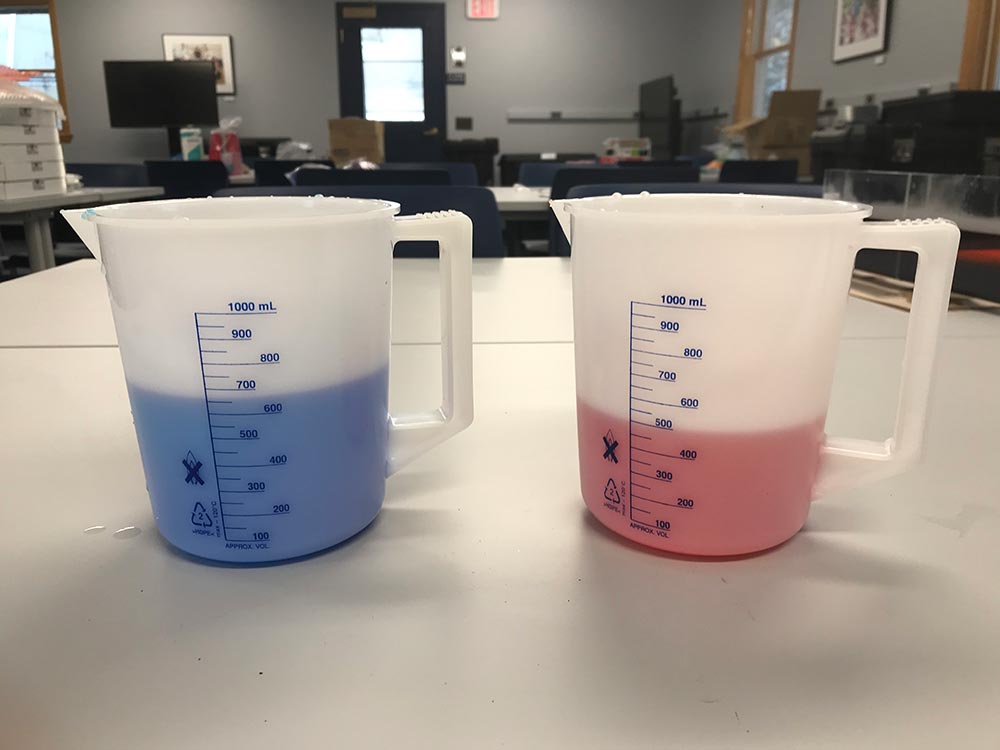
- Prepare one pitcher of ‘cold’ water and one pitcher of ‘hot’ water (cold and hot tap water are enough of a temperature difference for this to work, but you can use refrigerated water and/or tea-kettle water if you’d like).
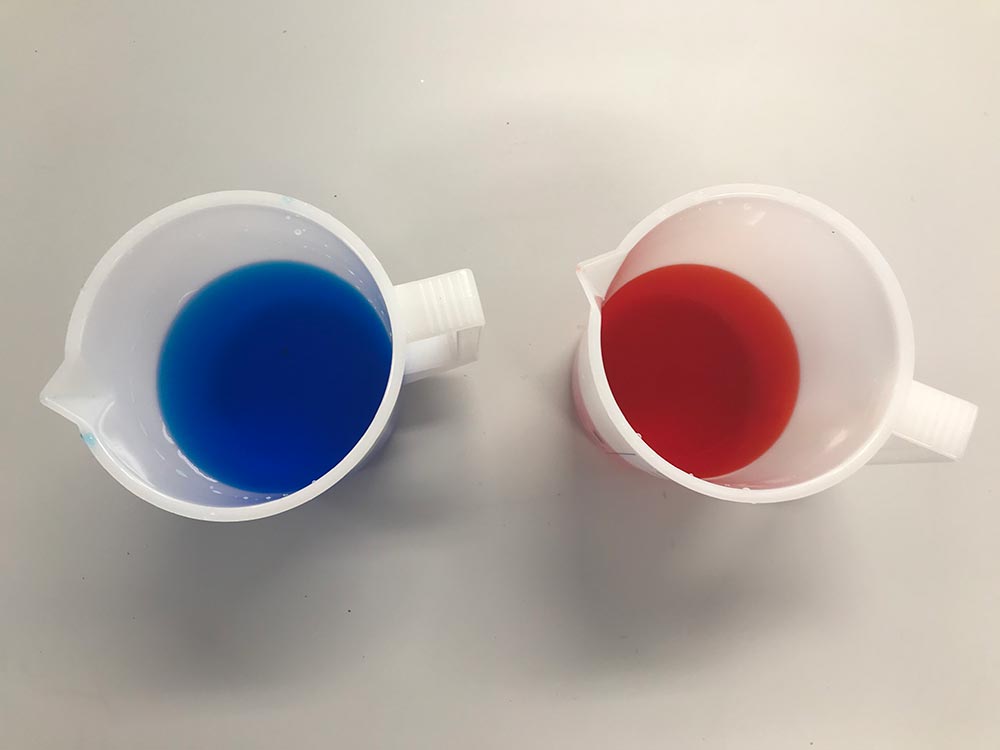
- Add 3-4 drops of blue food coloring to the ‘cold’ water, swirl to mix.
- Add 3-4 drops of red food coloring to the ‘hot’ water, swirl to mix.
- Pour hot water into one side of each density box.
- Pour cold water into the other side of each density box.
- Once all groups have hot and cold water in their density box but before removing the plastic divider:
- Ask youth to predict what will happen after the plastic divider is removed.
- Journals: record observations on page 18 – at this point they should have the starting condition (before the divider is removed) and their prediction about what will happen.
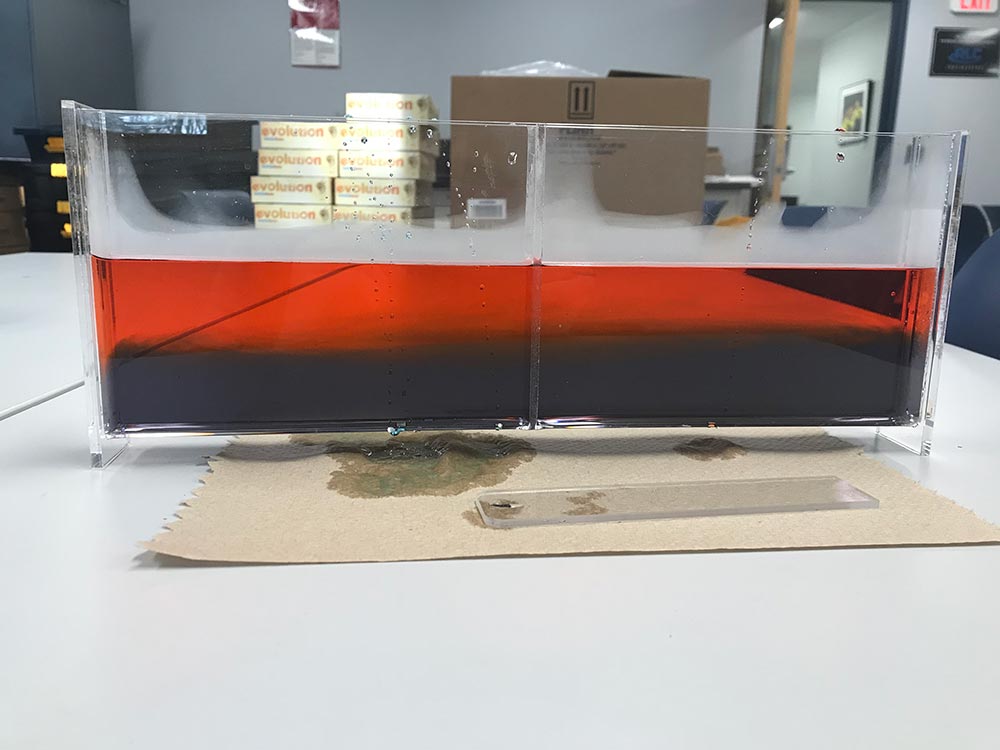
- Simultaneously, have all groups remove the plastic divider from their density box.
- Observe what happens.
- If the activity has worked properly, the density box should eventually settle so that there is a layer of cold (blue) water at the bottom and a layer of hot (red) water at the top.
- Journals: record observations on page 18
- Discuss the interface where the hot and cold water meets. This is called the thermocline. The goal is to get youth to talk about density. If needed, use the following question to prompt discussion:
- Why do you think the hotter water is at the top of the density box? (Youth may bring up how hot air rises … its the same principle: density)
- Heat and density reminder: Basically, atoms with more heat (or thermal) energy are vibrating faster than atoms with less heat energy. As atoms vibrate more, they hit each other more, pushing themselves farther apart from each other, spreading the same amount of atoms over a larger volume. How many atoms or molecules or particles are in a specific space is known as density!
- Density = mass / volume, or D=m/v
- Remember that temperature is a measure of the average thermal energy of a substance, but heat is the total thermal energy in a substance.
- Basically, the thermocline keeps water from the different layers from mixing
- The layers form because of differences in density
- The layers can impact water quality characteristics, e.g. dissolved oxygen.
Warmer things have a lower density because, on average, its atoms or molecules are moving faster than the atoms or molecules in colder things. As stated above, when atoms are moving faster they collide more often. The atoms are also colliding more often with any bounding membrane. Think of a car tire. Tires are sealed, so the number of molecules inside is constant. As the temperature drops (winter is coming), the air molecules inside the tire have less thermal energy, are not moving as fast, and so are less likely to collide with each other or the tire itself. The density of the air in the tire has decreased, so the tire deflates because that same number of molecules can now fit into a smaller volume.
Explore (20-30 minutes)
How (water) temperature affects aquatic species
As a group, discuss how water temperature affects aquatic species.
- KLEWS: brainstorm in the K column.
- Journals: brainstorm on page 18.
If needed, use the following questions to prompt discussion:
- How does a fish know when it is a good time to reproduce?
- Many species of fish3 know when it is time to reproduce based on water temperature cues (for some species, e.g. zebrafish, the temperature is a stronger predictor of reproduction than daylight)
- How does a fish know when it needs to migrate?
- Water temperature, along with other characteristics like water flow and daylight, is an important characteristic that cues fish to migrate
- How does the thermocline affect the water? The plants and animals in the water?
- Basically, the presence of a thermocline means that there are layers of water in the same water body that is largely not mixing. This can result in the upper and lower water layers having different water quality characteristics. This feature will come back in the dissolved oxygen lesson/activity.
3 We do not know if this is true for all fish species, as it is still being researched. We have found research indicating that zebrafish, damselfish, and fish, in general, rely on temperature to cue reproduction.
Explain: How (water) temperature changes
As a group, discuss what changes water temperature.
- KLEWS: brainstorm in the K column.
- Journals: brainstorm on page 18.
If needed, use the following questions to prompt discussion:
- How does water temperature change over a day? Why?
- Answer: Sunlight warms water during the day: water is colder at sunrise, warms over the daylight period, and cools down during nighttime (no sunlight)
- How does water temperature change over a year? Why?
- Answer: Water temperatures follow seasonal temperatures. Water starts out relatively cold in spring, warms by the end of the summer, and cools during fall and winter
- How do humans change water temperature?
- Example: Using water to cool an industrial process, then returning the warmed water to the water body
- How does the weather change water temperature?
- Answer: Rain and snow can add some (probably colder) water over a relatively short period of time
Data Literacy
The goal of this activity: Ultimately, youth should see that the usefulness of raw data depends in part on how many data points you are trying to look at once. For example, if the temperature is measured every 10 minutes and you are looking at a 30-day time period, you would have 4,320 data points. It can be hard to see all of them at once. So how much can you average? As you go from an hourly average to a daily average, you lose a lot of the variation in the data. How important is that variation?
Look at some raw data from three data collection buoys in the Damariscotta Bay:
- Temperature Graph, One Day (PDF)
- Temperature Graph, One Day: BW Friendly (PDF)
- Temperature Graph, One Week (PDF)
- Temperature Graph, One Week: BW Friendly (PDF)
- Temperature Graph, One Month
Form three groups: one group looks at data from the month of May 2016, a second group looks at data from one week in May 2016, a third group looks at data from one day in May 2016.
Compare the raw data (not averaged) to hourly averages and daily averages. The goal is to get youth to talk about when raw (unaveraged) data should be used, and when you can use averaged data.
Use the following questions to facilitate discussion, if needed:
- Which form of data do you like best? Raw? Hourly average? Daily average? WHY? (Hint: the context matters! Different groups may prefer different amounts of averaging.)
- How does the temperature change? What trends do you see? (e.g. daily vs. over weeks, months, or seasons)
Tuva
Use the Introduction to Tuva Labs Using Damariscotta Buoys (PDF) to try out using Tuva. This introduction sheet is designed to be used by youth to learn the basics of Tuva. The document can be printed out or used in PDF form and also has links to Tuva data.
After learning to use Tuva, explore temperature, salinity, and turbidity at the buoy sites. If needed, use the following questions as targets:
- Which buoy has the highest water temperature? The lowest?
- Which buoy has the largest variation in water temperature? How do you know?
- What trends do you see in water temperature?
Explain (5-10 minutes)
Use the following example questions to get youth to explain what they have learned about temperature and data interpretation:
- How does the time of day affect water temperature?
- How does the time of year affect water temperature?
- How does raw data compare to averaged data?
- What is a useful way to display data in Tuva? Why?
- Are different ways of displaying data more useful for different contexts? Why? (Example: changes over time, comparing one variable to another, variability at different sites.)
- What trends do you see in the data in Tuva? What do you think causes these trends?
Extend: Aquaculture Project (10-15 minutes)
Use both supplemental resources to help youth with their research:
- Supplemental Resource #3: Types of Aquaculture (PDF)
- Supplemental Resource #4: Researching Species and Water Bodies (PDF)
Journals: use pages 21 and 22.
Research the temperature range that your target species needs to survive and to live. Research the temperature range of your target water body. Are they a good match? If not, change the target species and/or the target water body. Check temperature and the previously covered water quality characteristics.
Evaluate (Assessment) (5 minutes)
Approximately 5 minutes before the end of the session, have youth finish up what they are doing, help clean up the materials, and do one of the following evaluation methods:
Have youth complete and turn in an exit ticket.
Have youth finish and turn in KLEWS chart.
After completing this activity youth should have the following in their journals:
- Definition of ‘temperature’ (page 17)
- Density box activity observations (page 18)
- Thermocline definition (page 17)
- Aquaculture project: (pages 21 and 22)
- Temperature range for the desired species, including temperature triggers (e.g. migration, reproduction)
- Temperature range for the desired water body
- Comparison of the two
Optional Extensions
Math extension
Have youth predict what will happen when the Density Box is left for a period of time. Record observations. Discuss why this has happened.
Answer: Over time, the water temperature will reach thermal equilibrium. The food coloring will be mixed together throughout the entire Density Box – we now have two colors mixed into water that is all at the same temperature.