Maine Wild Blueberry Production Statistics
Prepared by Lily Calderwood, Ph.D. and David E. Yarborough, Ph.D.,
Extension Wild Blueberry Specialists, Jordan Parks, Research Assistant, and Leala Machesney, Extension Professional
Updated September 2025
This Fact Sheet Contains:
- Historic to Present Maine Wild Blueberry Production and Value 1924-2024.
- Current Maine Wild Blueberry Production and Value.
- Maine Wild Blueberry Production Statistics by County.
Historic to Present, Maine Wild Blueberry Production and Value 1924-2023

Figure 1. Maine wild blueberry production and value from 1924 to 2023. Source: 1924-1989 Maine Department of Agriculture (1924 to 1928 includes imported berries), 1990 to 2023 New England Agricultural Statistics Service, and the Wild Blueberry Commission of Maine based upon aggregate tax records.
Current Maine Wild Blueberry Production and Value
Table 1. Maine wild blueberry production and value statistics from 2012-2024. Source: USDA & NASS. 2025. USDA/NASS, National Agricultural Statistics Service. QuickStats Ad-hoc Query Tool. Available at https://quickstats.nass.usda.gov/ (verified July 2025).
| Year | Harvested Acres | Weight (millions/lbs) | Weight (lbs/Acre) | % Fresh | % Processed | Fresh $/lb | Processed $/lb |
|---|---|---|---|---|---|---|---|
| 2024 | 19,100 | 90.8 | 4,760 | 1.6% | 98.5% | 2.54 | 0.51 |
| 2023 | 23,800 | 87.6 | 3,680 | 1.0% | 99.0% | 0.96 | 0.52 |
| 2022 | 19,700 | 77.6 | 3,940 | 1.0% | 99.0% | 2.30 | 0.70 |
| 2021 | 21,000 | 103.8 | 5,000 | 1.0% | 98.9% | 2.30 | 0.75 |
| 2020 | 20,700 | 47.4 | 2,290 | 1.5% | 98.5% | 0.82 | 0.60 |
| 2019 | 20,500 | 77.9 | 3,800 | 1.6% | 98.1% | 1.19 | 0.46 |
| 2018 | 18,800 | 50.4 | 2,681 | 3.1% | 96.7% | 1.05 | 0.46 |
| 2017 | 17,000 | 67.8 | 3,988 | 0.5% | 99.3% | 2.20 | 0.25 |
| 2016 | 23,100 | 101.8 | 4,409 | 0.4% | 99.4% | 0.79 | 0.27 |
| 2015 | 22,400 | 101.1 | 4,514 | 0.5% | 99.4% | 1.90 | 0.46 |
| 2014 | 22,800 | 104.4 | 4,579 | 0.6% | 99.4% | 2.00 | 0.60 |
| 2013 | – | 87.9 | – | 0.6% | 98.5% | 1.95 | 0.75 |
| 2012 | 18,110 | 91.1 | 5,030 | 0.5% | 99.5% | 2.25 | 0.75 |
Current Maine Wild Blueberry Production and Value – Graphed
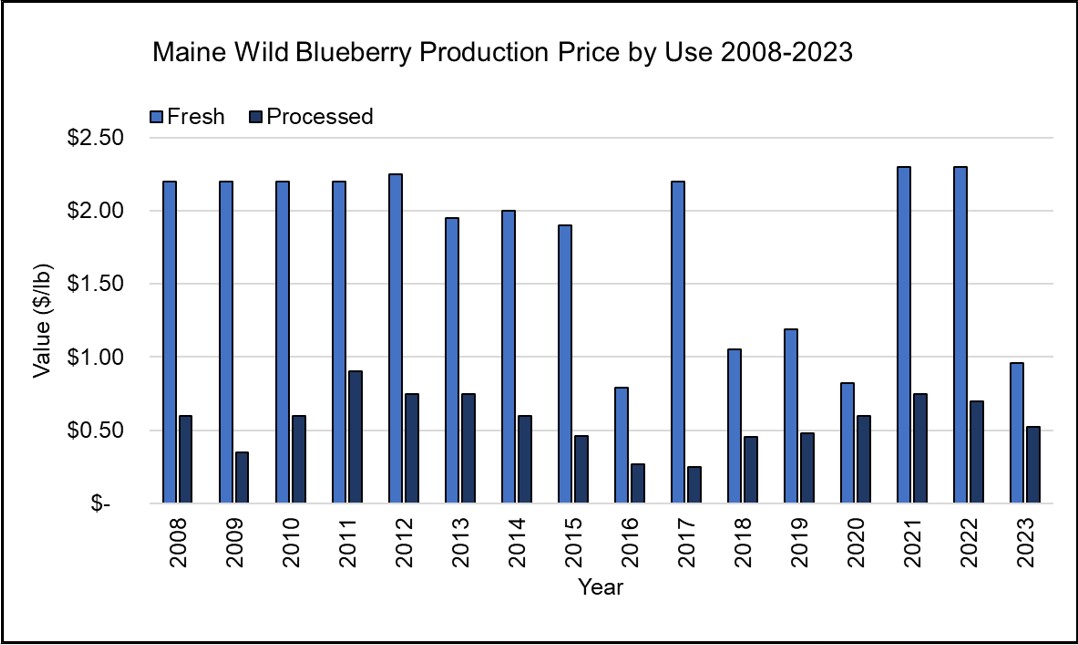
Figure 2. Maine wild blueberry production price by use, fresh or processed between 2008 and 2023. Source: USDA & NASS. 2024. USDA/NASS, National Agricultural Statistics Service. QuickStats Ad-hoc Query Tool. Available at https://quickstats.nass.usda.gov/ (verified May 2024).

Figure 3. Maine wild blueberry harvested acres and production (lbs/A) in 2014 to 2023. Source: USDA & NASS. 2024. USDA/NASS, National Agricultural Statistics Service. QuickStats Ad-hoc Query Tool. Available at https://quickstats.nass.usda.gov/ (verified May 2024).
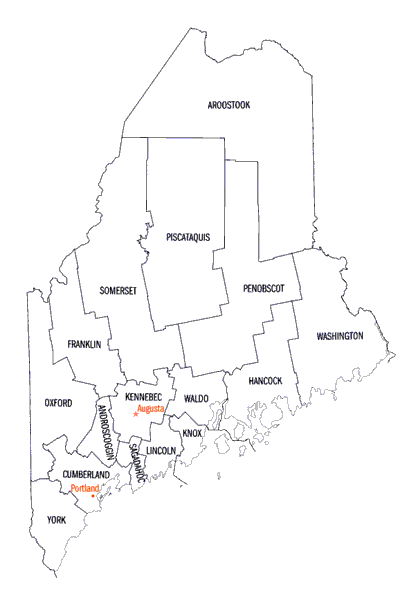
Maine Wild Blueberry Production Statistics by County
Table 2. Wild blueberry fruit bearing acres by county (every 5 years), with state totals. Source: USDA & NASS. 2024. USDA/NASS, National Agricultural Statistics Service. QuickStats Ad-hoc Query Tool. Available at https://quickstats.nass.usda.gov/ (verified May 2024).
| County | 1997 | 2002 | 2007 | 2012 | 2017 | 2022 |
|---|---|---|---|---|---|---|
| Androscoggin | (NA) | (NA) | (NA) | 1 | (NA) | (NA) |
| Aroostook | (NA) | (NA) | (NA) | (NA) | (NA) | (NA) |
| Cumberland | 246 | 141 | (NA) | (NA) | 41 | 83 |
| Franklin | 92 | 135 | (NA) | (NA) | 23 | (NA) |
| Hancock | 3839 | 3162 | 5812 | 2717 | 4,496 | (NA) |
| Kennebec | 97 | (NA) | 122 | 35 | 23 | (NA) |
| Knox | 1647 | 1494 | 1398 | 776 | 1,345 | 1,705 |
| Lincoln | 396 | 309 | 286 | 299 | (NA) | 346 |
| Oxford | 242 | 168 | 115 | 147 | (NA) | (NA) |
| Penobscot | 139 | 119 | 95 | 111 | 82 | (NA) |
| Piscataquis | 233 | 133 | 221 | 96 | (NA) | (NA) |
| Sagadahoc | (NA) | (NA) | (NA) | 12 | 12 | (NA) |
| Somerset | (NA) | (NA) | 24 | 3 | (NA) | (NA) |
| Waldo | 609 | 391 | 380 | 199 | 498 | 297 |
| Washington | 17861 | 16844 | 14222 | 13668 | (NA) | (NA) |
| York | (NA) | (NA) | 7 | 32 | (NA) | 3 |
| State Total | 25,429 | 23,000 | 22,747 | 18,110 | 20,023 | 24,302 |
Figure 4. Maine wild blueberry, fruit-bearing acres (every 5 years) in eastern coastal counties, Lincoln to Washington where a majority of Maine’s wild blueberries are grown. Data labeled with a “#N/A” are counties/years where data are withheld to protect individual operations. Source: USDA & NASS. 2024. USDA/NASS, National Agricultural Statistics Service. QuickStats Ad-hoc Query Tool. Available at https://quickstats.nass.usda.gov/ (verified May 2024).
