Expedition 3: How Do Scientists Know What Data to Collect and How to Collect It?
Catching up, looking ahead, and more scientific practices
In last week’s video, Lynn described asking questions and defining problems to direct her focus on the problem of global sea level rise, and its connection to the stability of Antarctic ice shelves. Another step in Lynn’s process was to gather and evaluate information from suggestions made in previous research studies and observations of past events to help develop some testable research questions.
This week, we revisit those questions as Lynn explains how they are used to make decisions about what data will be needed to help answer those questions, and making plans to identify the best locations and methods to gather those data. Lynn will discuss how she will be gathering and analyzing data, planning and carrying out investigations, and designing solutions to problems.
Like we have mentioned before, these are all practices of scientists and engineers. You might notice that some of these practices will show up more than once and rarely by themselves. This is because the practices are so connected to one another that it is difficult to imagine using only one without one or more others at the same time.
For example, if you saw a puddle of water in the middle of the floor (hopefully before you stepped in it), you would immediately start thinking about how it got there, coming up with possible explanations, planning some ways of testing those ideas, and more! It’s just what we do! It’s what makes us all scientists!
Like us, Lynn is doing what scientists do by using many of these practices to answer questions about the Ross Ice Shelf.
Research questions and how they might be answered
Lynn is asking three questions:
- Is the Ross Ice Shelf speeding up or changing its flow pattern;
- Are there indications of crevassing within the ice that can tell us more;
- What areas of the ice shelf are most important in pushing back glaciers?
In order to answer these questions, Lynn will need to rely on observations of events like the collapse of the Larsen B Ice Shelf, and the research of other scientists. These sources tell us that as Larsen B began to break apart, ice began to enter the ocean much more quickly than before. We also know that there are some signs that indicate how stable an ice shelf is, such as changes in its flow and crevassing below the surface.
Is the Ross showing any of these signs? How can we measure them?
GPS, GPR and DANGER!
Lynn’s team has decided to collect data from a region called the McMurdo Shear Zone. As we see in the video, this is where the two ice shelves, Ross and McMurdo meet. Since the two ice shelves are moving at different speeds and in contact with each other, a force is caused between the ice shelves called “friction.” This force causes the Ross to move more slowly than it would without McMurdo rubbing against it.
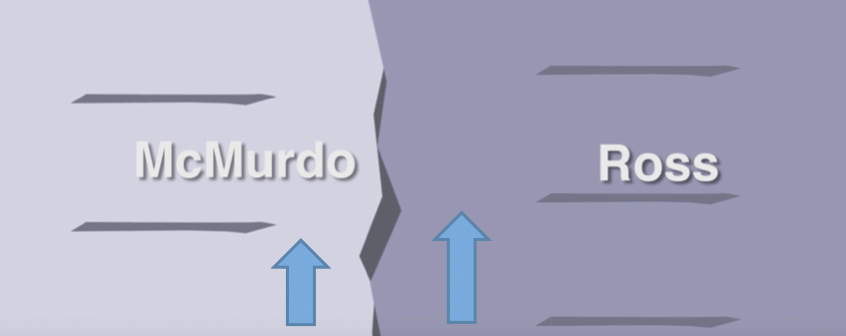
Friction also causes the ice between them to “shear,” or stretch and break, as it is pulled and stretched by the ice shelves, creating an area of crack and crevasses. Gathering information about these crevasses will also help Lynn answer her questions about the future stability of the Ross.
Is the motion of the ice shelf changing?
- Thanks to Global Positioning System (GPS) technology, Lynn will be able to collect very accurate data tracking the position of points on the ice shelf using satellites to locate the GPS receivers installed by the team. Later, she will be able to notice if the motion is changing over time.
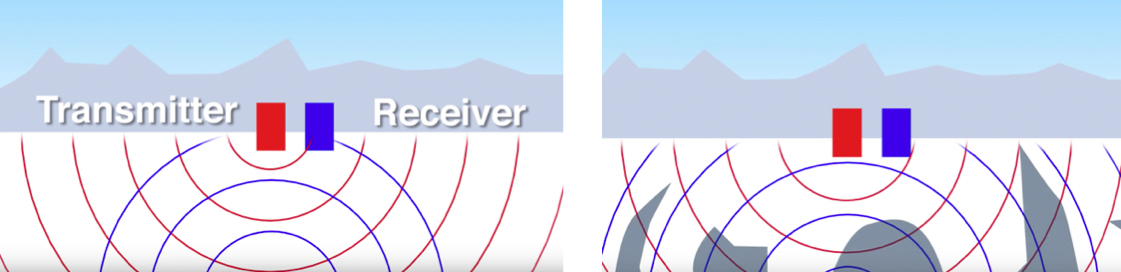
Is there evidence of crevassing in the shear zone?
- Using Ground Penetrating Radar (GPR) technology, Lynn’s team will collect information about the ice below the surface. As she mentions, the size, distribution, and orientation of crevasses will tell her more about how stable the ice is.
Watch your step!
Antarctica is a dangerous place to work, with many of the hazards hidden beneath seemingly flat snow cover. Thanks to problem solving efforts of Dartmouth engineering students and their project director, Dr. Laura Ray, Yeti is up for the challenge. This Remotely Operated Vehicle (ROV) will drag the GPR unit across the ice to make data collection safer for the team. Additionally, the team has spent the past few weeks participating in extensive safety training before heading out to the field site.
What do you think?
Here are some questions to discuss with your class, or to investigate on your own!
Specific questions:
- What are some other ways we could use GPR and Yeti?
- What places would it be helpful to send a robot instead of a human?
Broader questions:
- Can you think of another time when you needed more information before trying to answer a question of your own?
- How did you decide where to get the information, and how did it inform your next steps?
Have more questions?
- Send us an email at umainefar@maine.edu
- Join Lynn (@UMaineFARLynn) live each week throughout her journey and ask your questions using #UMaineFAR. (Archived UMaineFAR Live Chats)
- Follow the adventure on Twitter (@UMaineFAR)!
- Visit the Follow a Researcher® website
Other resources:
- Yeti, the ROV
- Linda, the tractor
- For more about NGSS and Scientific and Engineering Practices, see NGSS
Join the next live chat on Thursday, November 2 at 1:00 PM (EDT) by searching the hashtag: #umainefar. Subscribe to 4-H Follow a Researcher® calendar: iCal HTML