University of Maine Pasture Poultry Project, Summer 2017
University of Maine Pasture Poultry Project, Summer 2017 (PDF)
Authors: Knight, CA., G. AndersonB and J. HatleyC
AAssistant Extension Professor – Livestock Specialist; BAnimal and Bioscience Specialist; CManager J. F. Witter Center
Abstract
Six commercial strains of broilers were selected to compare growth rate, feed conversion, feed consumption, forage utilization, water consumption, and mortality data on pasture using a conventional chicken tractor (Suscovich, 2016). Five slow growing breeds: Turken Neck (TN), Red Freedom Ranger (RF), Black Freedom Ranger (BF), Imperial Red (IR) and Imperial Stripe (IS) were chosen, with a Cornish Rock Cross (CC) as a control group. Chicks were hatched 5-6 June, 2017 and received in Orono, Maine on 7-8 June 2017. Chicks were immediately placed into a brooder room (75.9-90.0 °F) based on breed until they had sufficient plumage to be moved to the tractor. After a 5 d acclimation period, tractors were moved to a recently mowed Timothy-grass hay pasture (Phleum pretense). Tractors were moved daily to fresh grass, and daily pen, water, and forage utilization monitored. Birds were weighed weekly, and prior to and after processing to determine dressing percentages and carcass weights. Temperature and humidity were recorded. Birds were raised to a tractor average of 5.37±0.74 lbs. Turken necks (TN) were removed from the study during week 9 due to very slow growth rates. Lifetime water intake per bird appeared highest for IR, 4.6±0.19 gallons(G) when compared with RF, BF, CC and IS with 4.1±0.16, 4.2±0.23, 3.6±0.24, and 3.9±0.21 G, respectively. Average individual feed consumption was similar across breeds with RF, BF, CC, IR, and IS consuming 125.1, 102.2, 144.2, 117.6 and 128.5 g/d, respectively. Cornish Rock Cross birds were processed at 46 days old, RF and IS at 60, BF at 61, and IR at 62 days. Live weights of birds did not differ (P > 0.05) among breeds at slaughter. However, CC birds had a higher (P < 0.05) dressing percentage (75%), compared with the other breeds (68±3%), yielding approximately 0.44 lbs more per carcass. Gain appeared similar for all groups (2.94±0.24). No differences in forage utilization was similar across breeds, were apparent among breeds, (10.6±6.9 g/d). While forage utilization the CC tractor required 71-82 m^2 less land than RF, BF, IR and IS tractors due to shorter growth period. No lameness or breast abrasions were observed across breeds.
Key words: Pasture Poultry, Chicken Tractor, Forage Utilization, Gain, Feed Efficiency
Introduction
In January 2017, the National Chicken Council released an article supporting the U.S. Poultry and Egg Association on the need for funded research of slow growing poultry (WattAgNet.com 2017). The article also expressed the need for science and data based studies versus emotional or rhetoric based conclusions on poultry welfare and growth rates. The 2012 USDA Census of Agriculturereports that Maine farmers produce approximately 55,657 broilers (meat birds) annually, an increase of 281% from 2007 (USDA 2012). Maine has no registered commercial broiler operations. All broiler/meat type poultry are produced through small scale farming operations and sold mostly through farmers’ markets. Over the last five years, small scale farm operations have increased 65% from 214 – 355 farms. Farmers are venturing into small-scale pastured poultry models with no, or in many cases, little science based guidance. The majority of farmers are developing production practices through trial and error methods. The current lack of data on starting a pastured broiler operation creates a lot of uncertainty for beginning farmers. The objectives of this study were to compare conventional, slow growing and heritage breeds of pastured broilers for growth rate, water intake, forage utilization, feed intake and efficiency, mortality rates, and dressing percentages.
Materials and Methods
Six strains of broilers were utilized in this study. First, a conventional Cornish Rock Cross[1] (CC, n = 32) was selected to serve as a control. Four commonly utilized slow growing breeds were selected based on popularity and availability for this study. Those breeds included: Red Freedom Ranger[2] (RF, n = 32), Black Freedom Ranger2 (BF, n = 32), Imperial Red1 (IR, n = 30) and Imperial Stripe1 (IS, n = 30). Finally, Turken “Naked” Neck[3] (TN, n = 32) birds were selected for comparison because of their popularity in Western Europe because of their ease of plucking and heat resistance (www.efowl.com). Turken Neck chicks were hatched 5 June, 2017 while the remaining breeds were hatched on 6 June, 2017. Chicks were delivered to the University of Maine’s J. Franklin Witter Center in Orono, ME between 7-8 June, 2017. Upon arrival, chicks were randomly placed in one of six brooders (75.9-90.0 °F) based on breed. Broilers were fed a 20 % Chick Starter (Poulin Grain, Newport, VT. See Figure 1). Initially, birds were fed from flat pans and jar-style feeders and water was also offered in jar-style waterers. Chicks were kept in brooders until they grew sufficient plumage to be moved to tractors ( ~14 d).
On 18 June, 2017 birds were moved to tractors placed inside a covered barn and given a heat lamp to aid in acclimation of the new environment. Jar-style waterers and feeders were replaced with 30 lbs gravity feeders and 5 G pails fitted with 4 watering nipples. Chick Starter feed was replaced with 20 % Broiler Crumble (Poulin Grain, Newport, VT. See Figure 2). After a 4 day acclimation period, tractors were moved to pasture. Temperature, humidity, feed utilization, and water utilization were monitored daily while animals were in the brooder. Weekly brooder weights were also collected. Prior to being moved to pasture, broiler numbers were reduced (n = 28) per tractor to maintain an even stocking rate. Once broilers were moved to the tractor, daily tractor feed, water and forage utilization were monitored. Each tractor was equipped with a high/low temperature and humidity sensor. Individual weights were collected weekly once chicks were placed on pasture. Broilers remained on pasture until the tractor average weight per bird was 5.37±0.74 lbs.
Tractor
On 26 June, 2017 all tractors were moved from the covered barn and placed on a recently mowed Timothy-grass hay pasture (Phleum pretense). Breeds were randomly assigned one of six lanes and placed 1 m apart. The tractor was advanced the length of itself daily to allow the birds fresh foraging material. After one week, tractors rotated lanes so that they were given the opportunity to forage in every lane at least once as they moved across the field. Feed and water consumption was recorded daily. Tractor temperature and humidity were monitored daily. Also, daily forage utilization was monitored.
Forage Utilization
Forage utilization is defined as the proportion of current year’s forage production that is consumed or destroyed by grazing animals (USDA, 2012). Gathering forage utilization data can help calculate a rough estimate of forage intake. Based on the Height-Weight method described by Lommasson and Jensen (1943), forage utilization was estimated.
On four separate dates during the summer of 2017, forage heights and weights were collected. See Figure 3. A 40 x 40 cm frame was placed around five random locations within the study field (outside the tractors) and an average forage height was recorded. Then, all forage within the frame was clipped, weighed, and dried in a 140 ° F drying oven until weights stabilized. A basic linear regression model was used to fit forage height with weight (DM). See Figure 4.
During the trial, a 10 point grid was setup within the dimensions of the chicken tractor. Forage heights were taken at each point within the grid before and after the tractor grazed each location. Heights were averaged before and after to estimate forage availability and utilization.
Results and Discussion
The following table shows the basic summary production data for the project. Comparing these data with the average expected performance of Arbor Acres Plus commercial broilers in a controlled atmospheric house shows the house birds grew faster and were more efficient. House birds were at the pasture bird slaughter weight by 29 days of life compared with our Cornish Cross birds at 46 days and the other breeds by day 60 (Arbor Acres Plus Broiler Performance Objectives). Feed Conversion Ratio (FCR) of our pasture birds (3.6 for CC birds) was much lower than the Arbor Acres Plus house birds at 1.4 lbs of feed per pound of gain. Our slow grow birds had lower FCR compared with our CC birds at 3.9 to 4.8 lbs of feed per pound of gain. Comparison of our data with the University of Kentucky factsheet, “How much will my chickens eat” were lower for total expected feed intake than our birds at 10.2 lbs compared with our average feed intakes of 14.6 lbs for control CC birds and the slow grow breeds ranging from 13.7 to 17.0 lbs of cumulative feed. The Kentucky data reflected a bodyweight of 5.22 lbs at 49 days of age and a feed conversion rate of 1.97.
| Breed | |||||
|---|---|---|---|---|---|
| Cornish Cross | Red Freedom Ranger | Black Freedom Ranger | Imperial Red | Imperial Stripe | |
| N | 28 | 28 | 28 | 28 | 28 |
| Feed Intake, lbs* | 14.6 | 16.5 | 13.7 | 16.1 | 17.0 |
| Water Intake, G | 3.6 | 4.1 | 4.2 | 4.6 | 3.9 |
| Forage Utilization, lbs | 0.8 | 1.1 | 1.1 | 1.0 | 1.1 |
| Forage Utilization, % | 51 | 44 | 46 | 44 | 40 |
| FCR** | 2.7 | 3.0 | 2.7 | 2.9 | 3.2 |
| FCRcarcass*** | 3.6 | 4.3 | 3.9 | 4.2 | 4.8 |
| Death Loss, % | 0.0A | 0.0A | 3.6A | 3.6A | 0.6A |
| Mobility/leg issues, % | 0.0 | 0.0 | 0.0 | 0.0 | 0.0 |
| Abrasions, % | 0.0 | 0.0 | 0.0 | 0.0 | 0.0 |
| Processing Data | |||||
| Cornish Cross | Red Freedom Ranger | Black Freedom Ranger | Imperial Red | Imperial Stripe | |
| N | 28 | 28 | 27 | 27 | 27 |
| Live Weight, lbs | 5.4A | 5.5A | 5.15A | 5.54A | 5.24A |
| Carcass, lbs | 4.1A | 3.8AB | 3.5B | 3.8B | 3.5AB |
| Dressing,% | 75A | 69B | 68B | 68B | 67B |
All intake presented on a dry matter basis
Means within row with different superscripts are statistically different (P < 0.05)
*Lifetime grain intake (90% DM)
**FCR(feed conversion ratio) is defined as feed:liveweight gain
***FCRcarcass defined as feed:carcass weight
Authors observed no structural issues or breast abrasions in either slow-growing breeds or the conventional CC birds during this trial, suggesting that birds slaughtered at a liveweight of 5.5 lbs can support their own weight while maintaining a higher performance level. Since CC reach slaughter weight approximately 2 weeks prior to slow growing birds, they are only being moved on pasture for 3 weeks compared with slow growing birds which require moving the tractor for 5 weeks. Given Maine’s climate, a four month production cycle could be utilized from mid-May to mid-September. Producers could run 3 full production cycles of CC versus only 2 of slow growing breeds. Cornish cross birds take 46 days for their first production cycle, but then only 28 days on pasture for subsequent CC birds. Two batches of birds could be completed in 74 days, 3 batches in 102 days. Slow growing birds would require ~60 days for one cycle, 102 for two batches and 144 days for 3.
In order to maintain healthy pastures, it is a good idea only to remove ~50% of the forage. Once more than 50% of the biomass is removed above ground, the plant root structure starts to suffer which leads to a decline in pasture health. During the first week on pasture, breeds averaged a 9% forage utilization per day, so during the first week on pasture, birds would only have to be moved about 2 times a week to maintain a healthy pasture. After the first, week, authors recommend moving the tractors daily because forage utilization averages approximately 50%. If a larger carcass size is desired, tractors may need to be moved more frequently. During hotter weather, birds tended to lay down more, and their forage utilization went down significantly. In order to reduce heat stress on birds, it would be a good practice to only move the tractors every other day while experiences above average temperatures.
Generally speaking, livestock tend to trample as much forage as they consume. However, most livestock have anatomy conducive to digesting cellulose (the most abundant form of energy on Earth), like ruminants or horses. Chickens are not able to digest cellulose (a structural component of plant cell walls), so they probably consume an even smaller percentage of forage than ruminants or horses. Even if chickens did consume an equal percentage of the forage utilized, it would only make up 3.6% of their diet. Authors would assume that intake would be slightly higher on a legume based pasture, but would most likely make no significant difference. Often times, farmers assume that poultry raised on pasture will consume less feed over their production cycle when compared with house raised poultry due to foraging for grass and insects. However, this is not true. Animals will have a higher energy demand living outside because they are expending more energy walking around and using more energy to stay warm/cool.
| Cornish Cross | ||||||
|---|---|---|---|---|---|---|
| Chickens per tractor | Tractor | Days | Acres | Chicken capacity | Reps | Total Acreage |
| 36 | 1 | 21 | 0.16 | 216 | 1 | 0.16 |
| 36 | 1 | 21 | 0.16 | 432 | 2 | 0.32 |
| 36 | 1 | 21 | 0.16 | 648 | 3 | 0.48 |
| 36 | 3 | 21 | 0.16 | 216 | 1 | 0.48 |
| 36 | 3 | 21 | 0.16 | 432 | 2 | 0.95 |
| 36 | 3 | 21 | 0.16 | 648 | 3 | 1.43 |
| 36 | 6 | 21 | 0.16 | 216 | 1 | 0.95 |
| 36 | 6 | 21 | 0.16 | 432 | 2 | 1.91 |
| 36 | 6 | 21 | 0.16 | 648 | 3 | 2.86 |
| Slow growing | ||||||
| 36 | 1 | 35 | 0.27 | 216 | 1 | 0.27 |
| 36 | 1 | 35 | 0.27 | 432 | 2 | 0.53 |
| 36 | 1 | 35 | 0.27 | 648 | 3 | 0.80 |
| 36 | 3 | 35 | 0.27 | 216 | 1 | 0.80 |
| 36 | 3 | 35 | 0.27 | 432 | 2 | 1.59 |
| 36 | 3 | 35 | 0.27 | 648 | 3 | 2.39 |
| 36 | 6 | 35 | 0.27 | 216 | 1 | 1.59 |
| 36 | 6 | 35 | 0.27 | 432 | 2 | 3.18 |
| 36 | 6 | 35 | 0.27 | 648 | 3 | 4.77 |
Literature Cited
Arbor Acres Plus Broiler Performance Objectives. 2014. Aviagen Company Publication.
Jacob, Jacquie and Tony Pescatore. 2012. How Much Will My Chickens Eat? University of Kentucky Cooperative Extension Service Bulletin ASC-191. Lexington, KY.
Lommasson, T. and C. Jenson. 1943. Determining Utilization of Range Grasses From Height-Weight Tables. Journal of Forestry. PP
Management Guide – Broiler. Hubbard Breeders. Walpole, NH.
Suscovich, John. 2016. Stress-Free Chicken Tractor Plans: An Easy to Follow, Step-By-Step Guide to Building Your Own Chicken Tractors. 2nd Ed. Farm Marketing Solutions. Emerald Lake Books.
USDA. 2012. Census of Agriculture. Census Volume 1, Chapter 1: State Level Data. Maine. Table 32. https://www.agcensus.usda.gov/Publications/2012/Full_Report/Volume_1,_Chapter_1_State_Level/Maine/st23_1_032_033.pdf
USDA. 2012. Harvest Efficiency in Prescribed Grazing. Technical Note 73. Boise, ID – Salt Lake City, UT. PP 589-593.
Watt Agnet.Com. 2017. Study: Slower-growing broiler production has faults. Referenced at https://www.wattagnet.com/articles/29462-study-slower-growing-broiler-production-has-faults
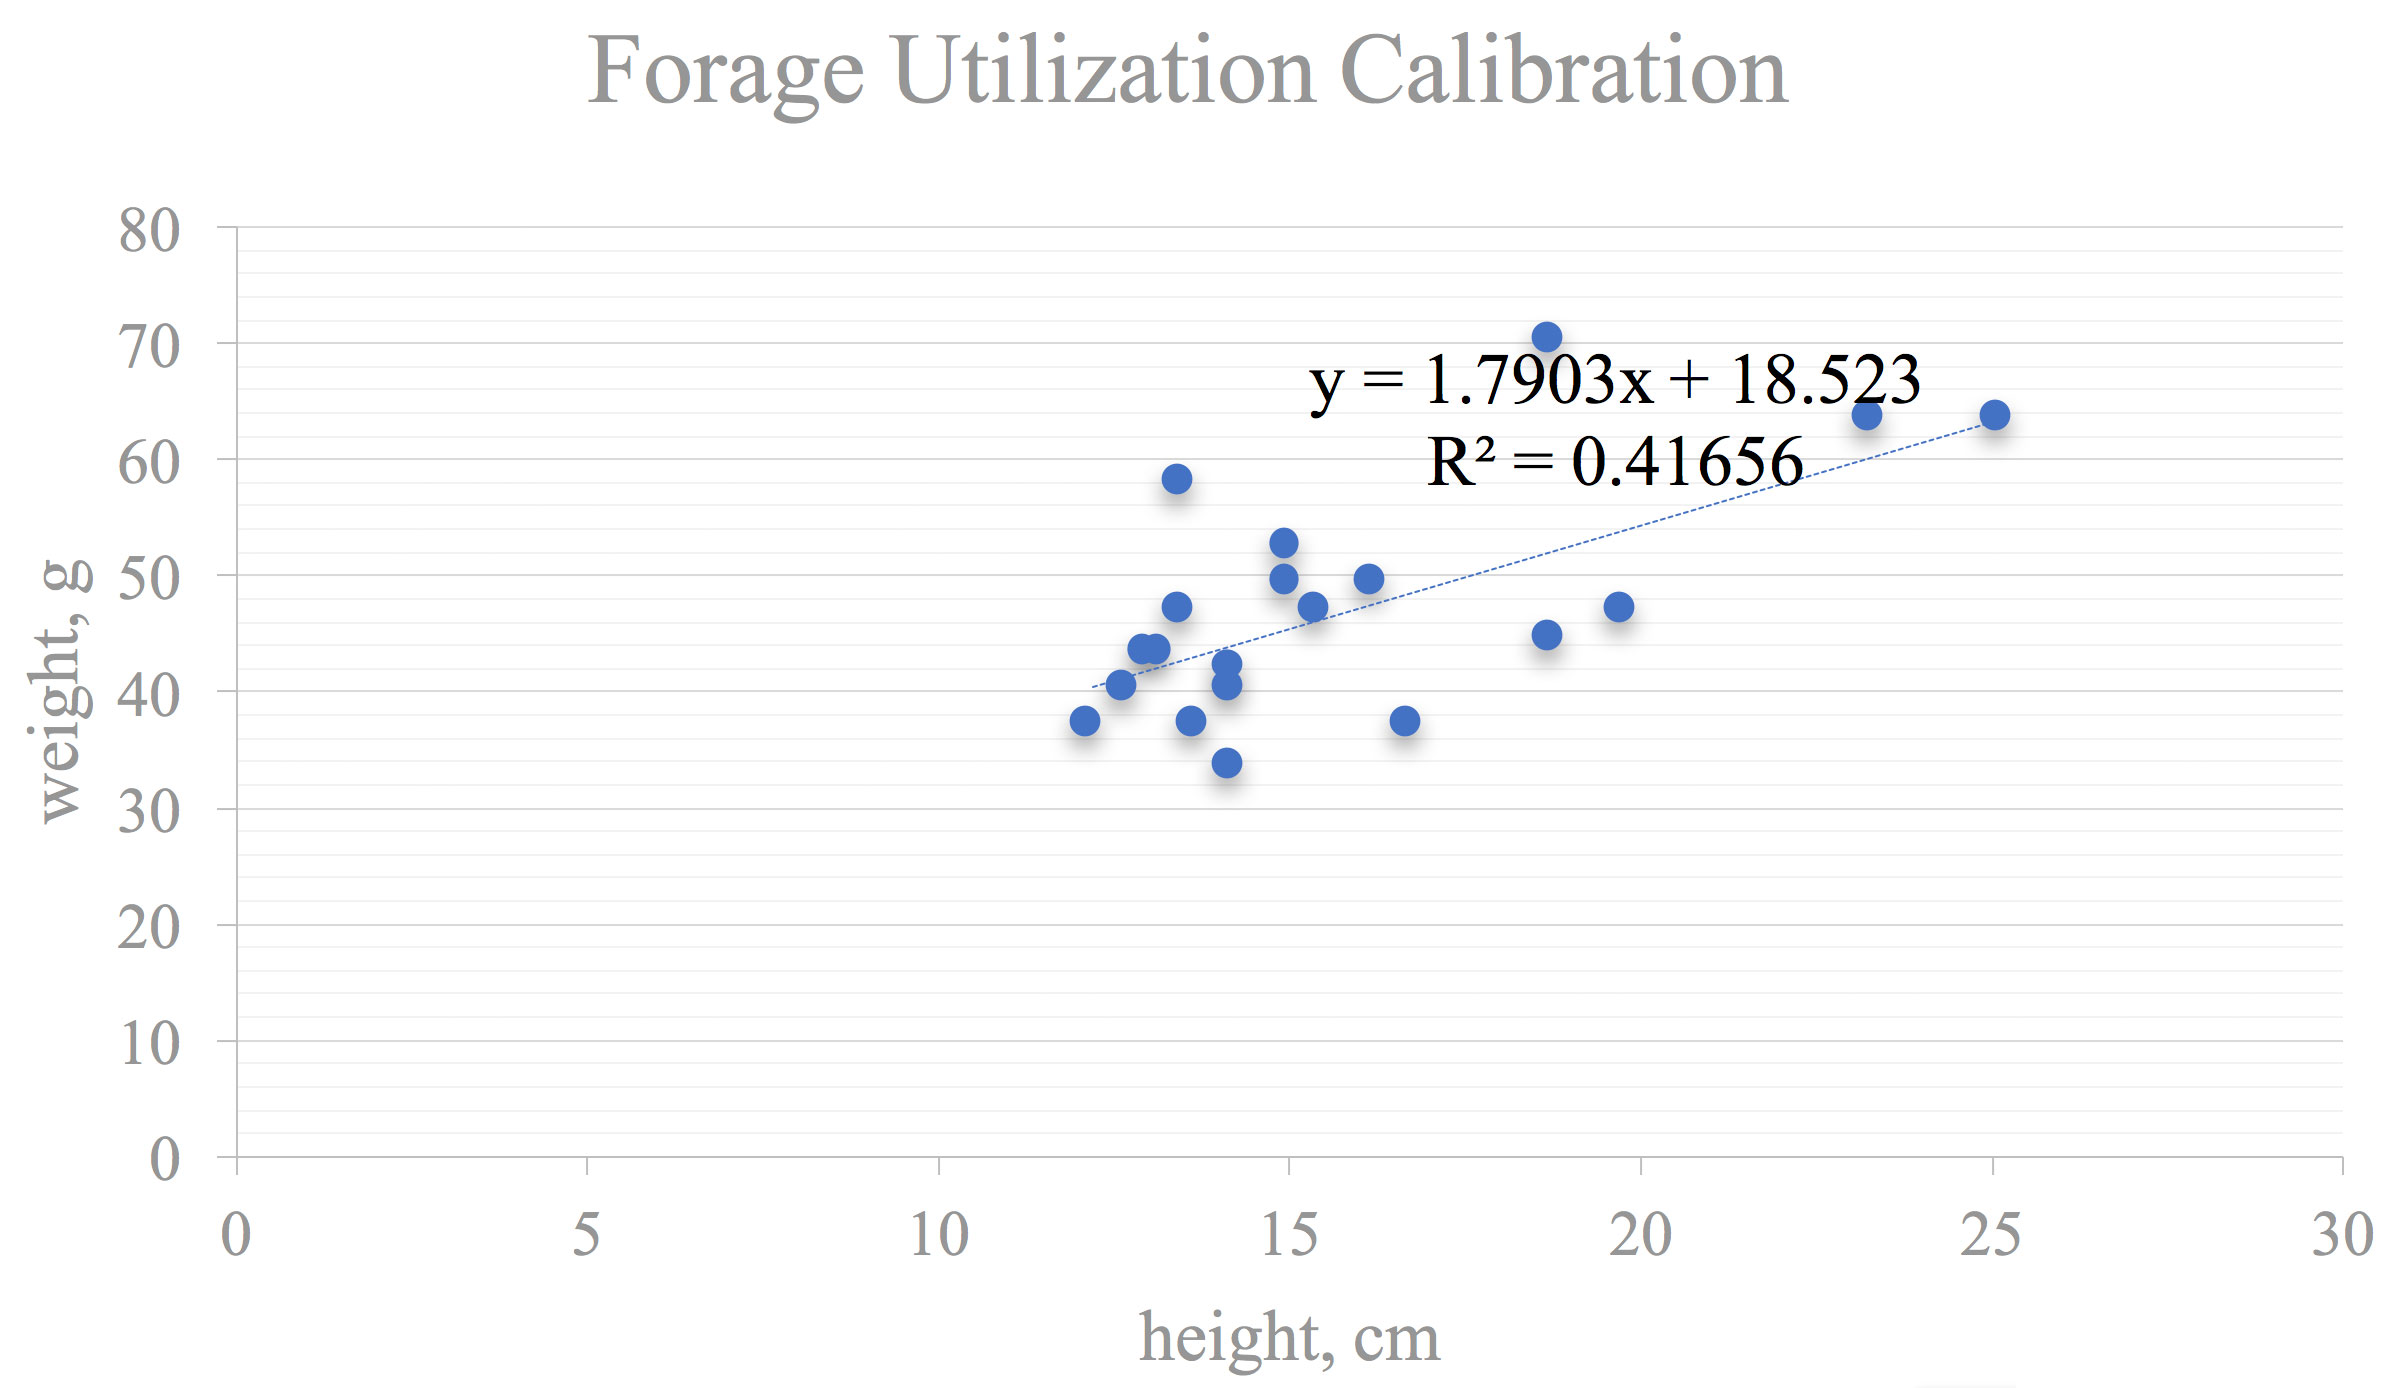
Figure 4. Forage height correlation
Project Outreach — Completed
Knight, C. W. University of Maine Pasture Poultry Project. Unity, ME. Sept. 21, 2018. Seminar
Knight, C. W. Chicken Smoking Seminar and Pasture Poultry Project update. Falmouth, ME. June 13, 2018.
Knight, C. W, G. Anderson, and J. Hatley. University of Maine Pasture Poultry Project Final Report. April 9, 2018.
Knight, C., G. Anderson and J. Hatley. 2018. Economic and production benefits of conventional and slow-growing pastured broilers. National Association of County Agricultural Agents. Annual Meeting. Chattanooga, TN. Submitted
Knight, C. W. 2018. Research highlights from 2017 Maine Pasture Poultry Project. Smoked Chicken Dinner with Other Local Fare. Howland Farmers’ and Artisans’ Market. Passadumkeag, ME. April 12, 2018.
Knight, C. W. 2018. From Pasture to Smoker. Rural Living Days. Thorndike, ME. April 7, 2018.
Knight, C. W. 2018. Maine Pasture Poultry Project Update and Smoking Chicken Seminar. Penobscot Country Cooperative Extension Executive Committee. Bangor, Maine. March 28, 2018.
Knight, C. W. 2018. Raising pastured broilers in Maine. 2018 Annual Grazing Conference. Maine Grass Farmers Network. Hinckley, ME. March16, 2018.
Knight, C. W. 2018. Smoked Chicken and Pasture Raised Broiler Research and Results. Somerset Extension Association Annual Meeting. Skowhegan, ME. February 18, 2018.
Anderson, G. 2017. Maine Pasture Poultry Project Research Highlight. Maine Association of Extension Agents Annual Meeting and University of Maine Cooperative Extensino Agricultural Staff Meeting. Bangor, ME. November 17, 2017.
Knight, C. W. 2017. Smoking Chicken. Extension Annual Meeting. Invited Speaker. Dover-Foxcroft, ME. November 8, 2017
Hatley, J. 2017. Maine Pasture Poultry Project Upddate. Maine Poultry Growers Association. First Annual Conference. October 21, 2017.
Hatley, J. 2017. Pasture Poultry Project. J. F. Witter Center Open House Field Day. Orono, ME. Summer, 2017.
Project Outreach — Being prepared
Knight, C., G. Anderson and J. Hatley. 2018. Economic and production benefits of conventional and slow-growing pastured broilers. Journal Article Submission
Fact Sheet — 2017 Pastured Poultry Project Summary and Recommendations
Fact Sheet — Spreadsheet on costs of raising pastured poultry
[1] Moyer Hatchery (Quakertown, PA)