Activity 4: How Fast Do Invasives Multiply?
Topic: Youth are introduced to the concept of population growth and decline and explore factors like reproduction, predation and migration that contribute to changes in population size.
Time: This activity should take approximately 45-60 minutes to complete.
 Learning Outcomes
At the end of this activity, youth should be able to…
- Understand that invasive species have advantages over native species.
- Describe the difference between a predator-prey relationship and a competitor relationship in an ecosystem.
- Explain that a lack of predators is a major contributing factor to population growth for invasive species.
Background Information
This activity shows youth how the growth and reproduction of invasive species on the Maine coast can cause problems for other native species. The invasive crabs eat food that other species need and create competition for scarce food resources. This activity is meant to model a potential way in which invasive species can multiply and how their multiplication can affect other species. This can also be explained as the ‘population growth rate’ of each species, in this case how the population of a species changes over a period of time. It can increase or decrease depending on factors such as the food present, the environment, or the population of predators. This definition might be complicated for youth to grasp.
This activity consists of youth rolling dice. Each roll corresponds to an action that affects the total number of a species. Actions correspond to green crabs, clams, and lobsters depending on the section of the activity. This activity should result in green crabs increasing, and clams/lobsters decreasing. This may not happen after every roll but should be the trend after the activity is completed. It is important to have youth compare their results.
This activity models how invasive species can populate areas and spread quickly due to lack of predators in the area. This uncontrolled population then leads to the decrease in other populations. The youth should have learned from the lessons prior that all things in this ecosystem are connected, so an increase in one species affects every other species in the ecosystem.
After a season there should be an increase in green crabs which eat the clams. The clam population will then decrease. This also affects the lobster population, for they also eat clams; the increase in green crabs means there are fewer clams available for lobsters to eat. The lobster population tie-in is included to show how an invasive species affects not just one thing in the ecosystem, but their presence can affect almost every connection in the ecosystem.
Materials
- Data sheet
- Pencils/ erasers
- Dice
- Rule sheet
- Plastic disks in multiple colors
Optional:
- White boards
- Markers
Vocabulary
- Competitors = species in an ecosystem who need the same resources to survive
- Predator = animals that survive by consuming other animals
- Prey = animals that are consumed by predators
Methods
Engage
- Ask the whole group some questions to get the youth thinking about the clams and green crabs that they have learned about. Example script/questions: “Think back to the green crabs we watched in our last session. What do you remember specifically about the crabs?” “What do you think (or remember from previous activities) these crabs eat?” “What do you think might eat green crabs?”
- If they are stuck, ask the youth to think back to their food webs. Present them with the aquatic species cards if they are struggling. They can organize them like they did in Activity 1 to model the connections.
- After the youth have explored what they think eats these species, ask: “Do you think the green crabs we learned about last time eat clams?” The answer is yes – green crabs will eat clams, and eat a lot of them!
- Explain that green crabs eat clams, but there are not a lot of predators in Maine that eat green crabs. Ask youth if they think this could be a problem for Maine’s coastal ecosystem and to explain their thinking.
- If you did not have time to watch the Attack of the Green Crabs (O’Chang Studios, YouTube) video mentioned previously in the second activity and you have a computer and projector now would be a good time to show it.
Explore
Review the video instructions below or:
Video — Activity 4: How fast do invasives multiply?
- Break youth into groups of four and pass out materials. Each group will receive two dice, one Data Sheet 1, one Rule Sheet 1, a pencil, and two colors of plastic disks to use as manipulatives.
- Explain the roles shown below. Have each group decide who will have what role. Alternatively, the roles could be assigned by the facilitator by having youth count off by 4s and have all the 1s have the role of data keeper, 2s and 3s dice rollers and 4s population trackers. If there is a group of 3 have one youth roll for both the crabs and clams. If there is a group of 5 you can have two population trackers, one for crabs and one for clams.
- Data keeper: keeps track of the values rolled on the data sheet. This job can get complicated so it is recommended this is their only job.
- Die roller 1: rolls the die for the green crab turns
- Die roller 2: rolls the die for the soft shell clam turns
- Population tracker: works with the data keeper to use the plastic disks to keep track of the number of individuals in each population
- Have youth look at their data sheet. Notice that there is space to follow their green crab and clam population for three seasons. Ask them how many crabs and clams they are starting season 1 with (10 crabs and 20 clams). Explain that green crabs are a new species to this area so their population has not established itself the way the native species of clam has.
- To start, each group needs to count out 10 plastic disks of one color to represent the green crab population and 20 plastic disks of another color to represent the clam population.
-

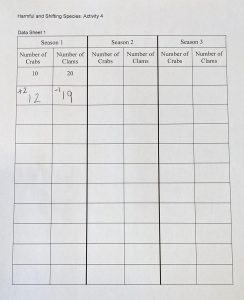
Figure 1: Example of a data sheet filled in after one roll for green crabs and one roll for clams. It is important that as youth do the simulation they work together as a group. The die roller will roll the die then read the rule sheet to the group. The population tracker will add or take away plastic disks of the right color based on what the die roller reads. The data keeper will fill in the data sheet for how many crabs or clams are in the population. They may find it helpful to write the number they are adding or subtracting small in the corner of the square for that roll and then writing the total larger in the center.
- It is important that everyone has a chance to complete their task before going on to the next roll. The first roll should be for the crabs then the next for clams. They should alternate crab and clam turns until they have filled in a full season on the data sheet.
- As groups work the data sheet keeps track of the number of animals in the population after each roll, while the plastic disks show the numbers at the present time/cumulatively. The data sheet can be used to look back on and show the totals throughout the ‘season’. Note – for younger audiences or small groups, you may choose to not use the data sheet, and simply use the manipulatives.
- At the end of the first season the youth stack their plastic disks by color to represent the amount of clams and green crabs that they have. This can be used to visually compare their crab and clam populations as a ‘bar chart’.
- Have groups leave their stacks and data sheets on their table as a display. Youth should walk around the room and look at the other groups’ results. Do this as a silent gallery walk without talking. Encourage the youth to think about what they notice. Do the stacks of disks look the same for every group? Do the data sheets all follow the same patterns? Is one species more likely to increase or decrease its numbers after each roll?
- Call the group back together and ask what they noticed. This can be what they observed in their small group as they rolled or in the results from the class as a whole. Example questions:
- “Was there more of one species left than the other?” “Was this the same for every group?”
- “Did the population for each increase or decrease?” “Which one increased more?”
- “Were there any patterns you noticed?”
- “Was one species more likely to increase or decrease after each roll?”
-

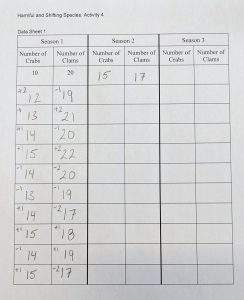
Figure 2: Example of a data sheet at the start of season 2. Have groups to complete the other two seasons on the data sheet. For each new season they start with the number that they ended with the previous season. This means that whatever number they ended with in the bottom square for season 1 is what they start with in the top square of season 2.
- For the second and third season you may choose to repeat the group walk that took place after season one.
- It would also be appropriate to do a quick check in after season two and see what trends the youth noticed. Are they the same as what they saw in season one? Ask participants to predict what will happen in the last season. What will have a greater population at the end of the third season? How are the three seasons similar or different?
Explain
- Help youth make sense of the data. Ask them what trends they noticed in each season. Example questions: “Was one species more likely to have its population increase or decrease?” “Why do you think that is?” “Look at the rule sheet, which species had a higher reproduction rate (added more with each reproduction roll)?” Was reproduction the only way a green crab could increase its population?” “Is that the same for the clam?” “Why do you think there are more opportunities for the green crab to increase its population?”
- Be sure to discuss the predator-prey relationship between green crabs and clams. Example questions: “Think about what we have learned about predators and prey in the food chain, which of these species has more predators?” “What does that mean for the crabs and clam populations?” “What is the relationship between green crabs and clams in the food chain?” “Did you see any evidence of green crabs affecting the clam population or vice versa?”
Elaborate:
- Pass out the second data sheet, and say we are going to repeat the game, but with green crabs and lobster. Example script: “Now that we have seen what happened for three seasons between the green crab and clam population, we are going to explore for a fourth season what might happen between the lobster and green crab populations.”
- Ask youth to predict what they might see happen with the lobster population. Why did they make this prediction? (note: green crabs don’t eat lobster, but lobsters eat clams.) Make sure youth understand that in the first scenario the relationship between green crabs and clams is predator and prey. The relationship between green crabs and lobsters is not a predator-prey relationship, but that of competitors for the same food source. They are predicting if the green crabs will have the same impact on the lobster population as the clams, even though they are not eating the lobsters.
- Have the youth discuss their predictions with their groups. This could be written on a whiteboard or the back of their date sheet.
- Ask a few groups to share their predictions. What evidence have they seen that led them to that prediction? Ask the youth to use what happened with the green crabs and clams to support what they think will happen with green crabs and lobsters.
- Play the game for another season (or more as time allows) using the green crab and lobster rule sheet and data sheet. The green crabs can stay as the same color disks, and the lobsters can be the disk color that was once clams.
- After the youth have rolled the dice on one more season, bring the group back together. Example questions: “What did you notice or observe?” “Were your predictions correct?” “What evidence supports your claim?”
Evaluate/Reflect
- Reflect on today’s activities. Example questions: “What impact does having green crabs move into a new area have on the ecosystem?” “Why do you think this and what evidence do you have to support it?” “What’s the difference between invasive species, and non-native or introduced species?”
- If the youth are struggling with this, ask them to think about what eats the green crab and how likely was a green crab’s population to decrease? Remind youth from the last lesson about how the green crab got to Maine – is this their natural habitat?
- Discuss what an increased green crab population means to the Maine coast. Have youth think back to the food web activity, what happened when they added green crabs to the web? Invasive species like green crabs affect more than just clams and lobsters. What could happen in the future with growing green crab populations?
