Offshore Wind
Renewable energy is changing as new research is conducted. Some of the newest research is on offshore wind power development and much of the cutting edge research is done at the University of Maine! The Offshore Wind toolkit will engage youth in activities that highlight the importance of renewable energy, the difficulties in siting a windmill offshore, and the engineering that goes into building a wind platform that floats in all kinds of weather!
Notice: This toolkit is bulky.
Funding for this lesson plan was provided in part by the University of Maine System, the University of Maine College of Engineering, and the University of Maine Advanced Structures and Composites Center.
Are you interested in learning more about what the University of Maine and UMaine system campuses offer?
The University of Maine offers over 100 academic majors! To learn more either:
Visit UMaine’s Find a Major.
Explore our other campuses here.
If you need help connecting to UMaine or one of the other UMaine System campuses, contact us by email or call 207.581.3877 and ask for Laura, Greg, or Sarah.
Video: 4-H Science: How to Build Your Own Anemometer (YouTube)
Are you excited about wind energy? If yes, there are opportunities to learn more about the current research on offshore wind power!
For Elementary through High School Aged youth who are excited about wind power, tours are available at the University of Maine. The Advanced Structures and Composites Center welcomes 4-H youth to campus for tours and hands-on wind power activities: create a floating wind platform and test it! To schedule a visit for your group, contact your UMaine Extension County Office, and they will work with campus staff to arrange a convenient time.
For Middle and High School Age Youth there’s an opportunity to join the Advanced Structures and Composites Center each spring for the WindStorm Challenge! Windstorm Challenge is a floating offshore wind invention competition free for all Maine middle school and high school-aged students. Youth work in teams of up to four and winning team members received a $20,000 internship at the University of Maine’s Advanced Structures and Composites Center. Learn more and sign up on the Advanced Structures & Composites Center website.
Curriculum Activities
Lesson 1: Offshore Wind Power and Renewable Energy
As the world’s population grows and demands more and more electricity, we are in a race to find reliable, renewable ways to power the planet without relying on resources that we will one day deplete.
That’s why renewable energy has come into the spotlight in recent years. Renewable energy is energy that comes from sources that are constantly replenished, such as solar, geothermal, wave, tidal, or wind resources. Conversely, this means that nonrenewable resources are resources that, once used, can’t be used again and aren’t replaced as easily as renewable resources. For example, coal and oil take far longer to be created than solar energy, which is available when the sun rises, or wind power, which is readily available whenever the wind is blowing.
For over ten years, Maine has focused wind power because the state has one of the best wind resources in the world, both on land and offshore in our gulf. More specifically, Maine has helped develop technologies that can access a revolutionary renewable energy source known as deepwater offshore wind. The staff and students working with Dr. Habib Dagher, P.E., Director of the Advanced Structures and Composites Center at the University of Maine, have worked tirelessly to create floating offshore wind turbines that can access winds in deep waters in the Gulf of Maine.
Their inspiration for this project comes from floating oil rigs in use all over the world to drill for oil in oceans, shallow water offshore turbines operating successfully in Europe since 1991, and Maine’s vibrant boatbuilding industry.
But Europe has shallower water than we do in Maine. Europe’s offshore turbines are designed for shallow water, so they are built on towers called piles and driven into the ocean floor. However, Maine’s ocean gets very deep very close to shore. Driving piles into the ocean floor in deep water is very expensive.
UMaine’s Composites Center is on the leading edge of offshore wind technology development. To date, UMaine has raised and spent more $53 million over five years to develop offshore wind technology.
In early 2013, the VolturnUS 1:8, a semi-submersible design made of a concrete hull and a composite tower, was fabricated at UMaine’s Composites Center by UMaine and Cianbro, assembled at Cianbro’s Brewer, Maine facility, then towed down the Penobscot River and anchored off Castine, Maine by Maine Maritime Academy. The approximately 65-foot-tall turbine prototype is 1:8th the scale of a 6-megawatt (MW), 423-foot rotor diameter design. This is the first offshore wind turbine in the Americas and has sent electrons to the Central Maine Power Grid since June 13, 2013.
For more information about the VolturnUS, read Lesson 3: Voluturn 1:8.
Activity 1: Renew-a-Bean
 Objectives
In this activity, youth will learn about renewable resources versus nonrenewable resources, and how conservation and new technologies are needed to prevent the complete elimination of nonrenewable resources.
Time to complete activity: 25-30 minutes
Materials
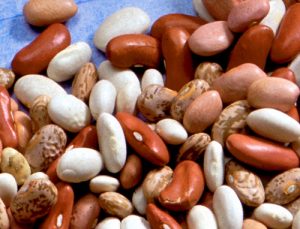
- one small bag of “resources” per group (this includes a Ziploc bag containing 45 red kidney beans and five white lima beans for a total of 50 beans per bag.)
- one large bag of “resources” per group (this includes a Ziploc bag containing 90 red kidney beans and ten white lima beans for a total of 100 beans)
- one copy of the worksheets for each group member:
- large paper or plastic cup for holding “used resources”
- pencils
The electricity that we use every day comes from two different kinds of resources, renewable resources and nonrenewable resources. Renewable resources are resources that can be used again, that regenerate, or that are available in an almost never-ending supply. Nonrenewable resources, on the other hand, are resources that can be used only once and are then used up completely.
Take a moment to brainstorm some examples of renewable and nonrenewable energy resources. How many can the youth come up with?
Methods
The point of this activity is to demonstrate the consequences of relying too heavily on nonrenewable energy resources. The red beans represent the nonrenewable resources and the white represent the renewable resources.
- Have one person in the group pick 5 beans out of the bag without looking.
- Count how many red beans and how many white beans were removed from the bag and record the information on the data sheet.
- Once the beans have been counted and the number of each color removed has been recorded, place the red beans in the cup and put any white beans back in the bag. Since the red beans represent nonrenewable resources, after they have been removed from the bag they are considered “used up” and are no longer viable. Since the white beans are renewable, they can go back into the bag to be used again.
- Continue this pattern until you have drawn from the bag 20 times or until you are left with only white beans in the bag.
Once all the youth have finished the activity, have them put the beans back in the bags and regroup. The previous activity was great to demonstrate the differences between renewable and nonrenewable energy resources at a constant rate, but as we know, the consumption of electricity is ever on the rise. Therefore, this model the youth just worked with is not applicable to the real-life model.
Next, each group of youth will need the next size up, the bags with 100 beans in them.
- Same as before, have one group member remove five beans from the bag without looking.
- Record how many of each color of bean was removed from the bag.
- Once the numbers of each bean have been recorded on the data sheet, put the red kidney beans in the cup and any white beans that were removed back in the bag.
- Here is where it’s different from before: since electrical demand is always on the rise, we will increase the amount of “energy resources” used by two each subsequent turn. For example, instead of picking out five beans on the second turn, the youth will now pick out seven.
- Repeat steps two-three.
- Youth will then remove nine beans from the bag
- Repeat this pattern until either all of the nonrenewable resources have been used up or until the group has removed beans from the bags 30 times.
Questions to Discuss
- How many turns did it take for your group to deplete the nonrenewable resources when consumption remained constant?
- Did you notice a pattern as you took more turns? Around what turn did you start to see an increase in the number of white beans you removed from the bag each turn? Did the same thing happen when you increased the number of beans you drew each turn? Around what turn did you see the increase in part two?
- What does this activity show about our consumption of nonrenewable energy resources?
Can we continue to consume high levels of nonrenewable energy resources like we have been for many years to come?
Lesson adapted with permission from the California Energy Commission’s “Energy Quest” lesson plan.
Lesson 2: Prerequisites to Building: Measurement and Mapping
Before something is built, there is a great deal of measurements that have to be taken and maps that need to be drawn. This is no different for areas that are thought to be prime locations for deep-sea offshore wind farms. A wind farm is a group of many wind turbines in the same general area, and a large-scale wind farm project has been proposed for the Gulf of Maine as early as 2017. However, that is not possible without first making sure that the area that’s been chosen is a decent location for these turbines to be located.
Obviously, one of the most important things to know about an area where a wind farm project is proposed is, does the wind actually blow enough here? The answer, in this case, is yes. The Gulf of Maine has an extremely high potential for wind power production. Over the course of the year, about 150 gigawatts of wind blows in the Gulf of Maine. Let’s put that into perspective. If you were to leave a 1500 watt hair dryer running all day every day, it would take more than 70 years to use 1 gigawatt of electricity.
An important measurement tool for the offshore wind industry is the anemometer. An anemometer is simply a device used for measuring wind speed. Many people have seen one but probably didn’t know what it is. Anemometers come in all shapes and sizes; some have cups, some look like small handheld turbines. Some people have them near their homes; there are anemometers at airports, television stations that report on the weather. There are 3 relatively small anemometers attached to the VolturnUS 1:8.
A second important tool for the deep-sea offshore wind industry is the use of bathymetry. Bathymetry is the study of the depth of underwater lake or ocean floor. As you can imagine, bathymetry is extremely important because of those anchors attached to the bottom of the VolturnUS. If the underwater area that the turbines are going to be situated over is very close to the surface, that may damage the platforms or other equipment, so it’s important to know the landscape.
While these two aspects of researching the area of a proposed offshore wind farm are extremely important, they aren’t the only aspects that are important.
Activity 1: How to Build Your Own Anemometer (YouTube)
Objectives
Before deciding where to place an offshore wind turbine, it is important to know whether the area being considered has high enough average wind speeds.
Time to Complete Activity: 25 Minutes
Materials
- 6″ plastic protractor
- 12″ to 15″ of thread or fishing line
- table tennis ball
- tape
- Kestrel 1500 anemometer (optional)
- yardstick
- box fan
Discuss what an anemometer is with the youth. Explain that they are used to calculate the wind speed in an area. Ask the youth if they can think of any jobs or professions besides those in the offshore wind industry that might utilize this device. Record their answers.
Some professions the youth might come up with:
- pilots
- fishermen
- meteorologists
- aerospace engineers
Methods
- Break the youth into groups of two or three; they will need to have at least one other individual in the group with them to assist with readings. Assign each group a distance away from the fan. (Works best in increments of 5. Start at 10 inches.)
- Attach one end of the thread to the table tennis ball with a small piece of tape. Have the youth make sure that they don’t use too much tape, as the extra weight of the tape my hinder the motion of the ball, therefore affecting the readings.
- There will be a small hole in the protractor at the 3-inch mark along the flat side (the ruler) of the protractor. Carefully thread the fishing line (or thread) through this hole and secure it with a knot.
- Hold the protractor so the table tennis ball and thread hang down across the 90º mark when there is no wind. Take a moment to remind youth to ensure that they are not standing between the anemometer and the wind source, the fan, as this will also affect readings.
- Place the yardstick (a flexible tape measure would work as well as a standard ruler) at the base of the fan. Ensure that your anemometer is the same distance from the fan each time you take a reading.
- Turn on the fan. Have the groups test their anemometers at all three settings on the fan. When measuring, the youth will record the angle on the protractor that the string crosses or hovers over while in front of the fan: Table to record wind speeds (PDF). Have them ensure each time that their table tennis ball begins directly above the required distance away from the fan.
- Then have the youth test with the anemometer included in the toolkits, the Kestrel, the actual wind speed of each of the three settings, recording this in the third column of their table. Remind youth to ensure that their Kestrel is the same distance from the fan as their protractor anemometer was.
- Regroup and compare the findings of the different groups.
Questions to discuss
- Different fan settings feel very different to us on hot days, but how much of a difference in speed is there between setting one and setting two? What about between setting two and setting three? Between setting one and three?
- What would you estimate the wind speed to be when the angle of the string is 85º? What about 25º?
- What could you do to improve the design of your anemometer?
Adapted with permission from National 4-H Curriculum Grab and Go materials, “Measuring Wind Speed.”
Activity 2: Mapping the Seafloor
Objectives
To show students the importance of knowing the topography of the ocean floor when preparing for the installation of deepwater offshore wind turbines.
Time to complete activity: 45-60 minutes
Materials
- square, one quart-sized food storage container
- 500-700 mL of water in a cup or bottle
- small plastic funnel
- 10 cm plastic ruler
- overhead projector transparency
- felt tip, waterproof marker
- approximately 12 inches of masking tape or transparent tape
- scissors
- two sticks of modeling clay
The process of mapping the seafloor is called bathymetry. Sailors have been using bathymetry for centuries to attempt to determine the landscape and elevation of the seafloor.
The oldest system was to drop a rope with a weight tied to one end off the side of the boat and extend the rope until it went slack, which was supposed to signal that the weight had hit the sea floor. But this, obviously, is a flawed technique. There is no way to guarantee that the rope with the weight went directly to the bottom, it may have drifted several meters or several hundred meters in any direction due to the current. It may have landed on the top of a seamount in a valley. It was not an exact science and therefore was minimally helpful.
Our new systems rely on sonar. Initially, it was individual beam sonar, and now it relies heavily upon what we call multi-beam sonar, which can cover an area between 90º and 170º wide and updates much more frequently than single beam sonar, which results in almost 100% coverage of the seafloor at all times. These advancements allow crews and researchers to cover more area in less time.
For this activity, youth are going to be creating underwater landscape features and charting them using contour lines. Contour maps, made using contour lines, are used to show the change in elevation of landmarks, both on land and underwater.
Methods
- Have the youth mold the clay into a few landscape features into the bottom of their plastic food container. (It is important that they don’t completely cover the bottom of the container with clay otherwise they won’t have anything to chart.)
- Place the ruler, with the highest number of measurement at the bottom, inside the food container, taping it to the sides.
- Cut the transparency to completely cover the top of the food container. It doesn’t have to be perfectly the size of the container; a little extra over the edges will not compromise the mapping. Secure with only as much tape as is needed to hold the transparency in place.
- Cut a small hole in one corner of the transparency, just big enough to fit the funnel inside. Place the funnel in the opening and secure carefully in place with tape.
- Looking down into the food container from directly above, take the waterproof marker and carefully trace where the bottom of the clay features come in contact with the bottom of the container. If in any place the features come in contact with a wall of the food storage container, do not draw the contour line. Carefully take the bottle, beaker or cup of water and add water until either 0.5 cm or 1 cm of depth is reached.
* This is up to the youth to decide on an interval. If the landscape primarily features are primarily tall and/or wide, the 1.0 cm interval should be used. If landscape features are thin, short, and/or small, youth should choose the 0.5 cm interval. Once the youth decide on an interval, it is important that they don’t change intervals - To continue with the chart, once again look down at the features from directly above, trace the outline of where the waterline meets the clay. Same as before, do not outline where the water meets the edges of the food container.
- Add another interval of water, whatever the youth chose for their individual food container. Repeat numbers 7 and 8 until all the landscape features are completely underwater.
- Carefully remove the funnel and the tape from the edges of the transparency. Pull the transparency away from the edges of the food container and remove entirely. What you see should be a contour map of the features in the bottom of the food container.
Questions to discuss
- Which interval was chosen, 1.0 cm or 0.5 cm? Why did the youth choose the interval that they did? Have youth compare their interval choices with other groups. Ask youth if they think their maps would look drastically different if they’d chosen a different interval.
- Maps are made to help people navigate areas they are unfamiliar with; the same goes for maps that demonstrate underwater elevation. If your food container represented a real stretch of the ocean floor, ask the youth how their map might help people and who their map might help. (I.e. professions that might use the map that they created.)
- Ask the youth if they think the underwater area that their map represents would be a good area for offshore wind development. Why or why not?
- What, if any, obstacles did the youth come across when charting their underwater topography? What did they do to overcome that obstacle?
Lesson adapted from NOAA Ocean Explorer, section 2, “Mapping the ocean floor: Bathymetry.”
Lesson 3: VolturnUS 1:8
-
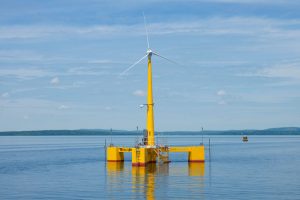
VolturnUS 1:8, designed by the UMaine Advanced Structures and Composites Center, is the first grid-connected offshore wind turbine in the Americas and the only floating turbine with a concrete hull in the world. The first electrons from VolturnUS flowed into the U.S. electric grid on June 13, 2013, in Castine, Maine. - Activity 2: Platform Building
Background
The VolturnUS 1:8 is the first grid-connected offshore wind turbine the Americas which, in itself, as a fantastic feat. But there is so much about the VolturnUS that is amazing.
Below are some facts about UMaine’s wind power projects:
- Full-size turbines may stand about 500 feet at the hub, will have a rotor as long as a football field, and the blades of the turbine will be as long as the wingspan of an Airbus jet (including the cabin), which measures in at about 200 feet.
- The turbine platform will be attached to the ocean floor with anchored tether ropes.
- Within 50 nautical miles of the United States coast, there is enough wind energy to power the country 4 times over.
- The state of Maine uses about 2.4 GW (gigawatts) of electricity annually. Over the course of the year, the Gulf of Maine sees about 150 GW of, as of yet untapped, wind energy resources.
- The specs for the full-size wind farm, expected to be installed by 2030 are as follows:
- 20 miles off the coast of Maine in the Gulf of Maine
- There will be 100 5 MW (megawatt) turbines
- The farm will cover an area of approximately 8 miles by 4 miles
- The installation and upkeep of this farm is expected to create 15,000 jobs in the state of Maine in the wind power field.
For more information about the wind power project, visit the following links:
- Dr. Habib Dagher (Principal Investigator for the DeepCwind Consortium and New England Aqua Ventus and Director of UMaine’s Advanced Structures and Composites Center) talks at TedxDirigo:
- Explore more about wind power or other projects that at the UMaine Advanced Structures and Composites Center website.
Definitions
- Grid: interconnected grid used to supply consumers with electricity from the electricity producers.
- Megawatts: equal to 1 million watts
- Gigawatt: equal to 1 billion watts
- Rotor: the moving part of the electrical generator located inside the turbine.
- Hub: where the blades are connected to the tower
Activity 1: Buoyancy
Objectives
To teach youth about the basics of buoyancy and why it is important to the deepwater offshore wind industry.
Time to complete activity: About 45 minutes
Materials:
- one yard (36 inches) of duct tape
- plastic or paper cups (must be 8oz or larger)
- 12-inch piece of plastic wrap
- ten straws (preferably non-bendable but either will work)
- twenty-five pennies (about 15 metal washers would do the trick too)
- towels (cloth or paper)
- plastic bin (or one of the provided aquariums) filled with water for testing.
Anything that floats is affected by what we call buoyancy. Buoyancy is a force in a fluid that pushes up, or opposes the weight, of an object immersed in the fluid.
The goal of this activity is for youth to build a boat that will float above water for at least 10 seconds while carrying a load of a minimum of 25 pennies. Youth can be as creative as they want, but remind them that the benchmark for successfully completing this activity is to have their finished boat carry 25 pennies (or 15 washers).
Methods
There are no specific instructions for how the youth should build their boat. They can be as creative as they want with the materials that are available to them.
It may take youth several tries to get their boat to stay afloat as well as supporting the weight of the pennies. This may take some experimentation with the placement of the pennies or with the design of the boat.
Questions to discuss
- Did the boat float on the first try? If not, what did the group determine was the problem with it? How did the groups fix these issues?
- Did groups put all the pennies on the boat at once, or one at a time to see how much it could withstand and build up from there?
- If the group put the pennies in a cup, did they experiment with the location of the cup on the top of the boat? Where was the best place for the cup to sit without capsizing the boat? Why do the youth think that is?
- Ask the youth if think it would have made it easier for the boat to float if the pennies were spread out evenly across the top of the boat or all in a centralized location, such as in a cup, on top of the vessel?
Activity provided courtesy of WGBH Educational Foundation. All rights reserved.
Activity 2: Platform Building
 Objectives
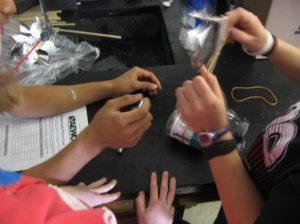
Youth will build their own floating offshore wind platform and test its performance in the provided wind/wave tank.
Time to complete activity: About 45 minutes
Materials:
- “wave tank” testing area
- thirty-gallon aquarium
- wave making device
- water
- one pinwheel for each group
- rubber bands
- dowels
- paper clips
- soda bottles
- balloons
- foam cubes
- duct tape
- washers
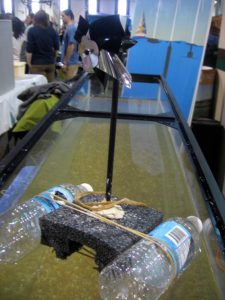 Using what the youth already have learned from the previous activity about buoyancy, expand on the lesson by having them design and test their own floating platform like the pros.
The goal of this activity is for youth to build their own floating wind turbine platform, similar to the VolturnUS 1:8, and test how it stands up to different wave conditions.
Before beginning this activity, discuss with youth that each material that they may choose for their platform has a set of “costs” associated with it. For each material, there is an associated materials cost as well as a carbon-offset cost. This is to simulate both the monetary cost of the project as well as the environmental cost. The goal is to keep costs low while maintaining the structural integrity required to keep the turbine and platform secure and floating through multiple wave conditions.
Methods
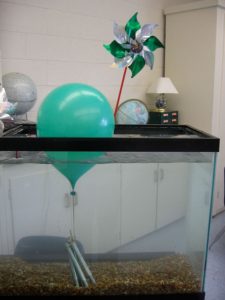 Explain to the youth the point of the activity. To build a floating platform for their turbine that will withstand different wave conditions while keeping manufacturing and carbon costs associated with materials as low as possible.
- Youth must use the minimum listed amounts of materials. If they need one rubber band, they must take all 4 and write down the cost towards their total cost on the Materials Cost List for Lesson 3, Activity 2 (PDF).
- Next, have the groups design their platform. Have them gather the supplies they wish to use for their platform and get it assembled.
- Have groups test their platforms. They may use the sheet, Scoring for floating platforms, optional (PDF).
Questions to discuss
- Why is it important to take both manufacturing costs as well as carbon-offset costs into consideration when building the turbines?
- Where in the country would offshore wind be feasible? Where would it not make sense? Why?
- Did the platform perform as you expected it in the waves? What would you do differently? (If time permits, allow the youth to redesign; the redesign is an important step in the engineering process).
- What mattered when it came to buoyancy — weight or shape? What other materials would you have like to have available for this activity?
Lesson adapted with permission from “Inventing a Floating Platform.” Activity created by the University of Maine Advanced Structures and Composites Center.
